Assessing conservation regionalization schemes: employing a beta diversity metric to test the environmental surrogacy approach
Abstract
Aim
Systematic conservation planning often involves the application of a regionalization scheme, which is assumed to delineate distinct ecological communities of target species. Commonly, such schemes are constructed using environmental surrogates; however, their effectiveness with regard to community delineation has been questioned in previous studies. Here, we aim to assess multiple environmental regionalization schemes' ability to delineate avian communities and to evaluate these schemes against a regionalization scheme built using species data directly.
Location
British Columbia, Canada.
Methods
We employed a beta diversity metric using community data from the BC Breeding Bird Atlas in multiple analysis of similarity (ANOSIM) tests, to assess the ability of a number of environmental regionalization schemes to delineate species turnover. We also developed a new species-based scheme using kriged local beta diversity values and a thematic resolution optimized through ANOSIM testing, which was then evaluated against the previously tested schemes.
Results
All regionalization schemes delineated significant patterns in community structure, with the Bird Conservation Regions performing most similarly to the species-based regionalization. Regionalizations that required regions to be spatially contiguous outperformed non-contiguous regionalizations. Increasing thematic resolution (the number of regions within a regionalization) improved a regionalization's overall performance; however, regional redundancy also increased.
Main conclusions
We argue that environmental regionalizations can function as effective alternatives to species-based regionalizations, particularly in areas with poor availability of species data. Also, we conclude that spatially contiguous regionalizations are superior to non-contiguous ones for delineating distinct communities. Lastly, we demonstrate how thematic resolution represents a trade-off between overall regionalization performance and regional redundancy, and how differing thematic resolutions can be employed depending upon the goals of the user.
Introduction
The decline of global biodiversity has been well documented (IPCC, 2007; Pereira et al., 2010) and as a result biodiversity has become a major driver of conservation planning (Knight et al., 2007; Rands et al., 2010). Generally, the method most often used for protecting biodiversity has been establishing reserve systems, which provide habitat for target species and separate them from threats present elsewhere (Margules & Pressey, 2000; Rodrigues & Brooks, 2007). For a reserve system to be successful, it should meet two criteria: it should (1) represent a region's biodiversity and (2) ensure that the biodiversity it protects persists through time (Margules & Pressey, 2000).
To address the first criterion, representation, a conservation strategy will often begin by subdividing the land base into conservation units/regions/land cover types, which are expected to delineate environmental conditions and thus distinct communities of target species (Olson et al., 2001; Leathwick et al., 2003; Oliver et al., 2004). As species data are typically not available with adequate spatial coverage for conservation planning, environmental proxies are commonly employed with the goal of representing distinct species assemblages (Margules et al., 2002).
Once a conservation regionalization scheme has been developed, a reserve system can be designed with specific regional site prioritization (Belbin, 1993). This strategy employs the concept of complementarity – that multiple reserves located within different regions of a planning area will be able to fully represent a large portion of that area's biodiversity (Pressey et al., 1993; Howard et al., 1998; Rodrigues & Brooks, 2007). If the regionalization scheme is effective at delineating distinct communities of target species, then the resulting reserve system should conserve the full suite of species without large amounts of redundancy occurring (Reyers et al., 2002). However, if the regionalization is ineffective at delineating distinct faunal communities, the reserve system risks missing important species and/or requiring more land than is necessary for full species representation (Fox & Beckley, 2005).
A range of methods have been proposed for developing conservation regionalization schemes, each of which employs their own suite of environmental variables and rules for delineation, leading to inconsistent partitioning of the landscape (Bailey et al., 1985; Pressey & Logan, 1994; Olson et al., 2001; Leathwick et al., 2003; Oliver et al., 2004; Mackey et al., 2008; Kreft & Jetz, 2010). Complicating issues further, the effectiveness of these schemes to act as a surrogate for delineating distinct communities of target species has been called into question due to regionalizations not capturing environmental variables that are meaningful to community composition (Bonn & Gaston, 2005; Kirkpatrick & Brown, 1994; Lombard et al., 2003; but see Trakhtenbrot & Kadmon, 2005).
Thematic resolution (i.e. the number of regions within a regionalization) is an important consideration when developing conservation regionalizations (Pearson & Carroll, 1999; Pharo & Beattie, 2001). With too fine a thematic resolution, the area requirements for a reserve system may be excessively large with high levels of redundancy between reserves (Andrew et al., 2011). Conversely, a regionalization scheme with an excessively coarse thematic resolution risks missing species protected in a reserve system due to difficulties representing the full variability of large, heterogeneous regions (Wiens, 1989; Pressey & Logan, 1994). The choice of which thematic resolution is most appropriate for a particular region requires a balancing of these two factors.
Additionally, regions within a regionalization scheme can be derived using different rules regarding spatial contiguity (Andrew et al., 2011), either requiring regions to be spatially contiguous or allowing particular regions to occur at multiple locations. While spatially contiguous regions may reflect the natural autocorrelation which occurs in biological communities (Oliver et al., 2004), they may not be effective in delineating naturally fragmented ecosystems such as alpine or riparian areas.
As the goal of a regionalization is to delineate distinct ecological communities (Margules et al., 2002), it follows that the core area of each region should have low levels of spatial turnover in species composition, or beta diversity (Whittaker, 1972). Conversely, the borders should represent areas of high beta diversity, because it is at the borders where the transition between communities occurs. Therefore, an alternative approach to developing regionalization schemes is to use available biological data to delineate regional boundaries based on where community beta diversity values are highest. Such a species-based regionalization scheme could act as a best case scenario for comparison with environmental regionalization schemes.
Data sets such as bird and butterfly atlases, which focus on a particular taxon for one period in time and one region (i.e. a state or province), provide a basis for evaluating the effectiveness of alternative regionalization schemes in an empirical manner. As such, the primary goals of this paper are the following: first, to use Breeding Bird Atlas data to analyse the performance of different types of environmental regionalization schemes in British Columbia (Canada); and second, to use the bird data to develop a species-based regionalization scheme based on beta diversity gradients in comparison with the previously tested environmental regionalizations. We asked the following questions with regard to conservation regionalization schemes: (1) do environmental regionalizations effectively delineate avian communities, and how does their performance compare to a regionalization built using species data directly? (2) How is the performance of regionalizations affected by enforcing spatial contiguity within regions? (3) What effect does changing thematic resolution have on regionalization performance?
Methods
Bird community data
The BC breeding bird atlas
The BC Breeding Bird Atlas (http://www.birdatlas.bc.ca/) is a 5-years project undertaken by Bird Studies Canada, which is due for completion in 2012 and involves surveying 100 km2 cells throughout the province for evidence of breeding birds. To date, over 200,000 records document all breeding evidence, highest breeding evidence, rare and unique species and raw point count data, as well as information on survey effort, measured as hours spent surveying each cell. Species data are recorded as presence/absence for the 316 breeding species detected across 3547 sampled cells. Highest breeding evidence data from 2008 to 2011 are used for this study (2012 data are not yet available) as they summarize the most conclusive evidence of breeding from the all breeding evidence data set, producing one presence/absence value for each species within each cell.
Bird community data analysis
Citizen science data sets are known to contain biases due to uneven sampling effort (Moerman & Estabrook, 2006; Andrew et al., 2011), sampling intensity (Schulman et al., 2007) and surveyor skill (Ahrends et al., 2011). The confounding effects of variable sampling effort (measured as hours spent surveying each cell) and intensity (the number of adjacently sampled cells – including diagonals) on observations of bird community composition were tested using partial canonical correspondence analysis (pCCA) (Ter Braak, 1986; Borcard et al., 1992; Palmer, 1993) to evaluate the amount of variation in Atlas data explained by different regionalizations, which was also explained by sampling covariates. Survey effort recordings were missing from 827 cells, which were therefore excluded from these analyses, leaving 2720 cells. Effort and intensity were partitioned out individually and collectively during the pCCA analyses to test their ability to explain community composition, as well as shared explanatory power with each regionalization scheme tested. Additionally, simple linear regression was used to evaluate whether per-region performance was influenced by sample cell density.
Environmental regionalization schemes
Five environmental regionalization schemes were tested, each of which represents a different method for partitioning a land base using environmental, spatial and abiotic variables at varying thematic resolutions (number of regions within a regionalization) and with differing spatial constraints (contiguous regions vs. non-contiguous regions; Table 1). Each regionalization incorporates information from at least one of the three themes identified by Mackey et al. (2008) as useful for creating biogeographical regionalizations: (species composition; ecosystem drivers; and ecosystem responses).
| Regionalization scheme | Thematic resolution | Mean region size (km2) | Min. cell number | Max. cell number | Contiguous regions |
|---|---|---|---|---|---|
| BCR | 5 | 188947 | 242 | 1566 | Yes |
| Ecoregions | 44 | 21471 | 6 | 392 | Yes |
| BEC | 14 | 67481 | 29 | 647 | No |
| Species-based | 12 | 78728 | 112 | 556 | Yes |
| RS 5 | 5 | 188947 | 52 | 1877 | No |
| RS 17 | 17 | 55573 | 7 | 635 | No |
| 100-km grid | 121 | 7808 | 2 | 82 | Yes |
| 800-km grid | 5 | 188947 | 24 | 1319 | Yes |
The North American bird conservation regions
The North American Bird Conservation Initiative (http://www.bsc-eoc.org/nabci.html/) was created in 1998 as a partnership between governments, industry and environmental organizations in North America to improve avian conservation (North American Bird Conservation Initiative, 1999). One of the major developments from this initiative was the North American Bird Conservation Regions (BCR), which aimed to create biologically meaningful conservation regions containing distinct bird communities around which tailored conservation strategies could be developed, without consideration of political boundaries. The delineation of these regions was based on existing land classifications as well as expert opinion regarding bird distributions. As such, the BCRs incorporate information from Mackey et al.'s (2008) species composition and ecosystem drivers themes.
There are five spatially contiguous BCRs contained within BC, largely corresponding to the ecozones put forward by the National Ecological Framework for Canada (Ecological Stratification Working Group, 1995) – described in more detail in the following section. The BCRs have been used in planning exercises by Environment Canada (NABCI Canada, 2012) and the United States Fish and Wildlife Service (NABCI U.S.Committee, 2009), among others. To our knowledge, the BCR system has not been assessed to determine how effective it is at delineating distinct North American bird communities, which is surprising, given that this was the original purpose of the project.
The Canadian ecoregions
Ecozones/ecoregions are contiguous parcels of land, which are expected to contain similar biotic and abiotic conditions, with ecoregions being the finer of the two thematically (Bailey et al., 1985; Olson et al., 2001). The classification is based on mapped environmental, geological and climate variables, as well as expert opinion. Ecoregions have been used to identify representation targets for conservation (Olson & Dinerstein, 1998; Wiersma & Urban, 2005) and are also used as the primary regionalization scheme for conservation organizations such as The Nature Conservancy (Groves et al., 2000).
The ecoregions of Canada were delineated by the National Ecological Framework for Canada (Ecological Stratification Working Group, 1995) and are subdivisions of the Canadian ecozones. Ecoregions are characterized by distinct assemblages of landforms, climate, soil and human uses; therefore, the information used to delineate the ecoregions falls under the ecosystem drivers theme (Mackey et al., 2008). There are 44 spatially contiguous ccoregions in British Columbia. Evaluations of the effectiveness of ecoregions for delineating distinct communities of organisms have been mixed. McDonald et al. (2005) found little evidence that ecoregions are effective at delineating distinct bird, mammal or tree species. Supporting evidence, however, has been found for bumblebees (Williams, 1996), birds (Williams et al., 1999) and butterflies (Andrew et al., 2011).
The BC biogeoclimatic zones
The British Columbia Biogeoclimatic zones (BEC) were first developed in the 1960s (Pojar et al., 1987) but have undergone continuous refinement since this time. The BEC system uses local soil, vegetation, topography and climate data to delineate distinct ecosystems, with vegetation being most influential (British Columbia Forest Service, 2012). The BEC system incorporates information from both the species composition and ecosystem drivers themes (Mackey et al., 2008). Similar to ecozones, the classification is hierarchical, with BEC zones being the broadest; however, BEC zones are not required to be contiguous, and consequently, unlike the ecoregions, are able to reflect the zonation of environmental conditions along elevational gradients. The version of BEC used in this study defines 14 zones for BC. To our knowledge, BEC has not been tested for its ability to delineate distinct communities of organisms, although similar types of regionalizations have been developed recently (see Mackey et al., 2008).
Remotely sensed unique BC ecosystems
Fitterer et al. (2012) created a regionalization scheme for BC by modelling 10 remotely sensed (RS) physical (elevation and soil wetness), available energy (solar insulation and snow melt) and vegetation productivity (fraction of photosynthetically active radiation) variables in a two-step hierarchical clustering framework, creating a unique ecosystem classification for the province. This regionalization scheme incorporates information from both the ecosystem drivers and ecosystem responses themes (Mackey et al., 2008). The resulting regionalization schemes were produced at variable thematic resolutions based solely on environmental variables without any spatial contiguity requirements. The thematic resolutions tested were the following: 5, 7, 10, 14 and 17 classes produced at a 10-km spatial resolution to match the avian community data.
Spatial grids
Proximity in space is known to be a significant determinant of community composition (Nekola & White, 1999) and as such communities typically are less similar as the distance between them increases (Andrew et al., 2012). It is common for species composition to be spatially autocorrelated due to autocorrelation in abiotic conditions and/or dispersal limitation (Legendre, 1993; Nekola & White, 1999). In fact, it has been argued that community spatial autocorrelation is necessary for community functioning and should be considered in a more positive light, rather than as a statistical nuisance (Legendre, 1993).
To examine the effects of space on community structure, eight square grids ranging from 100 to 800 km resolution were developed and used as regionalization schemes that did not explicitly consider environment variables (Andrew et al., 2011). This allowed for a repeatable comparison of the effects of thematic resolution on community spatial structure without any consideration of environmental effects.
Testing regionalizations using community analysis
Each conservation regionalization scheme was tested in terms of its ability to delineate patterns of beta diversity exhibited by the BC Bird Atlas data, using the analysis of similarity test (ANOSIM) developed by Clark (1993). Beta diversity was assessed using Jaccard's distance (identified as a suitable dissimilarity measure by Anderson et al. (2011); Tuomisto, 2010), which is a measure of species not shared between sites in a pairwise comparison and does not consider joint absences. ANOSIM tests whether dissimilarity values (Jaccard's distance in this case) contained within regions are significantly different from those between regions. This is carried out in a nonparametric fashion: first, by rank ordering all Jaccard's distances from both within and between regions, and second, by taking the difference of mean within region rank and mean between region rank, standardized by sample size. The ANOSIM test produces an R statistic ranging from −1 to 1. A value of 1 indicates that all within region distances were ranked lower than all between region distances, while −1 indicates the opposite. A value of 0 indicates no difference in mean rank for within or between region distances. The ANOSIM test makes no assumptions regarding the distribution of distances and provides an R statistic which allows for regional comparisons beyond significant/non-significant results. Significance was tested through permutation (1000 ×), with α = 0.05.
Three different ANOSIM tests were performed based on Andrew et al.'s (2011) analysis of regionalization schemes using butterfly community data. The first two, termed ‘Grand’ ANOSIMs, analysed the ability of each regionalization scheme as a whole to partition British Columbia into regions of distinct avian communities. Grand Overall (GO) tested all regional within and between distances, providing one ANOSIM R statistic for each regionalization. This test examined a regionalization's overall ability to delineate community structure across the province.
The second ‘Grand’ test, referred to as Grand Adjacent (GA), also employed all within region distances, but restricted between region distances to regional pairs that were adjacent in physical space, again producing one R statistic for each regionalization. This test evaluated each regionalization's ability to delineate avian communities when considering only neighbouring regions, which are expected to be most similar due to their spatial proximity. An effective regionalization scheme should produce a large R statistic for both the GO and GA tests (Andrew et al., 2011), indicating that the regionalization delineated significant patterns in avian communities regardless of which regions were considered in the ANOSIM models.
Not all regions within a regionalization are expected to perform equally, however, which prompted an additional test, termed Regional Adjacent (RA). The Regional Adjacent (RA) test evaluated each region's within distances against the between distances shared with its neighbouring regions in physical space. This test was used to assess regional redundancy within each regionalization, examining whether a regionalization contained regions which did not delineate communities significantly different from surrounding regions.
Derivation of a species-based regionalization
Beta diversity spatial modelling
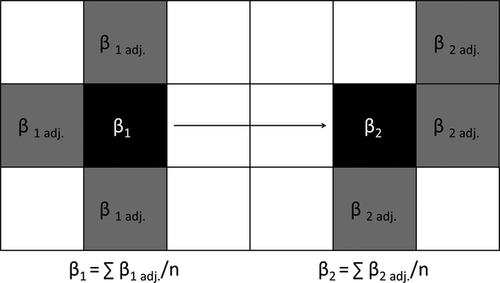
As Jaccard's distance is a pairwise comparison of sites located at two different points in space, a single beta diversity value calculated between sites cannot be located spatially. Modelling beta diversity at a point in space requires averaging pairwise beta diversity values between that point and multiple other points. This study used the average pairwise Jaccard's distances between each cell and its direct neighbours – including diagonals – within a 3 × 3 moving kernel (Fig. 1). Beta diversity was estimated only for cells with at least two neighbours (yielding a total of 3377 cells used to map average beta diversity).
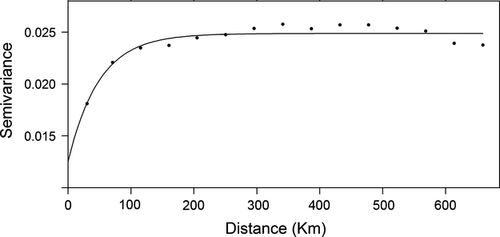
Due to gaps in the spatial coverage of the Atlas data, interpolation was required prior to delineation of the land base along beta diversity gradients. The map of local average beta diversity was tested for spatial autocorrelation using a semi-variogram. Eight different model fits were iteratively tested, with the lowest Root Mean Squared Error model selected for (model = exponential, range = 200 km, sill = 0.023, RMSE = 2.56 × 10⁻³; see Fig. 2). Universal kriging was then carried out to estimate beta diversity of all non-sampled cells (6070 non-sampled cells were estimated) (Olea, 1974; Pearson & Carroll, 1999). Beta diversity contours were identified using the isolines tool in ArcGIS 10.0 (ESRI, 2011).
Delineation of regions
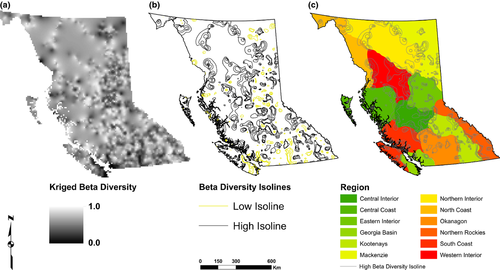
A new, species-based, spatially contiguous regionalization scheme was developed using the beta diversity map (Fig. 3) and the thematic resolution (12 regions) indicated as optimal in the testing of two of the environmental regionalizations: Fitterer et al.'s (2012) RS ecosystems; and the spatial grid regionalization. Regions were delineated manually along zones of high turnover, identified using beta diversity isolines (Fig. 3). The performance of the species-based regionalization scheme was then compared to the environmental regionalizations using all three ANOSIM models.
While the assessment of the species-based regionalization may seem circular, in that data used to produce the beta diversity map were then used during its assessment, the number of pairwise comparisons considered during the creation of the species-based regionalization scheme (17,958 pairwise comparisons) made up 0.30% of the total pairwise comparisons used in the ‘Grand’ ANOSIM tests (over 6.2 million pairwise comparisons). Essentially, the ANOSIM tests considered regional dissimilarities as a whole, while the species-based delineation identified areas of abrupt species turnover in physically adjacent sites (i.e. regional contents vs. regional boundaries).
Statistical computations
All ANOSIM tests as well as the averaging kernel were written by the authors in r version 2.15.1 (R Core Development Team, http://www.r-project.org/). Functions in the ‘vegan’ add-on package were used to calculate Jaccard's distances and to perform pCCAs (Oksanen et al., 2008). Universal kriging was carried out using functions in the add-on package ‘gstat’ (Pebesma, 2004).
Results
BC breeding bird atlas analyses
Survey effort and intensity explained low, yet statistically significant, variation in the BC breeding bird atlas data through pCCA (1.49% variation explained, pCCA P < 0.005; data not shown). Effort (hours surveyed) explained 0.78% of community variation, while intensity (n neighbouring sites), 0.91%. On average, the estimated ability of environmental regionalizations to represent avian communities was 88.34% (SD = 7.21%) uncontaminated by the effects of sampling effort and intensity. Given the low explanatory power of effort and intensity and lack of shared explanatory power between these covariates and the regionalization schemes, all survey points, regardless of recorded effort in the ANOSIM analyses, were used during further testing.
ANOSIM analyses
All regionalizations that incorporated measures of environmental variation (i.e. excluding the spatial grid regionalizations) delineated highly significant patterns in beta diversity (P < 0.001; Fig. 4). When considering all within and between distances (GO), the ecoregions were the most effective at delineating beta diversity, followed closely by the species-based regionalization. However, when restricting between distances to neighbouring regions (GA), the species-based regionalization was most effective at delineating patterns in beta diversity, followed by the Bird Conservation Regions and the RS region at a thematic resolution of 14. A peak in ANOSIM R values was evident for the RS regionalizations – consistent between GO and GA tests – occurring between 10 and 14 regions, indicating an optimal thematic resolution in this range.
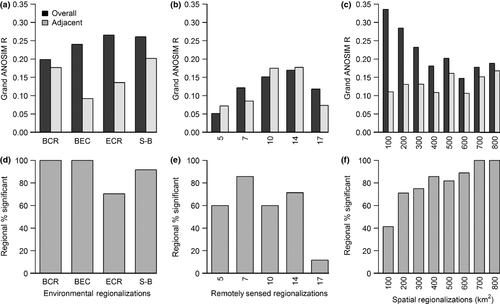
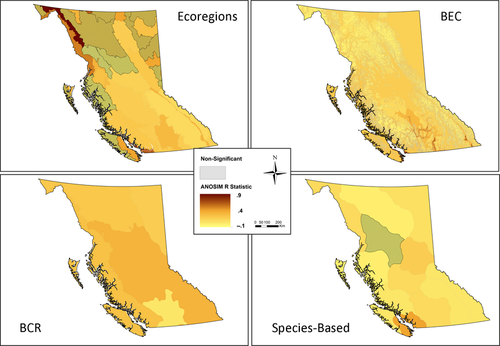
The percentage of statistically significant regions produced by the RA test revealed similar results for the BCR, BEC and species-based regionalizations, with all three containing over 90% regions that were distinct from their neighbours (Figs 4 & 5). Conversely, 30% of the regions within the ecoregions regionalization were found to be not significantly different from their neighbouring regions. The per-region ANOSIM R values varied markedly across different schemes, from slightly negative (R > −0.1) to strongly positive (R > 0.8). A similar pattern to the GO/GA test was produced by the RS regionalizations for RA test; however, there were two peaks in ANOSIM R values at thematic resolutions of 7 and 14. The RS regionalization at a thematic resolution of 17 produced the lowest percentage of significant regions (12%) of any regionalization tested.
When comparing the purely spatial schemes, the 100-km grid regionalization had the highest recorded R statistic of any regionalization for the GO test, with declining R statistic values for the GO test as thematic resolution became coarser (Fig. 4). When considering neighbours only (GA), the pattern was more variable with a slight increase in R statistic values as the thematic resolution coarsened. There was a marked increase in R statistic values for both the GO and GA tests at 500 km, which corresponded to a thematic resolution of 12 regions.
In contrast to the GO and GA tests, the RA tests for the spatial grid regionalizations showed an increase in performance with decreasing thematic resolution (Fig. 4). While the 100-km grid system produced the largest GO R statistic, 60% of the regions contained within it were found to be not statistically different from their neighbours. The percentage quickly increased as the number of regions contained within the spatial regionalizations decreased, with the 400–800 km regionalizations all exceeding 80% significant regions.
Regional coverage and beta diversity delineation
To test whether spatial coverage of a region had an effect on that region's ability to delineate beta diversity, the proportion of each region sampled by atlas cells was compared with RA R values, by region, for all environmental regionalization schemes, as well as the species-based regionalization scheme, using simple linear regression (Fig. 6). Two of the four regionalization schemes revealed positive relationships between sampling coverage and ANOSIM R values, which was strongest for the BEC regionalization.

Discussion
Our results indicate that avian communities are structured both environmentally and spatially, with all environmental and spatial regionalization schemes delineating significant patterns in beta diversity.
Evaluating environmental regionalizations against an ideal species-based scenario
The results of our ANOSIM analyses support the use of environmental regionalization schemes in conservation planning. The ecoregions performed almost identically to the species-based regionalization in the GO test; however, the species-based regionalization had an ANOSIM R value more than twice the ecoregions or BEC zones in the GA tests. The regionalization that performed most similarly to the species-based regionalization across all tests was the BCR system, showing a similar, moderate decline which was actually less than the species-based regionalization from GO to GA tests versus the more dramatic declines in the ecoregions and BEC zones. This is encouraging, considering the amount of avian conservation planning currently underway in North America which employs the BCR system. However, if the testing of these regions had been restricted to the GO test only, the BCR system would have been ranked lowest of all environmental regionalizations and lower than multiple grid regionalizations.
These results agree with the findings of Andrew et al. (2011) which demonstrated that the ecozones/ecoregions system was most effective at delineating butterfly beta diversity at the national scale and contrasts with McDonald et al. (2005) who found that ecoregions did not delineate beta diversity effectively. The ecoregions/BCR approach to regionalizations and their incorporation of multiple environmental variables supports several studies which suggest that environmental regionalizations based on multiple inputs best represents diversity as a whole (Bonn & Gaston, 2005; Sarkar et al., 2005).
While the use of species data to directly delineate a regionalization proved to be effective, this approach has many practical limitations. Species data at this scale are not available for all planning regions (Margules et al., 2002). Additionally, the approach outlined here is complex, and considering the similarity between the species-based regionalization and other environmental regionalizations, namely the BCR system, the additional effort may not be warranted. Lastly, the environmental regionalizations tested here, which consider a wide range of environmental variables, may represent other taxa more effectively and be more transferable to other locations owing to their generality.
Caution should be exercised when interpreting the ANOSIM results on a per-region basis, as proportional coverage was shown to be significantly related to regional ANOSIM R values for two of the four environmental regionalizations. It is possible that volunteers preferentially sampled more desirable birding areas that harbour more distinct species assemblages, in which case the observed patterns reflect true spatial variation. Or, if this relationship does represent a bias in the data, one option could be to adjust conservation targets based on deviations from expected ANOSIM RA values for a given level of regional sampling coverage.
Effect of spatial contiguity
The spatially contiguous environmental regionalizations (BCR, ecoregions and species-based) were shown to be more effective at delineating avian beta diversity, based on the GO and GA tests. Conversely, the BEC system, which does not require contiguity within each region, produced the lowest overall ANOSIM R values of the environmental regionalizations. However, all of the regions within the BEC system were found to be statistically distinct from their neighbours, indicating the importance of considering environmental factors alongside spatial contiguity in developing or selecting regionalization schemes. The findings of this study regarding environmental effects agree with the numerous studies which indicate that avian communities are structured to some degree by environmental factors which can be linked to plant communities, including: species richness and vegetation productivity (Bailey et al., 2004; Hawkins, 2004; Luck, 2007; Coops et al., 2009) and to plant structural complexity (Kissling et al., 2008).
While the spatial dependence of ecological communities is a well-described phenomenon, its role in planning conservation regionalization schemes has not been investigated in much depth (but see Andrew et al., 2011; Oliver et al., 2004). Ferrier et al. (2007), Oliver et al. (2004) and Andrew et al. (2012) all describe the decay of similarity between sites owing to spatial separation irrespective of ecological dissimilarity. Our results support these previous observations and, therefore, the importance of considering spatial structuring in regionalization schemes. The 100-km grid regionalization scheme was most able to delineate beta diversity of any scheme in the GO test, while all grid sizes delineated highly significant patterns of beta diversity for both the GO and GA tests. This clearly indicates that avian communities are structured spatially, and we therefore argue that regionalization schemes that do not explicitly incorporate space are lacking a potentially critical variable in their creation, likely decreasing their ability to represent distinct groups of species.
Thematic resolution
Generally, as thematic resolution becomes coarser, internal heterogeneity tends to increase (Wiens, 1989) while regional redundancy decreases (Andrew et al., 2011). This is strongly supported by the results of our testing of the spatial grid, and RS, regionalizations at varying thematic resolutions. The use of multiple ANOSIM tests demonstrates how increasing thematic resolution may result in better overall community delineation, but that this comes at the cost of increasing redundancy within the regionalization. The 100-km grid system produced the highest overall GO R statistic, and if the GO test had been the only test employed here, would have been judged most effective. However, only 40% of its regions delineated significant patterns in community structure when compared with their neighbours (i.e. 60% were redundant). Similarly, the ecoregions regionalization scored highest among the environmental regionalizations during the GO test, but contained over 20% more regions exhibiting redundancy when compared with the other environmental regionalizations.
Striking a balance between these two considerations presents a clear challenge. However, our results indicate that estimating an optimal thematic resolution is possible for a given study area. By testing thematic resolution in two ways: considering environment, but not space (the RS unique ecosystems at varying thematic resolutions); and considering space, but not environment (the grid system at varying thematic resolutions), we identified the thematic resolution at which ANOSIM R values were maximized for both the GO and GA tests. The ANOSIM R values for the grid system had a marked increase at 500 km, which corresponded to a thematic resolution of 12 regions, while the RS regionalizations were maximized between 10 and 14 regions. This result represents an attempt to strike a balance between overall performance and regional redundancy. Depending on the goals of a conservation plan, users might weight these factors differently in different situations. If efficiency is of paramount importance, then fewer regions might be better. If, however, users are prepared to accept certain levels of redundancy within their regionalization – which is often viewed as a positive (Groves et al., 2002) – then increasing the thematic resolution may be more appropriate. The effects of varying thematic resolutions (which inherently produce differences in mean samples sizes per region) on the ability of ANOSIM analyses to identify significant differences in community structure are not fully known however, and these results should be considered with this limitation in mind.
A notable finding of this study is the consistency in results obtained for the bird communities analysed here with those obtained for the butterfly communities tested by Andrew et al. (2011) in terms of the shape of the curves for the GO and GA grid tests. In both studies, a decreasing pattern in GO ANOSIM R values was observed, with a distinct increase at a particular grid size, corresponding to an increase in GA values as well (Fig. 4, and see fig. 4 in Andrew et al., 2011). This increase was at 400 km for butterflies, and 500 km for birds, and we suggest that this scale difference is due to the increased vagility of bird species compared to butterflies, which could explain why this pattern occurs at a larger scale for birds. Additionally, this difference between birds and butterflies highlights the specificity of thematic resolution with regard to taxa, and evaluations of thematic resolution should be conducted with this limitation in mind.
Conclusions
The four environmental regionalization schemes tested (BCRs, ecoregions, BEC zones and RS regions) delineated highly significant patterns in avian beta diversity, supporting their use in conservation planning. The species-based regionalization was shown to be slightly more effective in this circumstance. However, the similarities in performance between it and the Bird Conservation Regions suggest that the latter approach, or similar environmental surrogate schemes, can provide an effective solution in data-poor regions, particularly given the added complexity and specificity of the species-based approach. The spatially contiguous regionalizations outperformed the non-contiguous regionalizations in ANOSIM testing, indicating that space should probably be incorporated into a regionalization scheme explicitly by requiring regions to be spatially contiguous. This was confirmed by the relatively strong performance of the spatial grid system. Testing of various thematic resolutions, for both the spatial grid system and the RS regionalization, demonstrated the important trade-off that exists between increasing a regionalization's overall effectiveness at delineating distinct communities, but also increasing the likelihood of including redundant regions, as resolution is increased. Common spatial and environmental patterns were observed between avian and butterfly communities, reinforcing the findings of Andrew et al. (2011). The consistency of results between butterflies and birds is encouraging for conservation planning; however, caution should still be employed when applying these findings to other taxa.
Acknowledgements
This project was made possible thanks to the thousands of hours volunteers spent collecting breeding bird data throughout British Columbia. Jessica Fitterer generously provided the RS regionalizations, as well as advice on how best to use them. Funding for this project was provided by the Canadian Space Agency's ‘BioSpace: Biodiversity monitoring with Earth Observation Data’ project, as well as by the National Science and Engineering Council of Canada and the British Columbia Innovation Council.
References
Biosketch
The Integrated Remote Sensing Studio (IRSS) is located in the Faculty of Forestry at the University of British Columbia. IRSS investigates the application of remote sensing and spatial data for questions surrounding biodiversity, biogeography and conservation. Details of our work can be found at: http://irsslab.forestry.ubc.ca/.
Author contributions: G.J.M.R., N.C.C., M.E.A and N.M. conceived the project; G.J.M.R., M.E.A. and D.K.B. developed the modified ANOSIM models; all authors were involved in data analysis; G.J.M.R. led the writing.


