The prognostic value of [18F]FDG PET/CT texture analysis prior to transplantation for unresectable colorectal liver metastases
Abstract
Introduction
To determine whether heterogeneity in colorectal liver metastases (CRLM) 18F fluorodeoxyglucose [18F]FDG distribution is predictive of disease-free survival (DFS) and overall survival (OS) following liver transplantation (LT) for unresectable CRLM.
Methods
The preoperative [18F]FDG positron emission tomography/computed tomography examinations of all patients in the secondary cancer 1 and 2 studies were retrospectively assessed. Maximum standardized uptake value (SUVmax), metabolic tumour volume (MTV), and six texture heterogeneity parameters (joint entropyGLCM, dissimilarityGLCM, grey level varianceSZM, size zone varianceSZM, and zone percentageSZM, and morphological feature convex deficiency) were obtained. DFS and OS for patients over and under the median value for each of these parameters were compared by using the Kaplan Meier method and log rank test.
Results
Twenty-eight out of 40 patients who underwent LT for unresectable CRLM had liver metastases with uptake above liver background and were eligible for inclusion. Low MTV (p < 0.001) and dissimilarityGLCM (p = 0.016) were correlated to longer DFS. Low MTV (p < 0.001) and low values of the texture parameters dissimilarityGLCM (p = 0.038), joint entropyGLCM (p = 0.015) and zone percentageSZM (p = 0.037) were significantly correlated to longer OS. SUVmax was not correlated to DFS and OS.
Conclusion
Although some texture parameters were able to significantly predict DFS and OS, MTV seems to be superior to predict both DFS and OS following LT for unresectable CRLM.
1 INTRODUCTION
Colorectal cancer (CRC) is the third most common cancer worldwide and approximately half of the patients develop metastases, most often to the liver. Although about 20% of the patients with colorectal liver metastases (CRLM) are amenable to liver resection with curative intention, 5-year overall survival (OS) is most frequently reported to be 30%−50% (Kanas et al., 2012). Most patients with unresectable CRLM are treated by palliative chemotherapy with an expected 5-year OS of only about 10% (Dueland et al., 2015). In the prospective secondary cancer (SECA) 1 and 2 studies, patients with unresectable CRC liver-only metastases underwent liver transplantation (LT). Survival at 5 years was reported to be 60% in the SECA-1 and 83% in SECA-2 study (Dueland et al., 2020; Hagness et al., 2013). Based on these, LT is gaining acceptance as a treatment option for selected patients with unresectable CRLM. With limited number of liver grafts available worldwide it is essential to optimize patient selection for LT.
2-[18F]-fluoro-2-deoxy-d-glucose ([18F]FDG) positron emission tomography (PET) combined with computed tomography (CT) is widely used in oncology. For CRC patients, [18F]FDG PET/CT is most often used to detect occult metastases not identified by contrast enhanced CT before tentative metastasectomy (Briggs et al., 2011). [18F]FDG activity is quantified by measuring standardized uptake values (SUV) representing the tracer uptake within a lesion as estimate of glucose metabolism (Thie, 2004). Metabolic tumour volume (MTV) representing the volume of active tumour acquired by using a threshold relative to the background have shown to be predictive of survival in several cancers, including patients with CRLM (Kim et al., 2021).
Texture analysis is emerging as a method to assess subtle phenotypic heterogeneity within tumours in diagnostic images (CT, MRI, and PET) (Gillies et al., 2016). The texture of an image may be defined as patterns in the spatial variation in pixel or voxel intensity levels (Alobaidli et al., 2014). Malignant tumours are known to be heterogeneous at the molecular and cellular level, including cell proliferation and density, necrosis, fibrosis, metabolism, hypoxia, neo-angiogenesis and receptor/gene expression, which are factors that have been shown to be independently associated with more aggressive tumour behaviour and poor treatment response (Cook et al., 2014). [18F]FDG PET texture analysis has shown promise in predicting outcome and treatment response in gastrointestinal cancers like esophageal, gastric, pancreatic and CRC (Deleu et al., 2020).
The aim of the present study was to determine whether heterogeneity in CRLM [18F]FDG distribution is predictive of disease-free survival (DFS) and OS following LT for unresectable CRLM to potentially improve patient selection.
2 METHODS
2.1 Patient selection
We analysed data from 40 patients who underwent LT for unresectable CRLM in the SECA 1 and 2 studies from 2006 to 2018 at Oslo University Hospital, Norway. All patients underwent [18F]FDG PET/CT before LT after a pause of at least 4−6 weeks after the last chemotherapy as a part of the study protocol. Twelve patients who had liver metastases without FDG uptake above liver background were not amenable to texture analysis and were therefore excluded from the present study. Patients without evidence of extrahepatic malignant disease on [18F]FDG PET who also fulfilled all the other inclusion criteria as previously described underwent LT (Dueland et al., 2020; Hagness et al., 2013).
The SECA studies were approved by the Regional Ethics Committee and registered at clinicaltrials.gov with registration number NCT01311453 for the SECA-1 study and NCT01479608 for the SECA-2 study. All patients gave informed written consent.
2.2 [18F]FDG PET procedure
The PET/CT scans were acquired on hybrid PET/CT systems. Twenty-seven patients on Siemens Biograph 64 (n = 5) or 16 (n = 22) systems, Siemens Medical Systems, Erlangen, Germany, and 1 patient on a GE Discovery MI, General Electric (GE) Healthcare. All patients were instructed to fast for at least 6 h before [18F]FDG PET/CT. Glucose levels were measured immediately before [18F]FDG was injected intravenously. Median FDG activity given was 338 MBq (range 252−424). A standard whole body PET examination from skull base to the upper thigh with an acquisition time of 3 min per bed position and 30% overlap was performed about 60 min following injection. PET-images from the Biograph systems were reconstructed with the format recommended by the manufacturer for use in daily routine of 168 × 168 pixels (pixel size 4.06 mm) by using ordered subset expectation maximization (OSEM) with four iterations and eight subsets and a Gaussian postreconstruction filter that had fullwidths at halfmaximum to equal 5 mm. A low-dose CT without intravenous contrast was used for anatomical information and attenuation correction of the PET study. On the Discovery MI system the reconstruction was initially performed using OSEM 3i/16 s, 256 × 256 matrix, PSF correction and time of flight. This data set was additionaly filtered using a 5.4 mm 3d gaussian kernel to achieve an EARL v1 compliant image resolution, equivalent to those of the Biograph systems. The size of the kernel was determined using a NEMA IEC phantom scan according to EARL (European Association of Nuclear Medicine Research GmbH) specifications.
2.3 Image assessment
All [18F]FDG PET/CT scans were evaluated by two experienced senior physicians by consensus, both specialists in nuclear medicine and radiology (N. M. S. and H. G.). SUVmax and MTV of the liver metastases were obtained by using a Siemens syngo.via workstation (version VB40A). SUVmax was manually measured by placing a spherical volume of interest (VOI) over target lesions. The highest value of SUVmax and the most heterogeneous metastasis from the texture analysis for each of the texture parameters were registered. MTV (cm3) was defined as the tumour volume with [18F]FDG uptake segmented by fixed threshold methods at 40% of SUVmax in the VOI. Total MTV was calculated by summation of the values from all metastases for each patient. Liver background was measured by placing a region of interest of 3 cm in the right liver lobe. Liver metastases with SUVmax higher than the mean liver background uptake × 1.5 + standard deviation of the liver background × 2 were included (Wahl et al., 2009).
2.4 Texture analysis
Tumour volumes from the syngo.via segmentation used for MTV were exported as Digital Imaging and Communications in Medicine RTSTRUCTs to the software MATLAB® (The MathWorks Inc., version 2020a) where the texture analysis was performed. The images were interpolated to 4 × 4 × 4 mm voxels and discretized using a fixed bin width of 0.4 SUV. Heterogeneity was estimated using the following image biomarker standard initiative (IBSI) compliant parameters from the grey level co-occurance matrix (GLCM) and size zone matrix (SZM): joint entropyGLCM, dissimilarityGLCM, grey level varianceSZM, size zone varianceSZM, and zone percentageSZM (Zwanenburg, et al., 2020). The morphological texture parameter convex deficiency was also obtained. Texture analysis equations are given in Table S1.
2.5 Statistical analysis
All statistical analyses were performed with SPSS (IBM, version 26). DFS and OS for patients with values over and under the median value for each of the obtained SUVmax, MTV and texture parameters were compared by using the Kaplan−Meier method and log rank test. A two-sided p < 0.05 was considered as statistically significant. DFS was defined as time from LT to finding of new suspected metastatic lesions or local relapse shown by CT/MRI/[18F]FDG PET/CT, occurrence of new CRC primary, or diagnosis of other malignant disease. OS was calculated from date of LT to death or end of follow-up (8 March 2022).
3 RESULTS
3.1 Patient and baseline characteristics
Patient and baseline characteristics of the 28 included patients are given in Table 1. Median age at LT was 57 (range 44−64) and 17 were males and 11 females. Median time interval between the FDG PET/CT scan and LT was 77 days (range 17−293) days. A comparison of baseline characteristics and survival of the included compared to the excluded patients is shown in Table S2.
| Patients, n | 28 |
| Age at liver transplantation (LT), yearsa | 57 (44–64) |
| Time from 18F-FDG PET/CT to LT, daysa | 77 (17−293) |
| Gender, n (%) | |
| Male | 17 (60.7) |
| Female | 11 (39.3) |
| Primary tumour, n (%) | |
| Colon | 15 (53.6) |
| Rectum | 13 (46.4) |
| T Stage, n (%) | |
| 0 | 2 (7.1) |
| 2 | 2 (7.1) |
| 3 | 24 (85.7) |
| N Stage, n (%) | |
| 0 | 12 (42.9) |
| 1 | 10 (35.7) |
| 2 | 6 (21.4) |
| Progressive disease at LT, n (%)b | |
| Yes | 14 (50) |
| No | 14 (50) |
| Time of liver metastases, n (%) | |
| Syncronous | 24 (85.7) |
| Metacronous | 4 (14.3) |
| Number of metastases, na | 7.5 (1−53) |
| Size of metastasis (mm)a | 36,5 (7−130) |
| Lines of chemotherapy before LT, n (%) | |
| 1 | 10 (35.7) |
| 2 | 14 (50) |
| 3 | 4 (14.3) |
- Abbreviations: 18F-FDG, 2-[18F]-fluoro-2-deoxy-d-glucose; CT, computed tomography; PET, positron emission tomography.
- a Median (range);
- b Increased size of liver metastases and/or increased carcinoembryonic antigen (CEA).
3.2 Measurements
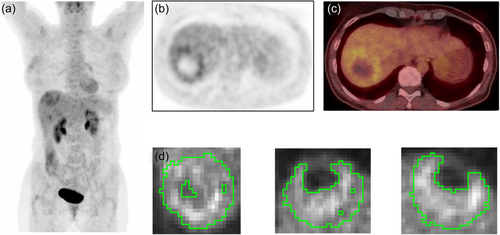
Median and range of SUVmax, MTV and the texture parameters joint entropyGLCM, dissimilarityGLCM, grey level varianceSZM, size zone varianceSZM, and zone percentageSZM, and morphological feature convex deficiency are given in Table 2. Median SUVmax was 9.1 and median total MTV was 66.1 cm3. Figure 1 shows an example of segmentation of the liver metastases of a SECA patient.
| Overall survival | ||||||
|---|---|---|---|---|---|---|
| Under median | Over median | |||||
| 5 years | 10 years | 5 years | 10 years | p Value | ||
| SUVmaxa | 9.11 (3.67−21.45) | 50% | 42% | 57% | 29% | 0.431 |
| MTV (cm3)a | 66.08 (4.93−874.12) | 85% | 67% | 21% | 7% | <0.001 |
| Convex deficiency | 0.45 (0.23−0.84) | 62% | 42% | 43% | 23% | 0.124 |
| Joint entropyGLCMa | 4.42 (2.85−12.08) | 32% | 0% | 71% | 54% | 0.038 |
| DissimilarityGLCMa | 0.76 (0.43−12.34) | 29% | 10% | 78% | 58% | 0.015 |
| Grey level varianceSZMa | 7.06 (1.88−1709.43) | 40% | 16% | 64% | 45% | 0.130 |
| Size zone varianceSZMa | 31 261 (7−2 073 905) | 61% | 51% | 43% | 12% | 0.058 |
| Zone percentageSZMa | 0.020 (0.005−0.548) | 36% | 14% | 69% | 50% | 0.037 |
- Note: Bold values indicate statistically significant.
- Abbreviations: GLCM, grey level co-occurance matrix; SZM, size zone matrix.
- a Median (range).

3.3 Survival analysis
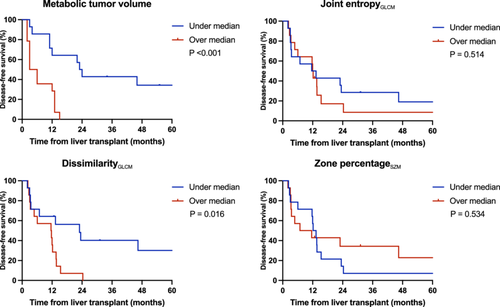
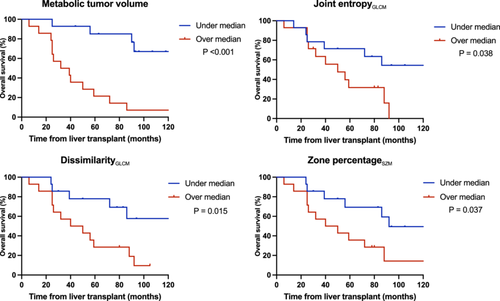
Patients with low total MTV had significantly longer DFS and OS (p = <0.001). The texture parameters dissimilarityGLCM, joint entropyGLCM and zone percentageSZM were significantly correlated to longer OS (p = 0.015, p = 0.038 and p = 0.037). DissimilarityGLCM was the only texture parameter significantly correlated to longer DFS (p = 0.015). OS at 5 and 10 years for patients with MTV under the median value were 85% and 67%. OS at 5 and 10 years for patients with dissimilarityGLCM over the median value were 78% and 58%. Table 2 summarizes survival at 5 and 10 years and Figures 2 and 3 show DFS and OS Kaplan Meier survival curves for MTV, dissimilarityGLCM, joint entropyGLCM and zone percentageSZM. The remaining aforenoted parameters are shown in Figures S1 and S2.


4 DISCUSSION
The main finding in the present study is that the preoperative [18F]FDG PET heterogeneity parameters dissimilarityGLCM, joint entropyGLCM and zone percentageSZM are significantly correlated to increased OS in patients who underwent LT for unresectable CRLM. However, MTV seems to be superior. Experience from the SECA study has shown that patients with pulmonary relapse have better survival than other sites of relapse (Dueland et al., 2021). Because the site of recurrence is a stronger predictor of OS than DFS (including all sites of relapse), the ability to predict OS is more important than DFS in this setting (Hagness et al., 2014).
LT for CRLM is emerging as a treatment option for selected patients with unresectable disease. Lack of liver donors is a general challenge worldwide and thus establishing systems to select patients with long survival following LT is of clinical interest. The prognostic properties of some of the texture parameters suggest that heterogeneous pattern of FDG uptake is unfavourable in these patients. Heterogeneous FDG uptake may reflect heterogeneous tumour biology including different tumour clones with various aggressiveness, grade of responsiveness to chemotherapy and metastatic potential, and hence various prognosis (Lovinfosse et al., 2018; Sagaert et al., 2018).
It is currently technically easier to calculate MTV than texture analysis since it is obtained on FDG avid volume based on a fixed threshold and can be obtained from most standard workstations. Texture analysis requires complex calculations that must be performed by dedicated software. Thus, MTV is more available for everyday clinical use and possibly easier to comprehend for clinicians. It should be noted that total MTV encompasses all liver metastases since it is based on the sum of individual lesion values. The other parameters, related to texture and SUVmax, are derived from the most heterogeneous lesion as there is currently no optimal approach to combine such values from multiple lesions. This may also contribute to explain why total MTV clearly outperformed other parameters in the present study. MTV represents the active liver tumour load before LT. It is plausible to assume that patients with high MTV following chemotherapy have more aggressive tumour biology than patients with low MTV and consequently have shorter survival. High MTV may also be due to poor chemotherapy response.
To our best knowledge, no article has previously reported the prognostic properties of [18F]FDG PET texture analysis in patients undergoing LT for unresectable CRLM. Some studies have reported on the prognostic properties of FDG PET texture analysis for CRC patients in setting of primary rectal cancer for clinical outcome (Hotta et al., 2021; Kang et al., 2021) whereas Nakajo et al. evaluated texture analysis for predicting tumour recurrence after surgery (Nakajo et al., 2017) and Rahmim et al. assessed the prognostic value of texture analysis in hepatic metastases from CRC (Rahmim et al., 2019; van Helden et al., 2018). The strong prognostic properties of MTV in the present study are in line with previous reports where patients with low MTV (<70 cm3) have shown to have longer OS compared to those with high MTV (>70 cm3) (Grut et al., 2017, 2022).
Studies on FDG-PET texture analysis in gastrointestinal tract malignancies show that the ability to predict outcome varies between studies for the same cancer types (Deleu et al., 2020). A possible explanation for this discrepancy might be lack of standardisation in defining the textural parameters, retrospective studies and small sample size (Chalkidou et al., 2015). Also, several factors may affect quality and performance of PET imaging such as patient positioning, organ motion, image acquisition parameters and reconstruction algorithms. To ensure reproducibility, it is crucial to use standardized definitions and methodology used in calculations like those made by the IBSI (Zwanenburg, et al., 2020). Although there are some recommendations on how to perform texture analysis there is no general consensus (Scalco & Rizzo, 2017). In the present study IBSI compliant textural parameters were used, since these were commonly applied in previous studies and are reported to be robust (Cook et al., 2014; Galavis et al., 2010).
There are some limitations in our study. The study is limited by its small sample size (n = 28) and therefore likely to be underpowered. Nevertheless, the SECA patient cohort is the only example of its kind with a long observation period. Despite a limited number of patients we have shown significant results regarding the texture parameters DissimilarityGLCM, Joint entropyGLCM and Zone percentageSZM in addition to MTV. Another limitation is the retrospective study design. Prospective studies are required to confirm the real value of texture analysis. There was a variation in time between pretransplant [18F]FDG PET/CT and LT, and consequently, for the cases with a long time interval between imaging and transplantation, disease progression affecting the survival-results may have occurred. A limitation is that texture analysis cannot be performed in patients with complete metabolic response because the metastases are FDG-negative (MTV = 0). All patients underwent chemotherapy preceding the preoperative [18F]FDG PET/CT, though not in the last 4–6 weeks before imaging, which may have affected the FDG-uptake in the metastases. However, chemotherapy before LT is a mandatory part of the SECA protocol.
Despite these limitations, the textural parameters dissimilarityGLCM, joint entropyGLCM and zone percentageSZM, in addition to MTV, measured from a standard [18F]FDG PET protocol showed prognostic value emphasizing the importance of [18F]FDG PET as a possible clinical selection tool to predict the therapeutic response of CRLM. MTV seems to be the most important factor in predicting outcome, though MTV is an indicator of the overall glucose metabolism rather than the subtle heterogeneities throughout the tumour. Large prospective studies with harmonized image acquisition, processing and texture analysis protocols are needed.
5 CONCLUSION
Although some texture parameters were able to significantly predict DFS and OS, MTV seems to superior to predict both DFS and OS following LT for unresectable CRLM.
ACKNOWLEDGEMENTS
Supported by Vestre Viken Hospital Trust and Oslo University Hospital.
CONFLICT OF INTEREST STATEMENT
The authors declare no conflict of interest.
Open Research
DATA AVAILABILITY STATEMENT
The data that support the findings of this study are available from the corresponding author upon reasonable request.


