The ratio FEV1/FVC and its association to respiratory symptoms—A Swedish general population study
Abstract
Chronic airflow limitation (CAL) can be defined as fixed ratio of forced expiratory volume in 1 s (FEV1)/forced vital capacity (FVC) < 0.70 after bronchodilation. It is unclear which is the most optimal ratio in relation to respiratory morbidity. The aim was to investigate to what extent different ratios of FEV1/FVC were associated with any respiratory symptom. In a cross-sectional general population study, 15,128 adults (50–64 years of age), 7,120 never-smokers and 8,008 ever-smokers completed a respiratory questionnaire and performed FEV1 and FVC after bronchodilation. We calculated different ratios of FEV1/FVC from 0.40 to 1.0 using 0.70 as reference category. We analysed odds ratios (OR) between different ratios and any respiratory symptom using adjusted multivariable logistic regression. Among all subjects, regardless of smoking habits, the lowest odds for any respiratory symptom was at FEV1/FVC = 0.82, OR 0.48 (95% CI 0.41–0.56). Among never-smokers, the lowest odds for any respiratory symptom was at FEV1/FVC = 0.81, OR 0.53 (95% CI 0.41–0.70). Among ever-smokers, the odds for any respiratory symptom was lowest at FEV1/FVC = 0.81, OR 0.43 (95% CI 0.16–1.19), although the rate of inclining in odds was small in the upper part, that is FEV1/FVC = 0.85 showed similar odds, OR 0.45 (95% CI 0.38–0.55). We concluded that the odds for any respiratory symptoms continuously decreased with higher FEV1/FVC ratios and reached a minimum around 0.80–0.85, with similar results among never-smokers. These results indicate that the optimal threshold associated with respiratory symptoms may be higher than 0.70 and this should be further investigated in prospective longitudinal studies.
1 INTRODUCTION
Chronic airflow limitation (CAL) can be assessed by using a fixed ratio of forced expiratory volume in 1 s (FEV1)/forced vital capacity (FVC) < 0.70 (Singh et al., 2019; Vogelmeier et al., 2017). An alternative approach is to define CAL as FEV1/FVC less than the 5th percentile, the “lower limit of normal (LLN5)” (Quanjer et al., 2012).
The Global Initiative for Obstructive Lung Diseases (GOLD) recommends using the fixed ratio of FEV1/FVC < 0.70 (Vogelmeier et al., 2017). The cut-off chosen, 0.70, is based on the underlying assumption that this limit is a clinically useful marker of increased morbidity and mortality. In early literature, the cut-off limits for CAL have varied between 0.60 and 0.75, and it has often been emphasized that the fixed threshold of 0.70 is based on expert opinion (Burrows et al., 1987; Ferris et al., 1973; Korn et al., 1987). There is a lack of population-based evidence to support that the exact threshold < 0.70 for the FEV1/FVC ratio is the most discriminative limit for prediction of morbidity and mortality. In one of the few studies investigating this issue, Bhatt el al. found in pooled general population studies from the United States that the incidence for COPD-related hospitalizations and mortality increased continuously from FEV1/FVC = 0.80 to FEV1/FVC < 0.40, without evidence of an inflection point (Bhatt et al., 2019). Employing advanced statistical models, however, the authors showed that the optimal FEV1/FVC threshold to discriminate the risk of COPD-related events was 0.70. Among never-smokers, the results indicated a higher threshold, 0.74, but the results were based on prebronchodilator values. This is a weakness as the GOLD recommendations are based on postbronchodilator values.
We have in a recent study plotted different percentiles of FEV1/FVC based on calculated z-scores (Quanjer et al., 2012; Torén, Schiöler, Brisman, et al., 2020; Torén, Schiöler, Lindberg, et al., 2020). We found that the odds for any respiratory symptom was increased also in percentiles above the 5th percentile, and the results from that study indicated that a higher cut-off for CAL than the 5th percentile should be considered (Torén et al., 2020a; Torén, Schiöler, Lindberg, et al., 2020). There is a lack of similar analysis of different postbronchodilator FEV1/FVC ratios in relation to respiratory symptoms. This is of considerable importance as the fixed ratio, 0.70, is recommended in international guidelines (Vogelmeier et al., 2017).
Hence, the aim of the present population-based study was to analyse the relation between successively higher (more inclusive) postbronchodilator FEV1/FVC ratios in relation to clinically relevant respiratory symptoms, such as cough with phlegm, dyspnoea and wheeze.
2 METHODS
2.1 Study population
The study participants were randomly selected from the Swedish general population, and the study design of the Swedish CArdioPulmonary bioImage Study (SCAPIS) had previously been described (Bergström et al., 2015; Torén et al., 2016). The population used in this analysis comprised 15,810 adults, aged 50–64 years, 7,122 of whom were never-smokers, 7,625 men and 8,185 women. All subjects answered an extensive respiratory questionnaire comprising the modified Medical Research Council (mMRC) scale which includes five grades (0–4) for assessing dyspnoea, along with items about smoking habits.
2.2 Spirometry
Dynamic spirometry including FEV1 and FVC was performed at least 15 min after inhalation of 400 µg of salbutamol with the subject in a sitting position using a nose clip. In all measurements, a Jaeger Master Screen PFT (Vyaire, Mettawa, IL, USA) was used. All procedures were performed according to ATS/ERS standards (Miller et al., 2005). Using the Global Lung Function Initiative equations, predicted values were calculated based on age, gender and height (Quanjer et al., 2012).
2.3 Outcomes
Cough with phlegm was defined as cough with phlegm lasting for at least 3 consecutive months during at least two years.
Dyspnoea was self-reported using the mMRC scale, and for this study dyspnoea was defined as mMRC > 1 (Bestall et al., 1999; Ekström et al., 2019).
Wheezing was defined as an affirmative answer to “Do you have wheezing or whistling in your chest.”
The primary outcome was a composite outcome any respiratory symptom defined as having one or more of the symptoms of cough with phlegm, dyspnoea and wheezing. These different respiratory symptoms were also analysed separately, as secondary outcomes.
2.4 Covariates
Age and gender were self-reported, and height and weight were measured at enrolment.
Asthma was defined as “physician-diagnosed asthma” (Torén et al., 1993).
Restrictive spirometric pattern (RSP) was defined as FEV1/FVC ≥ 0.7 and FVC < 80 per cent predicted based on the GLI equations (Malinovschi et al., 2020; Torén, Schiöler, Brisman, et al., 2020; Torén, Schiöler, Lindberg, et al., 2020).
Smoking history was retrieved from the questionnaires and categorized as current smokers, former smokers and never-smokers. Former smokers were defined as those who had smoked for at least 1 year but not during the last year. Ever-smokers included both current and former smokers. Pack-years were calculated for all participants with a history of smoking. Never-smokers were defined as those who gave an affirmative answer to the item “No, I have never smoked.” Body mass index (BMI) was calculated as a ratio: weight/height2.
2.5 Statistics
We categorized FEV1/FVC ratios and further analysed the association between the different FEV1/FVC ratios and presence of any respiratory symptom, as well as cough with phlegm, dyspnoea and wheeze by using multivariable logistic regression models. All models included age, sex, smoking, pack-years, BMI and asthma. We used cubic restricted splines with four knots placed at the 5th, 35th, 65th and 95th percentiles for BMI and pack-years among ever-smokers, respectively (Harrell, 2015). In an extended analysis, we treated the FEV1/FVC ratios as a continuous variable using a spline with five knots placed at FEV1/FVC = 0.50, 0.60, 0.675, 0.725, 0.80 and 0.90. We analysed the entire population, and performed additional separate analyses for never-smokers and ever-smokers. We also performed a sensitivity analysis excluding all individuals with RSP.
All analyses were performed using SAS version 9.4 M5 (SAS Institute Inc, Cary, NC, USA). All results from the logistic regression models are expressed as ORs with 95% confidence intervals (CI).
3 RESULTS
3.1 Study population
After exclusion of 682 persons due to incomplete data, the final study population comprised 15,128 individuals (Table 1). The mean age of the participants was 57.5 years, 52.0% were women and 47.1% were never-smokers. The prevalence of FEV1/FVC < 0.70 in the entire population was 9.7%, among ever-smokers 13.1% and among never-smokers 5.8%.
|
All N = 15,128 |
Ever-smokers N = 8,008 |
Never-smokers N = 7,120 |
|
|---|---|---|---|
| Age (years), mean (SD) | 57.5 (4.3) | 58.0 (4.3) | 57.0 (4.3) |
| Males | N = 7,268 (48.0%) | N = 3,681 (46.0%) | N = 3,587 (50.4%) |
| BMI (kg/m2), mean (SD) | 26.9 (4.4) | 27.2 (4.5) | 26.6 (4.4) |
| Current smokers | N = 2,239 (14.8%) | N = 2,239 (28.0%) | NA |
| Pack-years, mean (SD) | 16.8 (14.0) | 16.8 (14.0) | NA |
| Cough with phlegm | N = 734 (4.9%) | N = 490 (6.2%) | N = 244 (3.4%) |
| Dyspnoea | N = 738 (5.0%) | N = 482 (6.2%) | N = 256 (3.6%) |
| Wheezing | N = 1,126 (7.6%) | N = 808 (10.4%) | N = 318 (4.5%) |
| Any respiratory symptom | N = 1960 (13.3%) | N = 1,301 (16.8%) | N = 659 (9.5%) |
| Asthma | N = 659 (4.4%) | N = 336 (4.2%) | N = 323 (4.5%) |
|
FEV1 (% pred)a mean (SD) |
101.5 (14.2) | 100.2 (15.0) | 103.0 (13.1) |
|
FVC (% pred)a mean (SD) |
102.1 (13.1) | 102.1 (13.3) | 102.2 (12.8) |
|
FEV1/FVCa mean (SD) |
0.78 (0.065) | 0.77 (0.071) | 0.79 (0.056) |
| FEV1/FVC < 0.70a | N = 1,461 (9.7%) | N = 1,046 (13.1%) | N = 415 (5.8%) |
| Restrictive spirometric pattern (RSP)a | N = 338 (2.2%) | N = 174 (2.2%) | N = 164 (2.3%) |
- Abbreviations: NA, not applicable; SD, standard deviation.
- a Postbronchodilator values.
3.2 Any respiratory symptom
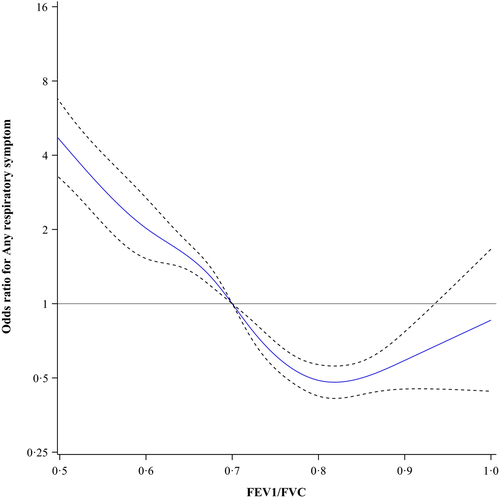
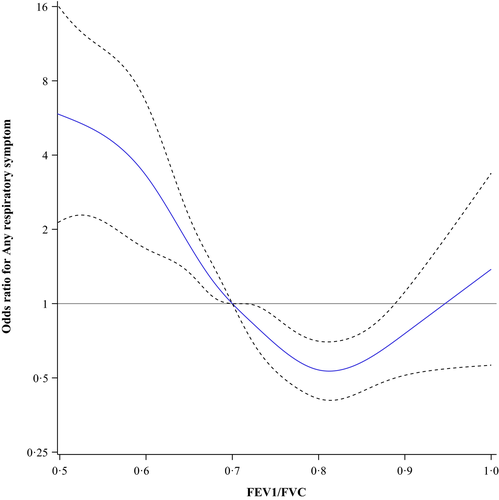
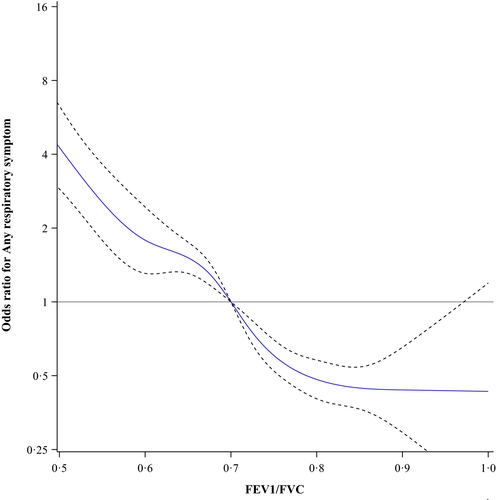
The prevalence of any respiratory symptom in the entire population was 13.3%, among ever-smokers 16.8% and among never-smokers 9.5%. Figure 1 shows the odds ratios for any respiratory symptom among all subjects plotted as a continuous function of different ratios of FEV1/FVC using 0.70 as the reference point. The lowest odds were at FEV1/FVC = 0.82, OR 0.48 (95% CI 0.41–0.56). In Figure 2, the results for the never-smokers are plotted showing similar results, that is the lowest odds were at FEV1/FVC = 0.81, OR 0.53 (95% CI 0.41–0.70). Among ever-smokers (Figure 3), the pattern was slightly different. The odds for any respiratory symptom showed the lowest odds at FEV1/FVC = 0.81, OR 0.43 (95% CI 0.16–1.19). In contrast, no clear inflection point was observed and there was no further decline in odds, that is FEV1/FVC = 0.85 showed similar odds, OR 0.45 (95% CI 0.38–0.55).
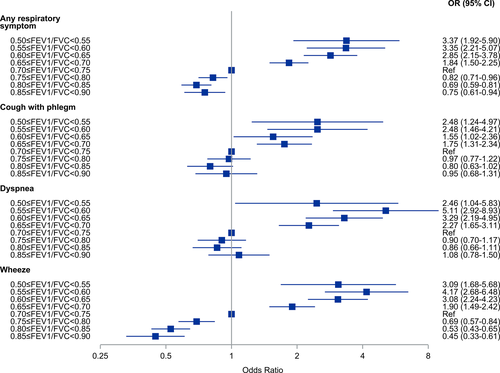
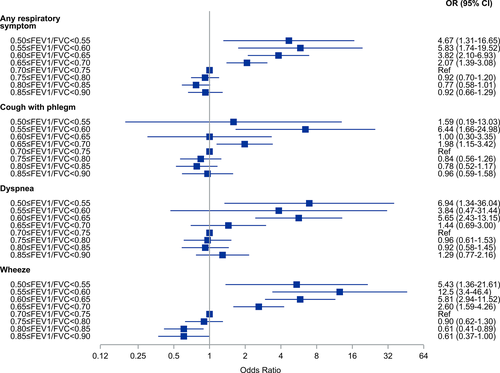
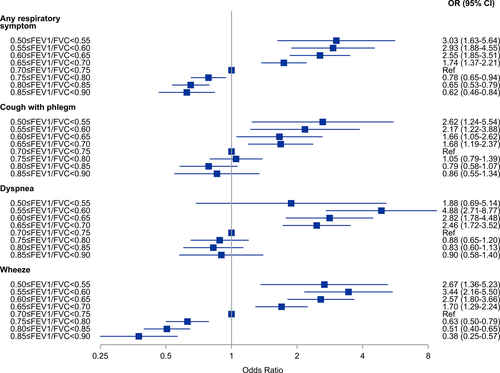
We also analysed the odds ratios for any respiratory symptom using five percentage intervals of FEV1/FVC from 0.50–0.54 to 0.85–0.90. In these analyses, we used FEV1/FVC = 0.70–0.75 as the reference category. The results are presented as forest plots (Figures 4-6). Among all subjects, the odds for any respiratory symptom decreased with higher intervals of FEV1/FVC, and there was a minimum at the interval FEV1/FVC = 0.80–0.85 (OR 0.69, 95% CI 0.59–0.81) (Figure 4). Also, for the intervals FEV1/FVC = 0.75–0.80, 0.80–0.85 and 0.85–0.90, the odds were clearly below 1.0. Among never-smokers, the odds for any respiratory symptom decreased with increasing intervals of FEV1/FVC, and there was also a minimum at the interval FEV1/FVC = 0.80–0.85 (OR 0.77, 95% CI 0.58–1.01) (Figure 5). However, for the intervals FEV1/FVC = 0.75–0.80 and 0.85–0.90 the odds were not clearly below 1.0. Among ever-smokers (Figure 6), the pattern was different with the odds for any respiratory symptom continuously decreasing from FEV1/FVC = 0.50–0.55 to 0.85–0.90.
3.3 Cough with phlegm, dyspnoea and wheezing
Cough with phlegm showed similar pattern in all groups (all subjects, never-smokers and ever-smokers) of decreasing odds ratios with increasing FEV1/FVC and a minimum at the interval FEV1/FVC = 0.80–0.85 (Figures 4-6). In the intervals FEV1/FVC = 0.75–0.80, 0.80–0.85 and 0.85–0.90, the confidence intervals included unity.
Among all subjects and never-smokers, the odds for dyspnoea were continuously decreasing from FEV1/FVC = 0.50–0.54, but with a plateau around OR = 1.0 from FEV1/FVC = 0.70–0.75 to FEV1/FVC = 0.85–0.90, that is there was no obvious minimum interval. This was especially seen among never-smokers. Among ever-smokers, the pattern was less obvious.
For wheezing, there was a different pattern with continuously decreasing odds from FEV1/FVC = 0.55–0.60 to FEV1/FVC = 0.85–0.90, with the confidence intervals separated from 1.0. This was observed among all subjects, never-smokers and ever-smokers.
3.4 Sensitivity analyses
A sensitivity analysis was performed excluding all 338 individuals with RSP. The results were very similar for any respiratory symptom and the separate symptoms of cough with phlegm, dyspnoea and wheeze, respectively (data not presented).
4 DISCUSSION
In this study based on a large Swedish general population sample, we observe that the odds for any respiratory symptoms continuously decreased with increasing fixed cut-offs for FEV1/FVC ratios and reached the minimum and flattened out around FEV1/FVC = 0.80. This is observed particularly among never-smokers, but less obvious among ever-smokers. The present results indicate that the optimal threshold for defining CAL has to be further evaluated.
There is an ongoing debate whether CAL should be based on a fixed threshold or using the LLN approach. The latter is derived from reference equations developed from different normal populations, and the selected limit should be a marker of significant deviation from normality. This is an approach well in line with statistical theory (Stanojevic et al., 2008). An alternative approach, the fixed ratio to diagnose CAL has been defined as FEV1/FVC < 0.70 after bronchodilation. This threshold is based on the GOLD strategy document and has been advocated in previous and in more recent papers (Vogelmeier et al., 2017). The fixed ratio approach assumes that a certain airflow limitation is normal, regardless of body size, age or gender and it is in analogy with current guidelines regarding the definition of hypertension (Cohen & Townsend, 2018). One of the main arguments against the fixed ratio approach is the considerable overdiagnosis of CAL in older adults when compared to the LLN approach (Fragoso et al., 2016). However, in these studies LLN has been used as the gold standard, and in longitudinal studies it has been observed that these deviating (over-diagnosed) individuals both have an increased prevalence of structural changes on computed tomography of the lungs and increased respiratory morbidity and mortality (Bhatt et al., 2014; Mohamed Hoesein et al., 2013; Wollmer & Engström, 2013). This group with FEV1/FVC < 0.70 and ≥ LLN seems to have the same severity of dyspnoea and similar reduction in DLCO as persons that are concordant with regard to FEV1/FVC < 0.70 and < LLN (Calverley, 2020; Neder et al., 2020). We have also shown that there was no difference in cause-specific mortality when CAL was defined either as the fixed ratio or according to the LLN approach (Torén et al., 2018). We also confirmed previous observations of an increased all-cause mortality among men with airflow limitation by fixed ratio, but not having airflow limitation by LLN (Torén et al., 2018).
In the present study, we observed that increasing FEV1/FVC was associated with decreasing odds for respiratory symptoms, and the nadir seems to be higher than FEV1/FVC = 0.70. That is close to the discussion about GOLD stage 0. The individuals with FEV1/FVC ≥ 0.70 and with symptoms of cough with phlegm and dyspnoea were previously labelled as GOLD Stage 0, and they were regarded as a high-risk group among smokers to develop COPD (Fragoso et al., 2016). In recent GOLD documents, however, stage 0 is not included since there was insufficient evidence that this group had an increased risk to progress to COPD (Vogelmeier et al., 2017). However, there are several studies indicating that smokers with FEV1/FVC ≥ 0.70 and respiratory symptoms may have evidence of airway disease, and it has been proposed that these individuals may have “early” COPD, yet without CAL (Lowe et al., 2019; Regan et al., 2015; Woodruff et al., 2016). Results from the Copenhagen General Population Study indicated that never-smokers with COPD have an increased risk of hospitalizations due to pneumonia and COPD exacerbations, and also that presence of respiratory symptoms among individuals with normal lung function, defined as FEV1/FVC ≥ 0.70, predicted COPD exacerbations and pneumonia hospitalizations (Thomsen et al., 2013; Ҁolak et al., 2019).
We add further evidence to the discussion, as mentioned above, we observed that increasing FEV1/FVC was associated with decreasing odds for respiratory symptoms, and the nadir seems to be higher than FEV1/FVC = 0.70. Although our data are cross-sectional, we believe that the criterion for CAL has to be further investigated. A strength of the present study is that we have a large proportion of never-smokers, and among those the inflection point of the FEV1/FVC ratio seems to be higher than 0.70. The pooled study by Bhatt et al is supportive, as they found that 0.74 was the optimal ratio to discriminate the risk of COPD-related events in never-smokers (Bhatt et al., 2019). In a similar study, we found that the odds for any respiratory symptom was increased also in percentiles above the 5th percentile, when plotting the percentiles of FEV1/FVC based on calculated z-scores (Torén, Schiöler, Brisman, et al., 2020; Torén, Schiöler, Lindberg, et al., 2020).
Increasing the threshold for the fixed ratio will increase the sensitivity, resulting in more individuals being diagnosed with CAL. Whether this reflects a true misclassification or will increase the validity, that is detecting otherwise undetected cases, can be elucidated in longitudinal studies. The method of choice is to validate different fixed ratios in relation to morbidity and mortality. Hence, we just present our observation that the ratio with lowest odds for key respiratory symptoms is shown to be higher than 0.70. It is important to stress that currently our results do not at present justify a modification of the established ratio limit.
We also analysed key respiratory symptoms; cough with phlegm, dyspnoea and wheeze, and found similar results; cough with phlegm showed the same pattern in all groups with decreasing odds ratios with increasing FEV1/FVC ratios and a minimum at the interval FEV1/FVC = 0.80–0.85. Also, the odds for dyspnoea were continuously decreasing from FEV1/FVC = 0.50–0.54, but with a plateau around OR = 1.0 from FEV1/FVC = 0.70–0.75 to FEV1/FVC = 0.85–0.90, that is there was no obvious minimum interval. When it comes to wheezing, there was different pattern with continuously decreasing odds and a plateau rather at 0.80 to 0.90.
There are a number of weaknesses of the present study that we are fully aware of. It is a cross-sectional study which limits the validity of the conclusions, and it was performed within a limited age range, namely 50–64 years. That will restrict the external validity to that age interval. Selection bias may also be a problem, as the participation rate was around 50%, and having COPD and cardiovascular disease seems to have increased the participation rate (Björk et al., 2017). The prevalence of never-smokers, 43%, is also slightly lower in our sample compared to other similar general population studies, suggesting some selection bias in relation to smoking habits (Olin et al., 2006). However, our results are also seen among never-smokers, a group with lesser risk for COPD and cardiovascular diseases. Hence, we conclude that despite the possible selection bias in our study, we think that the threshold values obtained among never-smokers are likely to have been marginally affected only.
In conclusion, we observe that the odds for any respiratory symptoms continuously decreased with increasing FEV1/FVC and reached the minimum and flattened out around FEV1/FVC = 0.80, with similar results among never-smokers and ever-smokers. These results indicate that in the definition of CAL the FEV1/FVC ratios may be higher than 0.70, and this should be further investigated in prospective longitudinal general population studies.
ACKNOWLEDGEMENTS
The main funding body of The Swedish CArdioPulmonary bioImage Study (SCAPIS) is the Swedish Heart and Lung Foundation. The study is also funded by the Knut and Alice Wallenberg Foundation, the Swedish Research Council and VINNOVA (Sweden's Innovation agency) the University of Gothenburg and Sahlgrenska University Hospital, Karolinska Institutet and Karolinska University Hospital, Linköping University and University Hospital, Lund University and Skåne University Hospital, Umeå University and University Hospital, Uppsala University and University Hospital. There was also individual research support from the Swedish state under the agreement between Swedish government and the county councils, the ALF-agreement.
CONFLICTS OF INTEREST
A.L. reports consultancies from AstraZeneca, Boehringer-Ingelheim, Chiesi and Novartis, outside the submitted work. J.V. reports consultancies from Boehringer-Ingelheim outside the submitted work. P.W. reports consultancies from AstraZeneca, Chiesi Pharmaceuticals outside the submitted work. C.M.S. reports consultancies from Boehringer-Ingelheim, GlaxoSmithKline, Novartis, AstraZeneca, Roche and Genzyme outside the submitted work. P.W. has a patent Device and method for pulmonary capacity measurements issued. All other authors declare no conflicts of interest.
AUTHOR CONTRIBUTIONS
Members of SCAPIS National Steering committee and therefore responsible for design, funding, planning and execution of the SCAPIS study: A.B., G.B., J.E.E., C.M.S, K.T., C.J.Ö. and E.L. Responsible for the conception and design of the analyses included in the specific manuscript and first draft: K.T., L.S. and A.M. Data collection: A.A., A.F.B., K.C., M.J.E., V.H., C.J.Ö, Å.J., D.K., A.L., H.L.P., C.M.S., J.E.S., H.T., J.V. and P.W. Statistical analysis: L.S. All authors were involved in the planning and data interpretation and revision of manuscript drafts for important intellectual content, and approval of the version to be submitted.
ETHICAL APPROVAL
The study was approved by the Regional Ethical Review Board at Umeå University (Nr: 2010- 228-31 M), and all participants provided written informed consent.


