Should more teams “trust the process” of tanking?
Abstract
In many professional sport leagues, the worst-performing teams receive higher probability of earning top draft picks. This provides teams incentives to purposefully lose, or “tank,” if they are not likely to contend for the playoffs or championships. We evaluate the effectiveness of tanking to improve team outcomes by examining the most explicit tanking case in the NBA: the “Trust the Process” Philadelphia 76ers. Using synthetic control, we demonstrate that tanking caused the 76ers to be more successful in terms of winning and operating income. However, only operating income had a plausibly positive present value when calculating discounted present values.
Abbreviations
-
- NBA
-
- National Basketball Association
-
- NPV
-
- Net Present Value
-
- SCM
-
- Synthetic Control Method
They tell us every game, every day, ‘Trust the Process.’ Just continue to build.
Tony Wroten (Philadelphia 76ers Point Guard)
1 INTRODUCTION
Profit-maximizing firms must constantly innovate their business strategies to gain advantages over their competition. Often, these innovations take the form of sacrificing short-term profits for increased future profits. These managerial decisions are common across many industries. Grocery stores, for example, often have certain products dubbed “loss leaders,” which are meant to lure customers into their stores. Another notable example is Netflix's recent crackdown on password/account sharing. Netflix exhibited leniency until they reached a critical mass of users on their network. Once this number was reached, Netflix began strictly enforcing the rules, generating a record number of additional accounts (Brady, 2023). Of course, sacrificing short-run profits for potentially higher long-run gains is risky due to the uncertainty of the future.
This strategy is also employed in the sports industry. In the National Basketball Association (hereon, the NBA), like many professional sports leagues in the United States, a draft allocates incoming amateur talent to teams. The worst teams have the best odds (in the NBA, via lottery) of getting the earliest picks in the interest of competitive balance. This system creates an incentive for poorly performing teams to perform even worse, a behavior called “tanking.” Soebbing and Humphreys (2013) formally define tanking as “NBA teams intentionally lose games at the end of the season in order to obtain a higher pick in the subsequent NBA entry draft.” Nonetheless, draft lotteries are not the only settings that enable such behavior. Balsdon et al. (2007) shows that NCAA basketball teams also tanked to influence potential matchups in the “March Madness” post-season tournament.
The research examining tanking looks at the likelihood of tanking (Price et al., 2010; Taylor & Trogdon, 2002), mechanisms around tanking (Gong et al., 2021; Schmidt, 2021), and the consequences (Ehrlich et al., 2023; Gong et al., 2021). The present study explores one specific case, the Philadelphia 76ers of the mid-2010s. The Philadelphia 76ers used the strategy of tanking in the mid-2010s, thus sacrificing short-term success for future wins. We use the 76ers as a case study to investigate the implications of tanking. Namely, we explore whether tanking, as a business strategy, benefited the 76ers organization.
What sets the Philadelphia 76ers case apart from other cases in the past is that the 76ers represents the most explicit and notorious instance of tanking in any professional sports league to date. Sam Hinkie, hired by the 76ers after the 2012-13 NBA season, exploited the NBA's draft system to maximize the number of top picks for his team. In orchestrating the most infamous instance of tanking in professional sports history, Hinkie led the 76ers to three of the five worst records in team history, including a year with a record of 10 wins and 72 losses in the 2015–2016 season.
It is well-known that the 76ers became a perennial title contender due to its tanking, but the financial implications remain undocumented. We contribute to the literature by exploring whether it was profitable for Philadelphia to intentionally forgo short-term wins, hoping to experience greater success in the long run. We evaluate the effectiveness of tanking through the lens of both on-court and off-court performance using a Synthetic Control analysis. The advantage of this methodology is the creation of a “counterfactual” 76ers organization, constructed via a weighted average of other similar organizations, that does not in fact tank. Our empirical analysis shows that such a strategy was more profitable than the status quo in both the short and long run, even during the seasons in which team performance dropped.
In recent years, the league tried to address tanking by changing the incentives of teams. In 2019, the NBA smoothed the odds of getting a top pick in the lottery, reducing the expected value of tanking (Schmidt, 2024). For example, the odds of the worst team getting the top pick were dashed from 25% to 14%, the number of team selected in the lottery increased from three to four, and the NBA also levied fines for resting uninjured players, which is a key mechanism for tanking.1 These new policy changes require teams to be more patient in acquiring such players. Still, they do not necessarily address a team's ability to stay profitable during a period of sustained tanking due to the revenue sharing structure of the league. We conclude our case study by discussing league and draft structures currently in other sports that are better suited to eliminating the incentive to tank.
This case study of the tanking era of the Philadelphia 76ers is structured as follows. Section 2 examines some of the relevant literature and where this research fits into the conversation. Section 3 presents the data and empirical approach used to investigate the 76ers' decision to tank. Sections 4 and 5 display and discuss the findings, while Section 6 concludes.
2 TANKING IN THE SPORTS INDUSTRY
Sports leagues are interested in maintaining a high level of competitive balance to sustain the demand for their product. The “uncertainty of outcome hypothesis” (Budzinski & Pawlowski, 2017) emphasizes that an unbalanced competitive environment can lead fans of perennially losing teams to lose interest in their teams, if not the league. Hence, sports leagues that produce uncertain outcomes are likely to experience higher demand for attending and watching games and team merchandise. To address potential issues of imbalanced competitiveness among teams, closed sports leagues have introduced drafts to give losing teams a greater opportunity to acquire young, talented players, which should help maintain competitive balance among teams in the league.2 However, depending on the potential value of top draft picks, teams may engage in tanking to increase the probability of acquiring young players who have the potential to become superstars. Specifically in the NBA, superstars have been shown to increase downstream profits, secondary ticket prices, and attendance (Humphreys & Johnson, 2020; Kaplan, 2022; Ehrlich et al., 2023, respectively).
Discussions of tanking in the NBA can be traced to the 1980s. NBA fans often suggest that some of the earliest tanking occurred the prior to the 1984 NBA Draft, when the reward for receiving the first overall pick was Akeem Olajuwon from the University of Houston (Soebbing & Mason, 2009; Taylor & Trogdon, 2002). Olajuwon, who later changed his name to Hakeem, was drafted first overall by the Houston Rockets and became one of the best NBA players of all time. This draft also included future Hall of Fame athletes Michael Jordan, Charles Barkley, and John Stockton.
Furthermore, several academic studies empirically uncover the presence of tanking in the league. Exploring changes in draft lottery ordering policies over time and, thus, variation in the expected return of tanking, Taylor and Trogdon (2002) and Price et al. (2010) find evidence of this strategy in the NBA. The authors discover that once a team's probability of reaching the post-season goes to zero, their likelihood of winning upcoming games that season significantly decreases, implying lower winning effort. Focusing on effort, Gong et al. (2022) uncover that teams eliminated from players rest more players than their peers, ceteris paribus. Furthermore, the rise of technology and basketball analytics could have further encouraged tanking as teams become more efficient in minimizing performance risk when assembling rosters (Schmidt, 2021).
Rather than investigating if tanking is present in the NBA, our case study contributes to the tanking and tournament incentives literature by exploring the financial feasibility of implementing this strategy. The motivation to explore the business aspect of tanking comes from Gong et al. (2021), who show that home and away attendance is negatively impacted once the audience perceives tanking is taking place. However, their sample period covers NBA seasons from 1994 until 2013, excluding the period of our case study. There is no academic consensus on whether sports teams seek to maximize profits or wins (Coates et al., 2014), and welfare outcomes of fans differ across leagues depending on the (potentially non-uniform) mix of win and profit maximization across teams (Dietl et al., 2009). Considering the lack of academic consensus, rather than weighing in on this question, we evaluate the effectiveness of tanking for the Philadelphia 76ers through both lenses.
3 CASE STUDY BACKGROUND
“The Process” refers to the strategy undertaken by the Philadelphia 76ers beginning in 2013 following years of the 76ers being a team that contended for the NBA playoffs but not considered a contender for the NBA title.3 This strategy, spearheaded by then-General Manager Sam Hinkie, involved tanking to accumulate high draft picks with the goal of rebuilding the team into a championship contender. The approach was controversial, sparking debates about ethics, sportsmanship, and the effectiveness of such a bold rebuilding strategy. Figure 1 presents a timeline of the 76ers starting with hiring Hinkie and ending with the conclusion of their first winning season following the hiring.
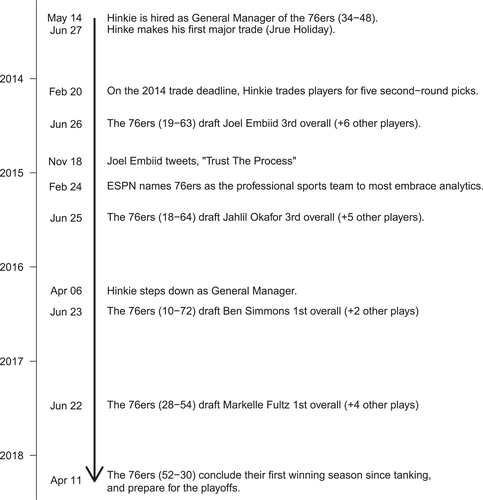
Timeline of the 76ers from 2013 to 2018.
As discussed by Koz et al. (2012), Hinkie recognized that not every top draft pick would turn into a franchise-changing player. In response, to get more so-called “bites at the apple,” Hinkie ensured the 76ers stayed at the bottom of the league by trading away most of Philadelphia's valuable players for additional draft picks. Trading away the team's good players also had the advantage of reducing overall team talent, which in turn increased the franchise's chances of higher-quality picks. The first move made by Sam Hinkie was to trade away the team's best player Jrue Holiday, who had made the NBA All-star game in the previous season, during the 2013 NBA Draft. This trade resulted in the 76ers collecting the first of seven coveted “lottery” picks, four of which were top-three picks, between 2013 and 2017.
Hinkie's desire to get more “bites at the apple” quickly gained importance, as the 76ers repeatedly drafted players that did not become impactful. Of the seven lottery picks selected between 2013 and 2017, only one remains on the roster in the 2023–2024 season: Joel Embiid. While the other six lottery selections failed to make a consistently meaningful impact, Embiid solidified himself as one of the premier talents in the NBA. As of the 2023–2024 NBA Season, Embiid has become a seven-time All-star, four-time second team All-NBA selection, one-time first team All-NBA selection, three-time second team All-NBA Defensive team selection, and the 2023 NBA Most Valuable Player.
Hinkie's strategy, while obvious given his managerial decisions and press conference interviews, was again confirmed in his letter of resignation in April 2016 in which he explained that they wanted to maximize the odds of acquiring star players and listed the draft as the top method to do so.4 The strategy was so unmistakable and polarizing that players and the media coined the phrase “Trust the Process” when defending Hinkie's managerial strategy.
In the seasons following Hinkie's departure, the 76ers begin to make moves to mold the roster into a title contender. In July 2017, the team signed shooting guard J.J. Reddick, who was one of the best three-point shooters in the NBA at the time. That season, the 76ers returned to the playoffs, 2016 first overall pick Ben Simmons was named Rookie of the Year, and Joel Embiid made his first All-star game. The following season, the 76ers made a blockbuster trade with the Minnesota Timberwolves for small forward Jimmy Butler, as well as acquiring Tobias Harris in a trade from the Los Angeles Clippers. Following the acquisition of Harris and Butler, “The Process” was deemed complete on the cover of Sports Illustrated Magazine with the title “Process This The Sixers Are Finally All In”.5
Despite Butler leaving the 76ers to join the Miami Heat and Reddick signing with the New Orleans Pelicans during 2019 free agency, the 76ers continued to make roster adjustments around Joel Embiid and Ben Simmons. During the 2020–2021 NBA season the 76ers finished the season with a record of 49-23, earning the top seed of the Eastern Conference in the NBA Playoffs.6 While the 76ers have not achieved the ultimate goal of winning an NBA Championship (or even making the Eastern Conference Finals), the team remains a perennial title contender. It is worth noting that, despite entering the season in the top three to five for betting odds to win the NBA Championship at major sportsbooks, the 76ers 2024–2025 season was plagued with serious injury leading to a losing.7
4 DATA AND EMPIRICAL APPROACH
4.1 Data
To measure the effects of tanking, we collected team-by-season level on-court performance and team financial information from two main sources for the 2004-05 through 2020–21 NBA seasons.8, 9 We first gathered on-court performance data from basketball-reference.com and hoopshype.com. These data include winning percentage, payroll, points per game, roster age, and average margin of victory. Second, we use financial information gathered from Rodney Fort's Sports Business Data. These data include total revenues, total costs, and Forbes valuations of franchises. Team profits, called operating income in the data, are calculated by subtracting costs from revenues. Table 1 contains summary statistics for these measures for the Philadelphia 76ers compared to the rest of the league.
| Philadelphia 76ers | Rest of NBA | |||||||
|---|---|---|---|---|---|---|---|---|
| Mean | St. dev. | Min | Max | Mean | St. dev. | Min | Max | |
| Winning percentage | 0.448 | 0.156 | 0.122 | 0.681 | 0.501 | 0.152 | 0.106 | 0.89 |
| Total expenses | 155 | 53.5 | 108 | 258 | 161 | 65 | 63.2 | 559 |
| Total revenue | 162 | 78.7 | 107 | 345 | 180 | 85.7 | 73 | 765 |
| Profits | 22.1 | 33.1 | −10.3 | 90 | 30.3 | 39.6 | −99.4 | 206 |
| Forbes valuation | 752 | 602 | 314 | 2075 | 922 | 844 | 199 | 5000 |
| Team payroll | 81.4 | 26.8 | 51.7 | 148 | 82.1 | 25.8 | 23.9 | 171 |
| Points per game | 101 | 7.22 | 92 | 115 | 102 | 6.5 | 87 | 120 |
| Roster age | 25.3 | 1.19 | 23.2 | 27.1 | 26.6 | 1.67 | 22.7 | 31.4 |
| Margin of victory | −1.58 | 5.06 | −10.4 | 5.58 | 0.0452 | 4.58 | −13.9 | 11.6 |
- Note: This table contains summary statistics for key variables in our analysis dataset. Information is recorded for 17 seasons for the 30 current NBA teams. All financial information is expressed in millions of dollars.
- Source: Authors own calculations.
Given the dynamics and non-stationarity in many of these variables' time series (e.g., Forbes valuations), traditional summary statistics may be somewhat misleading. Regardless, the 76ers tend to look like a slightly below average NBA team over the course of the sample. In many ways, getting away from this mediocrity was a major motivation for Hinke. Interestingly, the average Forbes valuation of the 76ers is almost 20% less than that of the rest of the NBA's average. Their valuation could be misleading as valuations increase exponentially over the sample period and the average could be susceptible to large outliers from teams like the New York Knicks, Los Angeles Lakers, and Golden State Warriors. Coincidentally, the 76ers average profits also seem to be about 25% below league average.
4.2 Synthetic Control Method
The synthetic control method (SCM) is a statistical approach used to analyze the impact of an event or intervention that occurs for only a single treated unit (an NBA team in this case). The goal of SCM is to create a “synthetic” version of the treated unit before the aforementioned event or intervention takes place. The synthetic unit is created using a weighted average of other units that had not gone through such an event or intervention. These units are often referred to as a “donor pool.” Once a synthetic unit has been constructed, the researcher can observe how the outcomes for both the “real” and “synthetic” units evolve following the intervention. Since the synthetic unit is constructed from units that had not experienced the event or intervention that the real one experienced, the synthetic unit can be thought of as a counterfactual to the real unit. In other words, the synthetic unit represents the outcome of the real unit in the absence of the intervention. In the case of the 76ers, the outcomes of the synthetic 76ers team represents the outcomes of the real 76ers if they had never hired Hinkie and engaged in such severe tanking.
In the most simple terms, SCM assigns weights to teams in the donor pool such that the weighted average of their outcomes throughout the pre-period is as close to that of the 76ers as possible. SCM also typically includes a regularlization term, similar to that of LASSO regression, that effectively reduces the weights of relatively unimportant units to zero. This way, only a handful of units are chosen to make up the synthetic. Synthetic control also allows for the inclusion of covariates, which help to both predict the outcome as well as eliminate confounding factors. In other words, by including covariates, the researcher can ensure that the synthetic unit matches the real unit in multiple dimensions, ensuring that any differences can indeed be attributed to the treatment.
Once a synthetic unit is estimated, the difference between the synthetic and real units represents the treatment effect. With traditional statistics, however, simply estimating a difference does not mean that the difference is statistically different from zero. To make inference or perform a hypothesis test, one needs an estimate of the standard error to check if zero is within the estimate's confidence interval. Unfortunately, there is no way to calculate traditional standard errors for the SCM at the time of writing. Instead, practitioners typically perform something called a permutation test.
The idea behind the permutation test is to estimate a synthetic control for each unit in the donor pool excluding the treated unit. In theory, since these units did not have any substantial intervention, their estimated treatment effects should simply be noise. The collection of these treatment effects represents a distribution of treatment effects under the null hypothesis (no effect). Therefore, an “exact” p-value can be estimated as the proportion of placebo treatment effects as large as, or larger than, the observed treatment effect. In more concrete terms, if the observed treatment effect is the 3rd largest out of 50 total (1 “real” and 49 “placebo”), the p-value would be . Some permutation tests place requirements or restrictions on pre-treatment fit, and other tests compare ratios of post-treatment to pre-treatment fit. See Firpo and Possebom (2018) for additional, technical details.
In many ways, the SCM can be thought of as a generalization of the more popular quasi-experimental method difference-in-differences. The SCM has the particularly attractive ability to rigorously estimate the effects of an intervention even when the number of treated units is small (or in many cases a singleton), which difference-in-differences struggles with. In other words, the SCM allows for the quantitative statistical analysis of case studies that would have otherwise only been able to be studied qualitatively in the past.
Previous studies employed the SCM to study topics in sports such as the impact of sports stadiums on localized commercial activity (Bradbury, 2022, 2024), crime related to Major League Baseball (Pyun, 2019), college football scandals (Johnson & McCannon, 2022), employment growth associated with the National Football League (Islam, 2019), and the mega-events and economic growth (Kobierecki & Pierzgalski, 2022). We use the SCM to evaluate the effectiveness of the Philadelphia 76ers tanking strategy, which represents the first study to use the SCM to study tanking in the NBA.
The first step in constructing a synthetic Philadelphia 76ers organization is choosing appropriate outcome variables to answer our research question. Though exploring the effects of tanking on on-court success, or rather whether teams tank, is well documented in the literature, we explore winning percentage as one of our outcomes as a way to demonstrate the SCM. It is worth noting that maximizing winning percentage was not necessarily Hinkie's goal when the 76ers started tanking, but rather a highly correlated byproduct. Unfortunately, neither binary outcomes (e.g., winning a championship, making the playoffs) nor binary covariates (e.g., fixed effects, CBA agreements) lend themselves to the SCM framework. Next, to explore off-court financial success, we use team profits as our second outcome. As is conventional, we only consider our outcome variables in 3-year increments (2004, 2008, 2012), rather than every year, in the creation of the synthetic. This is done to avoid the over-valuing of the outcome variables in the determination of the units comprising the synthetic (Kaul et al., 2015; Wiltshire, 2021a).10
The second step to estimate our counterfactual 76ers organization is choosing covariates that capture team performance and roster construction. The selected covariates to predict winning percentage include averages from the 2004-05 through 2012-13 NBA seasons for the margin of victory/loss, points scored per game, average roster age, and team salary adjusted for inflation.11 When evaluating profits as the synthetic outcome, we include the same set of covariates but also include the winning percentage in the selected covariates.
As a final note, the classic SCM may potentially yield biased estimates. Bias-correction procedures to address the biases were proposed by Abadie and L'hour (2021) and Ben-Michael et al. (2021), based on the approach shown by Abadie and Imbens (2011) to handle inexact matching on predictor variables. To account for potential bias, our results are established using bias-corrected synthetic control estimates utilizing the allsynth STATA package developed by Wiltshire (2021b).
This approach automates the estimation of bias-corrected synthetic control gaps through the use of regression-based adjustments that mitigate potential biases in classic synthetic control estimates resulting from differences in predictor values between the synthetic and donor units. For each outcome variable, the biased-corrected synthetic control outperforms the classic synthetic control by yielding a better pre-treatment fit as measured by the root mean square prediction error (RMSPE). The approach also automates the estimation of RMSPE-ranked p-values calculated using an in-space placebo treatment. This approach allows us to assess the statistical significance of the gap between the 76ers and the synthetic 76ers in each post-treatment season. For more information regarding this model, see Abadie and L'hour (2021), Wiltshire (2021b), and Ben-Michael et al. (2021). For a similar empirical example, see Cameron et al. (2023).
4.3 Net Present Value
Tanking in professional sports is a special case of foregoing immediate benefit in favor of future benefit. Economists have developed tools to evaluate opportunities similar to tanking insofar that there are upfront costs and delayed payoffs. Of course, just because an opportunity may generate positive benefits in the future does not necessarily make it is a good investment if the initial costs are sufficiently high.12 A tool often employed by economists to measure the overall quality of such an opportunity is Net Present Value (“NPV”), which is simply the sum of discounted costs and benefits.
If an investor's personal discount rate is lower than the estimated upper-bound, then the investor would prefer the 76ers engage in tanking. Factors that can impact one's personal discount rate include inflation, liquidity preferences, and risk aversion. Hence, for a risk-neutral investor without strong preferences for liquidity,13 their personal discount rate should reflect their personal inflation expectations. Therefore, if the estimated upper bound is greater than reasonable inflation expectations, an investor would likely prefer tanking to the status quo.
The interest rate in the NPV calculation for on-court performance is less interpretable, but the idea is similar. Patient fans who value the future and present similarly will have low discount rates. A discount rate of zero would indicate indifference about time. In addition, ideas like inflation and liquidity preferences do not apply to winning, but the idea of risk aversion can be extended. We assume fans have symmetric valuations for wins and losses, though previous research shows fans indeed discount the futures of their favorite teams (Coates & Humphreys, 2018).
5 EMPIRICAL FINDINGS AND DISCUSSION
We begin this section by estimating a synthetic control of the Philadelphia 76ers' winning percentage per season. Given the success of the 76ers is well-known, we use this application as a first pass to evaluate the ability of this model to generate a plausible counterfactual Philadelphia 76ers. We then estimate the profits per season of the synthetic 76ers and assess whether tanking was financially beneficial to Philadelphia. Finally, we explore and discuss potential revenue and cost components and mechanisms driving our empirical results.
5.1 Winning percentage
Using dynamic simulation models, Tuck and Whitten (2013) show the presence of incentives for teams to tank in win-maximizing leagues with reverse-order drafts. This study complements this previous research by empirically examining if adopting a tanking strategy led the Philadelphia 76ers to be more successful in winning relative to the team's predicted performance if it had not tanked.
Our synthetic Philadelphia is comprised of six teams, given the aforementioned covariates. Table 2 reports the name of, and weight assigned to, each of these teams. The two highest weights are assigned to the Minnesota Timberwolves and Chicago Bulls, which make up just above 50% of the synthetic. The other teams, in order of weight, are the Orlando Magic, Portland Trailblazers, Cleveland Cavaliers, and the Oklahoma City Thunder. Table 3 presents averages for the real and synthetic 76ers.
| Team | Weight |
|---|---|
| Minnesota Timberwolves | 0.321 |
| Chicago Bulls | 0.219 |
| Orlando Magic | 0.137 |
| Portland Trail Blazers | 0.131 |
| Cleveland Cavaliers | 0.106 |
| Oklahoma City Thunder | 0.085 |
- Note: This table contains the weights of other NBA franchises used to make up Philadelphia's synthetic winning percentage.
- Source: Authors own calculations.
| Predictor variables | Actual | Synthetic |
|---|---|---|
| Points per game | 96.8 | 97.2 |
| Margin of victory | −0.75 | −0.76 |
| Roster age | 25.6 | 25.9 |
| Payroll (millions $) | 87.4 | 80.9 |
| Winning percentage (2012) | 41.5 | 42.1 |
| Winning percentage (2008) | 50 | 49.7 |
| Winning percentage (2004) | 52.4 | 50.9 |
| Model Fit Pre-treatment | ||
| Pre-treatment RMSPE | 0.0601087 | |
- Note: This table contains summary statistics for the actual Philadelphia 76ers team and its synthetic counterfactual.
- Source: Authors own calculations.
Figure 2 displays the time series of winning percentages for the real and synthetic 76ers teams, while Figure 3 displays the bias-corrected gap between the real and synthetic 76ers' winning percentages. Filled-in circles denote significance at the 10% level.14 The figure provides a visualization of the expected team performance when tanking. In the pre-period fit, the two lines stay close to one another, with 2009 being the only real exception, which indicates the model performed well when estimating the 76ers' synthetic counterpart.
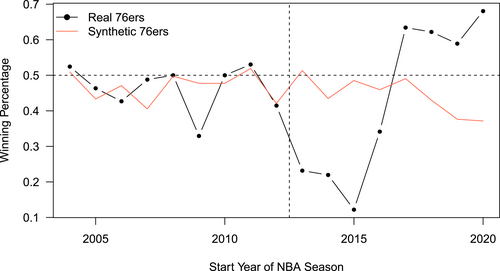
Philadelphia 76ers versus synthetic: Winning Percentage.
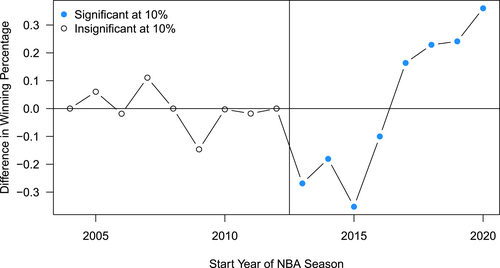
Philadelphia 76ers versus synthetic: Difference in Winning Percentages.
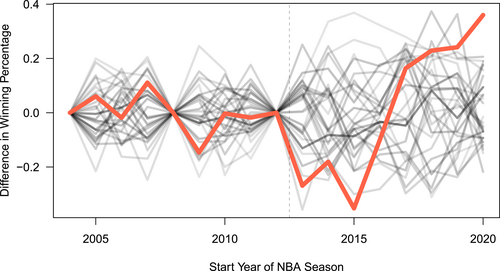
Difference in winning percentages Placebo tests.
Between the 2013 and 2020 NBA seasons, the post-period, the 76ers played four seasons where they performed worse than if they had theoretically not tanked. This is not unexpected since the literature emphasizes that teams intentionally lose games once they are eliminated from being a playoff contender (Price et al., 2010; Taylor & Trogdon, 2002). Over-resting players could be one of the shirking mechanisms behind their under-performance (Gong et al., 2022). However, our findings agree with Lenten (2016) in that despite the initial losing, the 76ers began winning at a rate higher than its synthetic in the years to come.
Even though Hinke's decision to tank was effective in eventually turning the franchise into a winning team, it is important to consider fan preferences toward supporting a losing team for multiple seasons. Following the 2020–2021 season, the final season in our sample, the sum of the winning percentage differences between the real 76ers and the synthetic 76ers is positive. In other words, Hinke's strategy led to more winning than losing relative to the counterfactual. If 76ers fans in 2013 were able to perfectly predict the team's future, and did not discount time or exhibit any loss aversion, they have would have preferred tanking given its relatively higher cumulative winning percentage. Of course, assuming away both time discounting and loss aversion is heroic and unrealistic. Unfortunately, we cannot account for loss aversion in this setting without making other strong assumptions about fan utility functions, but we can explore time discounting. We calculate the NPV of the sum of the differences in team winning percentages across different time discount rates and display the results in Figure 5. We find positive NPVs only when the discount rate is less than 2.2%. This suggests that only the most patient fans, ones who are indifferent about time, would be interested in tanking as a strategy to ultimately win basketball games. If fans discount time at a rate greater than 2.2%, the winning that occurs later in the sample would be valued less than the losing earlier in the sample, resulting in a negative NPV. Fans with discount rates higher than 2.2% would have preferred the status quo.
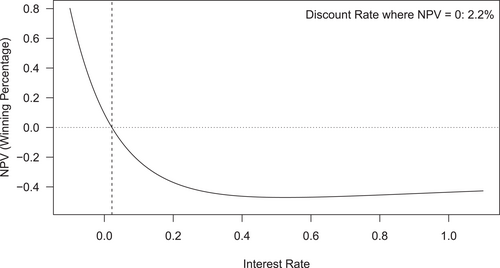
Net present value: Winning percentage.
Of course, underpinning this discussion is the assumption that fans enjoy wins as much as they dislike losses. If the pain of losing is greater in magnitude than the joys of winning, there would likely be no positive discount rate that would make for a positive NPV over this sample. We make this assumption for simplicity; however, previous research suggests that fans do not have symmetric loss functions (Card & Dahl, 2011; Cardazzi et al., 2024; Ge, 2018). It should also be noted that the synthetic 76ers consistently lost over 50% of games. If the synthetic team always won 50% of its games, the interest rate would also be negative. In sum, while Hinkie's strategy ultimately successfully created a winning basketball team, it's unlikely that the costs to fans were worth it unless they do not heavily discount long-term wins.
5.2 Profitability
We find strong evidence that Hinkie's method was successful in eventually turning the 76ers into a winning franchise by the end of the sample. However, to add nuance, our ex-post NPV calculations suggest the initial losing period may have only been acceptable to the most patient and forward-looking fans. Regardless, if a team aims to maximize profits rather than wins, then the 76ers could be unconcerned by putting out a poorly performing basketball team so long as their profits did not suffer. This section analyzes this possibility by applying the synthetic control framework to analyze the impact of tanking on the 76ers' operating income relative to its synthetic counterpart. Due to the importance of championships to team value relative to the team's season winning percentage (Ulas, 2021), team owners likely perceive the expected benefit to be greater than the cost of underperforming in the near future. Moreover, since Philadelphia did not win a championship during our sample, the results presented are likely a lower bound for the financial benefits of engaging in tanking.
Table 4 displays the pool of teams that make up this version of synthetic Philadelphia, while Table 5 contains the balance table. Interestingly, two of the teams in this synthetic Philadelphia, the Orlando Magic and Minnesota Timberwolves, appeared in the previous synthetic for winning percentage. It is also worth noting that the profitability of sports teams is highly dependent on the market they serve. As an example, franchises in New York and Los Angeles are typically some of the most valuable regardless of their performances. As a sanity check, the weighted average of the populations of the metropolitan areas of the selected teams is about 5.8M while the metropolitan population of Philadelphia is about 6.1M.15 While we do not explicitly use market size in the creation of the synthetic, the real and synthetic 76ers appear to serve similarly sized markets. Since success in tanking is directly linked to a team's ability to draft superstar players, similar to the financial impact the presence of a superstar has on a team (Perri, 2014; Price et al., 2010), we find that an effective tanking strategy also leads to greater levels of team earnings.
| Team | Weight |
|---|---|
| Orlando Magic | 0.315 |
| Detroit Pistons | 0.244 |
| Brooklyn Nets | 0.243 |
| Minnesota Timberwolves | 0.197 |
- Note: This table contains the weights of other NBA franchises used to make up Philadelphia's synthetic profits, measured by total revenue less total costs.
- Source: Authors own calculations.
| Predictor variables | Actual | Synthetic |
|---|---|---|
| Winning percentage | 41.5 | 46.8 |
| Points per game | 96.8 | 96.2 |
| Margin of victory | −0.75 | −0.87 |
| Roster age | 25.6 | 26.7 |
| Payroll (millions $) | 87.4 | 82.3 |
| Profits (2012) (millions $) | −3.8 | 1.23 |
| Profits (2008) (millions $) | 7.6 | 6.03 |
| Profits (2004) (millions $) | 0.7 | 0.64 |
| Model Fit Pre-treatment | ||
| Pre-treatment RMSPE | 6.034416 | |
- Note: This table contains summary statistics for the actual Philadelphia 76ers team and its synthetic counterfactual.
- Source: Authors own calculations.
Second, Figure 6 displays both the time series of the real and the synthetic 76ers' profits. Surprisingly, we find an immediate increase in team profits in the first season after Hinkie takes over. Following this, profits for the real 76ers tend to track those of the synthetic. However, in 2017, when the team turned in its first winning season, the profits of the real 76ers eclipsed those of the synthetic. Figure 7 shows the difference between the real and synthetic 76ers. We only find the differences of the first two seasons to be statistically significant at the 10% level.16 Not finding significance here is likely a result of noise in the financial data rather than a true null effect given the relatively large magnitudes. Moreover, most studies that use synthetic control have a treatment that is monotonic in nature, whereas tanking does not necessarily have the same sort of dynamics, which could complicate finding a significant result from placebo tests. Even an insignificant result in this case has practical importance, though. If profits cannot be told apart from one another, then the results could be interpreted as teams being indifferent between tanking and the status quo, which is a novel finding in and of itself.
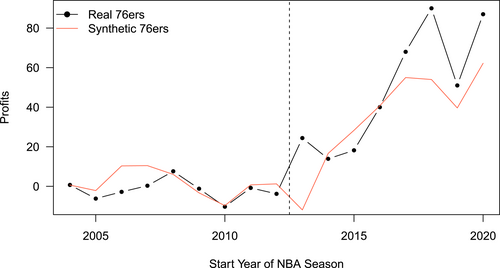
Philadelphia 76ers versus synthetic: Profits.
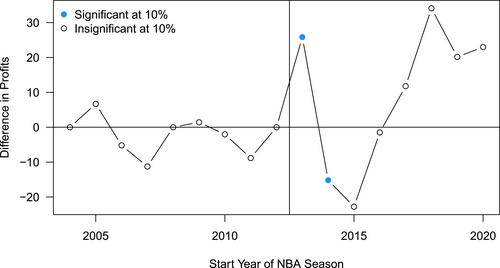
Philadelphia 76ers versus synthetic: Difference in Profits.
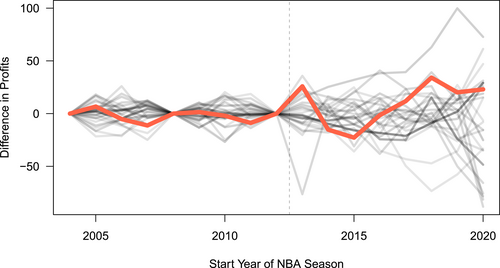
Difference in profits Placebo tests.
We posit a few mechanisms for the change in observed profits for the 76ers. Initially, there were large reductions in player personnel costs driven by Hinkie trading away many of the large contracts he inherited from the previous regime. One of the ways by which Hinkie caused the 76ers to tank was by constraining the level of talent on the roster, which resulted in reduced player costs. Morevoer, as we discuss in a later section, the 76ers tended to draft poorly and their players were often injured or simply did not perform relative to expectations. Therefore, the rookie-scale contracts of these players did not often mature into bloated second-contracts like those of many other lottery picks, which kept costs low for the 76ers. In addition to the decrease in personnel expenses, the NBA employs a revenue-sharing structure in which teams redistribute revenues from television, streaming, advertisement, merchandise, parking, and concession.17 Even though there are income components such as the revenue from ticket sales, which are not shared among teams, gate revenue only accounts for about 16% of a team's total revenue on average. Thus, given the large share of revenue derived from the revenue-sharing structure, the 76ers seem to have leveraged this to subsidize its tanking strategy.
We also calculate the NPV of the difference in profits for the real 76ers relative to its synthetic in Figure 9. We find the NPV at the timing of Hinkie's hiring remains positive for all discount rate values between −10% and 110%, which is likely due to the initial increase in profits from substantial reductions in roster costs. If, however, we ignore the first year's anomalous profits and instead treat this number as zero, we still find a rather large interest rate of 23.3%. This is substantial, and indicates that tanking was a highly profitable strategy for the 76ers. As a reminder, this number can be interpreted as the maximum inflation expectation that a risk-neutral investor without strong preferences for liquidity can have that would make them indifferent between tanking and the status quo. Especially since inflation expectations were historically low during this time period, the profits associated with tanking are clearly preferred to the profits of the status quo.
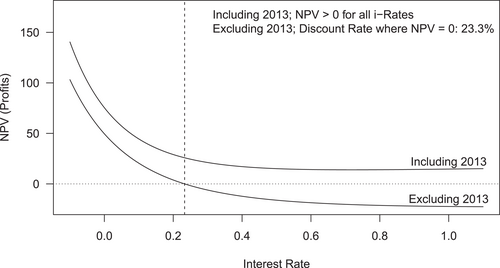
Net present value: Profits.
Put differently, if an investor believed inflation would be 0% per year over the course of the post-period, they would choose the strategy that yielded the larger sum of total cash flows. This strategy would be tanking. However, since most of the benefits of tanking come later in the sample, higher discount rates (or inflation expectations) would shrink the difference between the NPV of tanking and the NPV of the status quo. An investor believing inflation to be 23.3% per year over the course of the post-period would make them indifferent between the two NPVs. Any discount rate higher than 23.3% would encourage the impatient investor to choose the status quo strategy. Of course, this is a hyperbolic example given the highest yearly inflation rate the US has seen since 1960 is about 13.55%, indicating that tanking is preferred by investors under nearly all reasonable circumstances.
An alternate way to interpret the synthetic 76ers is as a weighted portfolio of donor teams. In this case, the NPV represents the returns of investing in the tanking 76ers relative to the return of investing in a weighted portfolio of teams that had similar pre-tanking returns. Of course, there are differences in risk when investing in a portfolio versus a single asset. For this exercise, we assume away these differences in risk since the synthetic 76ers still represents investing in a single team. The idea of a portfolio of teams is simply a way to estimate the performance of Philadelphia if it did not tank.
Lastly, we compute the required interest rate that zeros out the NPV of either winning percentage or profits for each season following Hinkie's hiring. The results are displayed in Table 6. These findings indicate that on-court performance has a strictly negative NPV until 2019. However, the interest rate that sets the NPV to zero in 2019 is negative, which would (implausibly) require fans who heavily discount the present in favor of the future. As mentioned before, even in 2020, the required interest rate is still near zero at 2.2%, suggesting tanking to be preferred to the status quo for only the most steadfast of fans. On the other hand, profits were strictly positive for 2013 and 2014, and 2018 through 2020. The only time an individual would plausibly prefer the status quo to tanking would be those individuals with particularly low discount rates and relatively short time horizons (3–5 years) for their investment to mature. Otherwise, all other investors would prefer tanking.
| Season | Years since Hinkie | -rate (winning Pct) | NPV (winning Pct) | -rate (profits) | NPV (profits) |
|---|---|---|---|---|---|
| 2013 | 1 | −0.100 | −0.269* | −0.100 | 25.85* |
| 2014 | 2 | 1.100 | −0.355* | −0.100 | 8.98* |
| 2015 | 3 | 1.100 | −0.435* | 0.277 | −0.01 |
| 2016 | 4 | 1.100 | −0.446* | 0.300 | 0.01 |
| 2017 | 5 | 1.100 | −0.437* | 0.093 | 0 |
| 2018 | 6 | −0.100 | −0.405* | 0.501 | 11.98* |
| 2019 | 7 | −0.089 | 0.001 | 0.638 | 13.32* |
| 2020 | 8 | 0.022 | 0 | 0.718 | 13.93* |
- Note: This Table presents the interest rate between −10% and 110% that minimizes NPV of either winning percentage or profits. The interest rates, and their corresponding NPVs, are calculated each year post-Hinkie. Note that NPVs far from zero indicate that no interest rate between −10% and 110% generates a NPV of zero. These instances are denoted with a *, indicating the NPV is either always positive or always negative.
- Source: Authors own calculations.
It should be noted that owning an NBA team is not like owning a typical business, and the season-to-season profit stream (i.e., dividends) is probably not the main motivation for investing in or owning an NBA team. Individuals who buy into NBA teams (team owners or ownership groups) are likely fans themselves interested in the novelty, potentially treating the team like an investment in real estate or some other appreciating asset. In this case, profits are made upon the sale of the asset.
6 CONCLUSION
This study investigates an infamous instance of tanking by the Philadelphia 76ers. Even though they are likely not the first to tank in NBA history, the relevance of this case study is that the 76ers are the first to explicitly do so, as evidenced by “Trust the Process.” In addition, Philadelphia is likely the first team to tank for multiple years and decide to do so before seasons even start. Tanking was enough of a problem for the NBA to alter its draft lottery odds such that a race to the bottom is no longer rewarded as handsomely. However, Sam Hinkie was hired to be the general manager (GM) of the Philadelphia 76ers at just the right time and was able to pull off an effective tanking job. Philadelphia went from a borderline playoff team in 2012 to the cellar of the NBA standings in 2016 (when Hinkie was fired) and back to the NBA playoffs in 2018 with a real chance of contending for a championship. In fact, the 76ers were even the number one seed in the Eastern Conference for the 2021 playoffs.
Ultimately, Hinke was indeed successful in his stated goals. Not only was Hinke able to successfully lose and be compensated with high-value draft picks for it, but the team also became a championship contender in the years that followed. However, our results indicate the extensive and prolonged losing throughout “The Process” may not have been worth it to the fans. We find the discount rate where loss-neutral fans would be indifferent between tanking and the status quo to be 2.2%. Given that previous research showed fans to prefer wins now versus wins later (Coates & Humphreys, 2018), it is likely that fan discount rates are quite a bit higher than 2.2%, making the NPV negative for the median fan. Even if the NPV of fan utility is negative, the 76ers as a firm seemed to have outperformed its counterfactual in terms of profitability. The discount rate that would induce indifference is 23.3% (after omitting their initial, highly prosperous season), which is a much higher number than typical inflation during this time period. Therefore, the team owner seems to have made more profits tanking than they would have staying the course and being a middling NBA franchise.
The answer to the main question of should teams “trust the process,” depends on each team's objective function and league landscape. If teams are seeking profit maximization, tanking appears to easily outperform the alternative strategy given the parameters of the NBA in 2013. However, from a win-maximization point-of-view, the 76ers seemed to about break even without accounting for time discounting. Of course, both of these takeaways depend on the draft lottery system (which has been changed to address tanking concerns), ability to draft well, ability to attract free agents, the number of other teams tanking (which is not necessarily as identifiable as in the 76er example), profit sharing agreements, penalties for tanking, general league design, etc.
It is worth noting that tanking is ultimately a probabilistic strategy, and the 76ers draft outcomes during the Process were on the lower end of the distribution. At the time of writing, only two of their seven lottery picks have been named All-Stars (Ben Simmons, Joel Embiid), and only one remains on the team. Two of the seven are no longer on NBA rosters (Michael Carter-Williams, Jahlil Okafor), and the remaining three (Dario Šarić, Nerlens Noel, Markelle Fultz) have had less than productive careers (according to their negative career box plus/minus). Moreover, many of the 76ers' draft picks suffered injuries that sidelined them for, sometimes, entire seasons. The 76ers lost a minimum of four seasons due to injury before their newly drafted player even set foot on the court (Joel Embiid x2, Ben Simmons x1, Nerlens Noel x1). This does not count Markelle Fultz's 14-game rookie season, Joel Embiid's 31-game rookie season, or Ben Simmons's gameless half of the 2021–22 season before he was traded. Given the outcomes of Philadelphia's draft selections, our results represent a lower-bound estimate of the strategy's effectiveness. In other words, our estimates of both profitability and on-court success are likely understated. Nonetheless, the ability of another team to replicate “the Process” as well as the 76ers depends on many factors, especially how stable and competent the organization and GM are (Motomura et al., 2016).
The findings of this study are, of course, subject to various limitations and assumptions aside from tanking being a probabilistic strategy. First, our estimates are just that—estimates—and we cannot know with certainty what the 76ers win loss record or financial standing would have been in the absence of tanking. However, the SCM is especially suited for such a setting where a single unit is treated and provides a way to estimate these counterfactual measures. Second, our NPV value analysis uses a handful of simplifying assumptions such as risk-neutral stakeholders (fans and ownership), constant time discounting, and that investors of NBA teams treat franchises as standard, appreciating assets. We discuss the implications of relaxing these assumptions throughout the manuscript, and we do not believe our results to be particularly sensitive to them. Third, both of our results (winning and profits) represent lower bounds given how poorly the 76ers did in the draft, the main vehicle by which they were supposed to improve. However, it is not clear whether the 76ers had an advantage of being the first known team to tank at scale, if the specific time in which they tanked (little NBA regulation or precedent) facilitated their success, or if such an extensive tank is replicable. This is typically true of case studies, however, and teams will need to be innovative in the way they approach tanking in the future, especially in the face of new NBA regulations.
Future research could investigate the costs and benefits of tanking in other closed-league settings. For example, around the same time as the 76ers, the Houston Astros of Major League Baseball were also tanking, too. This setting is more complicated than that of the 76ers, however, since the Astros changed leagues (i.e., division within Major League Baseball) and were involved in a notorious cheating scandal. Moreover, unlike the NBA, the MLB has a robust minor league system for newly drafted players and lacks both a salary cap and salary floor, to mention only a few of the major differences. Despite the Houston Astros winning two championships in 2017 and 2022, these alternative factors confound the analysis. That said, a similar study could be conducted to explore tanking in baseball, and it is unclear whether the conclusions of this study will extend.
Researchers could also examine marginal tanking which is a more prevalent strategy relative to what the 76ers and Astros employed. For example, how does attendance (Gong et al., 2021), revenues, etc., respond to marginal tanking, or jockeying for playoff seeding, at the end of a season? Additionally, studies in the literature have worked on identifying tanking, mostly by looking at teams who rest healthy players (Gong et al., 2022). However, it is also commonplace for teams to rest healthy players after clinching a spot in the playoffs, or for teams to use less players in high stakes situations. Being able to empirically differentiate between these phenomena would represent an important contribution to the literature on tanking.
ACKNOWLEDGMENTS
The authors would also like to thank Dr. Brian Soebbing for helpful comments throughout the process of writing this manuscript.
ENDNOTES
- 1 See Gong et al. (2022) for additional information.
- 2 Closed sports league refers to leagues in which the number of teams is fixed and there is no promotion on relation based on team performance, while open sports leagues allow teams to move between divisions based on performance.
- 3 From the 2007–2008 NBA season through the 2012–2013, the 76ers lost in the second round of the playoffs once, lost in the first round in the playoffs three times, and missed the playoffs twice. The only first round series victory came against the Chicago Bulls after the Bulls star player, Derrick Rose, was injured.
- 4 Source: http://www.espn.com/pdf/2016/0406/nba_hinkie_redact.pdf
- 5 Source: https://sicovers.com/featured/process-this-the-sixers-are-finally-all-in-february-25-2019-sports-illustrated-cover.html
- 6 Following a poor performance in the playoffs, Ben Simmons requested a trade from the 76ers. He was eventually traded for former MVP James Harden, who spent less than two seasons in Philadelphia before joining the Los Angeles Clippers.
- 7 Source: https://www.rotowire.com/betting/nba/futures.php
- 8 Throughout the paper, we enumerate the NBA seasons by the earlier of the 2 years each season spans. As an example, the 2004-05 season is referred to the 2004 season.
- 9 While the COVID-19 Pandemic surely disrupted the 2019-20 and 2020–21 NBA seasons, we do not believe our results are impacted by the pandemic. Fitting/creating the synthetic 76ers uses data recorded strictly prior to the outbreak, each team faced a similar landscape during/following COVID-19.
- 10 We acknowledge that there may be changes to incentives, strategies, and structures of teams following new collective bargaining agreements (“CBA”) throughout the sample. However, since the CBAs impact each team equally, and thus effectively represent year fixed effects, we do not explicitly consider these in our analyses.
- 11 We consider other measures of performance, such as offensive rating and defensive rating, yielding similar results. The choice of points scored per game and margin of victory/loss provided a better pre-treatment fit.
- 12 For an example in sport economics, see the robust literature on stadium funding (Bradbury et al., 2024).
- 13 Given that tanking is likely to generate lower initial profits than the alternative, investors must be relatively patient to earn greater profits under this strategy.
- 14 Placebos to determine statistical significance are displayed in Figure 4.
- 15 These figures come from the US Census's 2010 MSA population estimates.
- 16 Placebos to determine statistical significance are displayed in Figure 8.
- 17 Note that a new national broadcasting contract was introduced in 2015. This increased yearly television revenues by almost three-fold. While this may seem like it could contribute to or explain the profitability result, this is not the case. Since all teams are exposed to the same change in television revenues, its effects are differenced out between the real and synthetic 76ers. This is also true for the NPV result, of course.
Open Research
DATA AVAILABILITY STATEMENT
The data that support the findings of this study are available in the public domain: basketball-reference.com, hoopshype.com, and Rodney Fort's Sports Business Data at https://sites.google.com/site/rodswebpages/codes.


