CHINA AND WORLD OUTPUT IMPACT OF THE HUBEI LOCKDOWN DURING THE CORONAVIRUS OUTBREAK
Abstract
Using a network approach, we estimate the output loss due to the lockdown of the Hubei province triggered by the coronavirus disease (COVID-19). Based on our most conservative estimate, China suffers about 4% loss of output from labor loss, and global output drops by 1% per period due to the economic contraction in China. About 40% of the impact is indirect, coming from spillovers through the supply chain inside and outside China. (JEL E23, E24, F62)
ABBREVIATIONS
-
- DSGE
-
- Dynamic Stochastic General Equilibrium
-
- GDP
-
- Gross Domestic Product
I INTRODUCTION
This paper provides an estimate on the economic impact of the coronavirus on China and the global economy. Closure of cities and restrictions on travel are thought to be detrimental to production, and our exercise starts with this supply shock. Using historical data on domestic travels during Chinese New Year in mainland China, we first calculate the impact of the loss of workers from Hubei to its own production and that of any other province in the country. Using the latest input–output tables and the industry compositions of each province, we back out the loss in aggregate output due to this loss in labor input. Clearly, a drop in output in China has repercussions for the rest of the world, and we further estimate the loss in global output based on the global trade linkages. Based on our benchmark estimates, the loss in Chinese output is about 4% and global output is about 1% in each period of Hubei lockdown compare with the case without the outbreak of the disease.
We keep the calculation simple and transparent, and the estimate is free from any endogeneity problem due to the unexpected nature of the lockdown. This exercise is also conservative that it only considers the loss of labor input from Hubei province. Drop in labor supply in other provinces, due to different kinds of government actions, is ignored. Effects from reduced international travels in and out of China are also not included. While it may be more realistic to incorporate all such disruptions, we would like to keep the exercise simple and focus on one supply shock constructed through a clean identification strategy. Also, the construction of other types of shocks may have endogeneity issues. On the other hand, this exercise may have overestimated the impact of the coronavirus as it does not allow for both fiscal and monetary policy responses. Again, to keep the exercise tractable and transparent, we leave such matters aside. In a follow-up paper, Luo, Tsang, and Yang (2020) study the output impact of stay-at-home orders in the United States during the coronavirus outbreak using a similar approach.
We borrow the modeling techniques from literature of the economics of networks, which is reviewed in Section II. Some similar studies on other epidemics are also mentioned. Section III explains the model. Section IV describes the different sources of data used in the exercise. The benchmark estimates are provided in Section V and several sensitivity analyses are explained in Section VI.
II LITERATURE
This paper fits into two strands of the literature, production networks and economic costs of epidemics.
Firms are interconnected through trade within and across sectors with specialized productions. The production linkages among firms serve to propagate shocks along the supply chain and ultimately affect the aggregate economy. Since Long and Plosser (1983), a large literature has focused on the aggregate volatility generated by idiosyncratic shocks. Two effects are at work, as presented by di Giovanni, Levchenko, and Méjean (2014). First, owing to the direct effect, shocks can have sizable aggregate effect directly (Carvalho and Gabaix 2013; Gabaix 2011; Jovanovic 1987). For example, the direct impact of the productivity growth of General Electric is a change in U.S. gross domestic product (GDP) by 0.24% in 2000, according to Gabaix (2011). Second, owing to the indirect network effect, shocks can contribute to aggregate fluctuations through contagion within the network (Bak et al. 1993; Horvath 1998, 2000; Dupor 1999; Shea 2002; Conley and Dupor 2003; Foerster, Sarte, and Watson 2011; Levine 2012; Acemoglu et al. 2012; Acemoglu, Ozdaglar, and Tahbaz-Salehi 2015; Jones 2011, 2013; Lu and Luo 2019; Osotimehin and Popov 2020, etc.). For example, a firm that encounters severe financial difficulties would be forced to defer payments or default on their accounts-payable to its suppliers, thus creating further illiquidity problems along the supply chain in a kind of chain reaction and affecting aggregate output negatively (Kiyotaki and Moore 1997; Luo 2020). Another application is Carvalho et al. (2016), who examine the propagation of shocks caused by the Great East Japan Earthquake of 2011 in the prodcution network. Clearly, the spillover of shocks also occurs in the global trade network and impacts the global economy. Lu and Luo (2019) estimate that the network effect is responsible for about 30% of the total global effect of the U.S. monetary policy shock. Borrowing ideas from the literature, this paper focuses on the domestic and global output impact of the supply shock triggered by the coronovirus outbreak in China. Given the increased interfirm integration within China and across the globe, a network approach is essential to access the economic impact of the coronavirus.
Furthermore, there are numerous papers on the economic costs of epidemics. For example, Halasa, Shepard, and Wu (2012) look at the medical costs of dengue in Puerto Rico in 2010, and Armien et al. (2008) do an earlier study for Panama. Yang et al. (1999) calculate the medical costs and market value losses for pigs due to the foot-and-mouth disease in Taiwan in 1997. Bloom and Mahal (1997) control for potential simultaneity between the AIDS epidemic and economic growth and find that the epidemic has little impact on growth. This study differs from most previous studies in two aspects. First, the lockdown of Wuhan (and later most of the Hubei province) is an unprecedented move, and to highlight the drastic policy we only focus on the output loss, directly and indirectly, due to the stoppage of production. All other economic costs such as medical expenses and loss of quality of life are not considered in this study. Second, it is safe to assume that the policy came as a complete surprise, and as a result this study is free from endogeneity or simultaneity concerns.
III A SIMPLE INPUT–OUTPUT MODEL
 (1)
(1)
 .
.
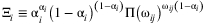 is a constant. Let Ω denote the input matrix with entries (1 − αi)ωij, which capture the amount of j used as an input in producing $1 worth of i output (i.e., Salesj → i/Salesi).
  is a vector of

Notably, v captures the propagation of sectoral-level changes in labor productivity to other sectors and, ultimately, the aggregate impact of the changes. Each element vi of the vector corresponds to the well-known notion of the Bonacich centrality (e.g., Acemoglu, Ozdaglar, and Tahbaz-Salehi 2015; Luo 2020). It captures the systemic importance of each sector to the aggregate output. Mathematically, the geometric summation of the input matrix Ω, which equals [I − Ω]−1, captures both the direct use (represented by Ω) and the indirect use (represented by the higher-order terms, Ωn, n = 2, 3, …) of inputs in the production network.

 (2)
(2) (3)
(3) (4)
(4) (5)
(5)IV COMBINING DATA WITH THE MODEL
We consider two approaches to make use of the model, and other robustness checks are discussed in Section VI. The first approach makes use of a dataset from Baidu that contains inter-province traveling data.
A Using Inter-Province Labor Movements
4.1.1 Sectoral Production Statistics
First, we construct the input–output matrix Ω using 2017 input–output table from National Bureau of Statistics of China, as is the final share ζi. The labor share αi and the intermediate input share 1 − αi are calibrated using the 2017 GDP by Industry Value-Added Component Table. The input–output matrix is illustrated in Figure 1. αi and ζi are presented in Table 1.

Note: Left: Production sector. Right: Consumption sector.
| Labor Share αi | Final Share ζi | |
|---|---|---|
| Agriculture, Forestry, Fishing, and Hunting | 0.59 | 0.05 |
| Mining | 0.52 | 0.02 |
| Food | 0.24 | 0.06 |
| Textile | 0.18 | 0.03 |
| Wood Manufacture | 0.22 | 0.03 |
| Chemical | 0.24 | 0.08 |
| Non-Metal | 0.29 | 0.03 |
| Metal | 0.23 | 0.07 |
| Mechanical Equipment | 0.20 | 0.15 |
| Manufacturing | 0.57 | 0.01 |
| Utility | 0.32 | 0.03 |
| Construction | 0.24 | 0.10 |
| Retail & Transportation | 0.57 | 0.10 |
| Information | 0.52 | 0.03 |
| Finance and Real Estate | 0.65 | 0.08 |
| Science & Technology | 0.40 | 0.02 |
| Service | 0.47 | 0.13 |
| Average | 0.38 | 0.06 |
4.1.2 Labor Statistics
The construction of the labor loss in each sector is constrained by data availability. Here we approximate the sectoral labor shock using inter-province labor movement data and the province-sector production data.
The Lunar New Year is the most important holiday in China during which families get together for feasts. More than 80% migrant workers travel back home during the holiday.3 The Chinese government especially implemented rules guarantee migrant workers New Year holiday travel.4 However, since January 23, 2020, the central government unexpectedly imposed a lockdown in majority places inside Hubei province in an effort to quarantine the epicenter of the outbreak of coronavirus. Due to the lockdown, migrant workers back Hubei could not travel to their provinces for work. In addition, widespread of discrimination was present outside Hubei to Hubei people even if they had not returned home, not limited to travel and working restrictions.
Therefore, we measure labor loss of other provinces using the estimated number of Hubei migrant workers in each province. However, the actual number of Hubei working in each province is not available. Baidu Qianxi dataset reports the percentile of travelers from one province to others or to one province from others at daily frequency. We use Baidu Qianxi data to calculate the average percentile of travelers travel to Hubei from each other provinces during January 12–January 25 of 2020, that is, 2 weeks before the Lunar New Year. Denote this percentile as  . Then, we assume
  approximates the percentile of Hubei workers working in other provinces.5 We present the calibrated
  in Table 2.
 ) and Provincial Labor Share of Country Total Labor (γi)
| γi |  |
γi |  |
||
|---|---|---|---|---|---|
| Beijing | 4.4% | 3.2% | Hubei | 4.0% | NA |
| Tianjin | 1.6% | 0.7% | Hunan | 3.2% | 8.6% |
| Hebei | 3.6% | 1.4% | Guangdong | 10.9% | 27.2% |
| Shanxi | 2.4% | 0.7% | Guangxi | 2.2% | 1.3% |
| Inner-mongolia | 1.6% | 0.2% | Hainan | 0.6% | 0.6% |
| Liaoning | 3.1% | 0.4% | Chongqing | 2.3% | 4.0% |
| Jilin | 1.8% | 0.2% | Sichuan | 4.4% | 2.4% |
| Heilongjiang | 2.4% | 0.2% | Guizhou | 1.7% | 1.2% |
| Shanghai | 3.5% | 4.5% | Yunnan | 2.3% | 1.1% |
| Jiangsu | 8.4% | 7.0% | Tibet | 0.2% | 0.0% |
| Zhejiang | 5.9% | 13.2% | Shaanxi | 2.9% | 2.4% |
| Anhui | 2.9% | 2.6% | Gansu | 1.5% | 0.4% |
| Fujian | 3.7% | 4.1% | Qinghai | 0.4% | 0.1% |
| Jiangxi | 2.6% | 3.9% | Ningxia | 0.4% | 0.1% |
| Shandong | 6.8% | 1.7% | Xinjiang | 1.8% | 0.3% |
| Henan | 6.4% | 6.1% |
There are two types of labor forces in China, formal and informal. Most informal workers are rural workers (or workers from rural areas, “Nongmin Gong”), who are restricted by the Hukou system, and more than half of the labor force are rural informal workers. There is no available dataset on the number of total informal workers in each province. Instead, we have the number of formal workers in each province from National Bureau of Statistics of China, and we assume that the provincial share of informal workers relative to the national aggregate is approximately equal to the share of formal workers. Denoted this share as γi. Thus, the provincial share of total workers and the provincial share of informal workers are the same and equal γi. We present the calibrated γi in Table 2. According to Bureau of Statistics of Hubei, the total number of rural migrant Hubei workers working in other provinces is  , while the total number of rural workers in China is Lrural = 281.71 million in 2016.6 Thus, we estimate the share of Hubei rural workers working in each province using,
  , and assume it equals the share of Hubei formal workers as well as the share of Hubei workers in total. Thus, the percentile of labor loss in each province (excluding Hubei) is assumed equal to
  . The vector of
  is denoted as
  .
.
We infer sectoral labor loss using the provincial labor loss estimates. More specifically, we construct the provincial share of production in each sector using the 2017 Industrial Production Yearbook and Statistics Yearbook of China. Denote Ξsector, province as the matrix with entry ij representing province j's share of production in sector i, which is presented in Figure 2. Thus, Ξsector, province is row normalized. The sectoral labor loss is constructed using a vector of  .
.

Note: Province's share of production in each sector. Row sum = 1. AgricultureFFH represents Agriculture, Forestry, Fishing, and Hunting.
 (6)
(6) .
. (7)
(7) .
.Both  and
and  are illustrated in Figure 3. For instance,
  includes the loss of Hubei workers working in the other provinces and the total amount of labor force in Hubei. The former loss contributes 2.2% of China total labor input, while the latter contributes 4% (as presented in Table 2). The estimated
  is presented in the first row of Figure 3. As presented, the labor loss ranges from 1.1% to 4.5% across
sectors.
is presented in the first row of Figure 3. As presented, the labor loss ranges from 1.1% to 4.5% across
sectors.

B Without Using Inter-Province Labor Movements
With the second approach, we directly estimate sectoral labor loss using sector size relative to total production. Denote the sectoral size vector as s. In particular, we obtain rural worker share in each industry ηi from National Bureau of Statistics of China.8 Denote the vector of ηi as η. We then approximate the rural worker in each sector using siLrural. Finally, we assume that the share of Hubei migrant rural workers in each industry relative to the total Hubei migrant rural workers equals that of the national level η. Thus, we construct sectoral labor loss outside Hubei as  . Finally, sectoral shock follows Equations (6) and (7). We denote them as
  and
and  . z in this approach is illustrated in Figure 3.
C From National to Global Impact
Once the shock is calculated, we can infer the change in GDP using Equation (2), and sectoral output change can be calculated using Equation (5). Furthermore, we can decompose the GDP change into direct and indirect impacts following Equations (3) and (4).
Given the output loss in mainland China, what is the impact for global economy? We make use of the 2017 IMF Direction of Trade Statistics data to construct a trade network and World Bank data for country GDP. The only reason we choose to fix on the 2017 trade data is that China and the United States started their trade war in early 2018. To avoid having this shock disrupting the trade patterns, and to avoid taking a stand on how the trade war evolves under the coronavirus, we use the relatively “clean” year of 2017. We have added this point in the paper.9 Availability of bilateral trade data and country-level GDP data restricts our sample size to 116 countries.10 Denote  ,
,  ,
,  (the share of Country-i. from
  ). ΩG ijth entry is
  . Labor share of the global economy equals 0.42, the share of the U.S. economy. Construct global shock zG as a zero vector with China's entry being the drop in output calculated using one of the above methods, and global GDP impact can be calculated as
  .
.
Notice that the Hubei labor shock has also decreased China imports from foreign countries and our model incorporates this. Since we fit the global trade network to the input–output matrix in the model, the Bonacich centrality that captures the contribution of China shock to the global economy includes both direct effects and indirect effects. The disruption of economic activity in China decreases both exports and imports from other countries at first and also higher orders. On the other hand, since we only consider the supply-side response in this paper, the decrease in imports that is due to a fall in demand in China is not included in this calculation.
V BENCHMARK RESULTS AND SENSITIVITY ANALYSIS
Direct and indirect impact decomposition results along with the total impact are presented in Figure 4 and Table 3. If there is only a labor drop in the Hubei province, China will suffer an output loss from 3.9% to 4.6%, and the global impact is around 1%. Translating into U.S. dollar amount (in 2017 value), the per month loss is approximately 40 billion dollars in China and 65 billion dollars globally (including China). Obviously, the impact is larger if we assume a complete production stoppage of the Hubei province: the loss in China and globally roughly doubles. It is also worth noting that about 40% of the impact comes indirectly, either from the network production structure inside China and the trade network globally.

Note: The first four bars present the response of China GDP. The last four bars present the response of Global GDP. Error bar: total labor loss LHubei→ = [0.5 * 619m, 1.5 * 619m].
 |
 |
 |
 |
||
| China | In % | −3.86% | −4.62% | −9.36% | −8.12% |
| In billion $ | $−39.03 | $−42.80 | $−94.77 | $−82.20 | |
| Global | In % | −0.96% | −1.16% | −2.34% | −2.03% |
| In billion $ | $−63.53 | $−76.18 | $−154.27 | $−133.81 | |
Furthermore, we conduct a sensitivity analysis of adding or cutting 50% from the 6.19 million Hubei rural worker estimate. As shown by the error bars in Figure 4, the magnitude is not affected noticeably.
Sectoral output drops are presented in Figure 5. They partly reflect the size of the sectoral shocks, and they also reflect the input–output relationship across sectors. Agriculture, finance and real estate, manufacturing, retail and transport, service, and food are the most affected. By comparing Figures 3 and 5, we can see that the relative size of the sectoral output loss is related to the relative size of sectoral labor loss. The Agriculture, Forestry, Fishing and Hunting sector, the Finance and Real Estate sector, and the Manufacturing sector are the most labor intensive sectors in China (as presented in Table 1). Thus, they are hit badly by the labor input shocks.

Figure 6 illustrates country level output drop geographically through the first approach with zLabor shock, which is our most conservative measure. Table 4 presents the estimated output drop by continents. Not surprisingly, due to the tighter trade linkage, Asia suffers more from the coronavirus than all other continents. The least affected is Europe, which has a smaller share of imports from China.


Note: Unit is in percentage point decrease. China is in red and has a reduction of 4%. Light gray color: not included due to lack of data.
| Continent |  |
 |
 |
 |
|---|---|---|---|---|
| Asia | −2.07% | −2.48% | −5.02% | −4.36% |
| Oceania | −0.49% | −0.58% | −1.18% | −1.02% |
| Africa | −0.48% | −0.57% | −1.16% | −1.01% |
| North America | −0.44% | −0.53% | −1.08% | −0.93% |
| South America | −0.44% | −0.53% | −1.07% | −0.92% |
| Europe | −0.24% | −0.28% | −0.58% | −0.50% |
Our estimates are conservative in the following two aspects. First, we only consider the loss of labor inputs from Hubei province, while other types of shocks are not considered here, such as demand shocks and liquidity shocks. Second, the Cobb–Douglas specification in the model may underestimate the aggregate impact of the Hubei lockdown. The Cobb–Douglas specification is a very popular set-up in the macroeconomics modeling with good empirical fit, which brings us clean closed-form equilibrium results in this analysis. However, it may bias the prediction by specifying unit elasticity of substitution between all inputs. The aggregate output responses after shocks depend on the level of this elasticity. A lower elasticity of substitution tends to amplify the impact of shocks. For instance, consider an economy with perfectly complementary inputs, the input allocation is unaffected by the ex post price changes after shocks. Thus, the restricted commodity reallocation would reinforce the aggregate impact of shocks. However, a measure of the elasticity of substitution of sectoral inputs in China is not available in the literature and an estimation of that would significantly complicate the study in this paper. Based on an estimate of the U.S. economy by Atalay (2017), the elasticity of substitution between domestic intermediate inputs is close to zero. Through a study about the 2011 Tōhoku earthquake impact on the U.S. economy, Boehm, Flaaen, and Pandalai-Nayar (2019) find that the elasticity of substitution across imported material inputs in the United States is about 0.2, while the elasticity between material inputs and capital/labor is around 0.03. Thus, in a low elasticity of substitution environment, we potentially underestimate the output impact.
VI CONCLUSION
This paper provides a timely estimation of the economic impact of the coronavirus, both at the local and global levels. To keep the exercise simple and transparent, we have to abstract from several aspects of the epidemic, and hence we do not claim that this is the most comprehensive calculation. We mostly want to highlight the network nature of the economic impact. With more closely connected production network within mainland China and trade network across countries, we show that the coronavirus has a non-negligible effect on output.
DATA AVAILABILITY STATEMENT
The authors confirm that all the unrestricted data underlying the findings are fully available from the corresponding author on reasonable request.