Candida albicans infection leads to barrier breakdown and a MAPK/NF-κB mediated stress response in the intestinal epithelial cell line C2BBe1
Summary
Intestinal epithelial cells (IEC) form a tight barrier to the gut lumen. Paracellular permeability of the intestinal barrier is regulated by tight junction proteins and can be modulated by microorganisms and other stimuli. The polymorphic fungus Candida albicans, a frequent commensal of the human mucosa, has the capacity of traversing this barrier and establishing systemic disease within the host. Infection of polarized C2BBe1 IEC with wild-type C. albicans led to a transient increase of transepithelial electric resistance (TEER) before subsequent barrier disruption, accompanied by a strong decline of junctional protein levels and substantial, but considerably delayed cytotoxicity. Time-resolved microarray-based transcriptome analysis of C. albicans challenged IEC revealed a prominent role of NF-κB and MAPK signalling pathways in the response to infection. Hence, we inferred a gene regulatory network based on differentially expressed NF-κB and MAPK pathway components and their predicted transcriptional targets. The network model predicted activation of GDF15 by NF-κB was experimentally validated. Furthermore, inhibition of NF-κB activation in C. albicans infected C2BBe1 cells led to enhanced cytotoxicity in the epithelial cells. Taken together our study identifies NF-κB activation as an important protective signalling pathway in the response of epithelial cells to C. albicans.
Introduction
The polymorphic fungus Candida albicans is a frequent commensal inhabitant of human mucosal surfaces (Ruhnke, 2002), but also responsible for superficial mycoses of the skin and mucosal epithelia (Spellberg et al., 2012). Beyond that, Candida species are the most frequent fungal pathogens causing invasive mycoses in Europe and the US and responsible for a significant proportion of health care associated bloodstream infections (Wisplinghoff et al., 2004). The gastrointestinal (GI) tract is the most common source of invasive C. albicans infection. Accordingly, invasive C. albicans are mostly identical to the strain colonizing the patient's GI tract prior to the systemic disease (Reagan et al., 1990; Nucci and Anaissie, 2001, Miranda et al., 2009; Brillowska-Dabrowska et al., 2010). Direct evidence for translocation of Candida from the GI tract has been demonstrated experimentally in humans (Krause et al., 1969) and mice (Cole et al., 1996; Koh et al., 2008). The intestinal mucosa mainly consists of absorptive enterocytes and constitutes a selective barrier to the gut lumen by excluding noxious compounds and pathogens (Goto and Kiyono, 2012; Marchiando et al., 2010; McCole and Barrett, 2007). Epithelial barrier function is maintained by tight junctions, in which claudins restrict and/or specify the flux of ions and macromolecules across the paracellular space (Suzuki, 2013; Steed et al., 2010). Physiological function of tight junctions is regulated by myosin light chain kinase which influences contraction of the cellular actin–myosin ring connected to the apical junctional complex (Cunningham and Turner, 2012). Mechanical stability of the epithelial monolayer is mainly determined by adherens junctions with E-cadherin forming homodimers between adjacent cells (Huen et al., 2002; Pokutta and Weis, 2007). C. albicans displays various virulence mechanisms, e.g. adhesion to endothelial and epithelial cells, cellular polymorphism with a switch between yeast and filamentous growth forms and thigmotropism (Mayer et al., 2013). Tissue invasion of the fungus requires adhesion to epithelial cells. This can be achieved by several adhesins (Zhu and Filler, 2010), some of them, e.g. Hwp1 (Staab et al., 1999; Staab et al., 2013) or Als3 are expressed in a hyphal-dependent manner. Als3 interacts with E-cadherin (Phan et al., 2007) and also contributes to induced endocytosis of fungal cells in oral epithelial cells (Dalle et al., 2010; Wächtler et al., 2012). C. albicans further expresses a variety of additional potential virulence factors such as lipases and secreted aspartyl proteinases (Saps) (Naglik et al., 2003) among which Sap5 was found to be responsible for degradation of junctional proteins in C. albicans infected oral epithelial cells (Villar et al., 2007). Other studies revealed that C. albicans may trigger intrinsic cellular events resulting in degradation of occludin and E-cadherin in intestinal epithelial cells (IECs) (Frank and Hostetter, 2007). Besides adhesion, epithelial cells can interact with C. albicans by recognizing pathogen-associated molecular patterns (PAMPs) via Toll-like receptor or C-lectin type pattern recognition receptors (PRRs) (Netea et al., 2006; Gow and Hube, 2012; Gow et al., 2012). Sensing of fungal cell-wall components may then trigger activation of downstream MAPK and NF-κB signalling pathways (Peterson and Artis, 2014). In oral epithelial cells Moyes et al. (2010) and Moyes et al. (2014) have shown activation of MAPK and NF-κB signalling pathways in response to C. albicans infection. Proper regulation of NF-κB signalling is crucial to intestinal tissue homeostasis (Jobin and Sartor, 2000; Pasparakis, 2012). To date, global transcriptome analyses of C. albicans infected epithelial cells have been conducted for gingival (Ikuta et al., 2012) and oral cells (Moyes et al., 2014). These studies show a clear up-regulation of genes and pathways involved in innate immunity. Interaction of IECs with microorganisms on a transcriptome level has been analysed for various pathogenic bacteria (Baldwin et al., 2003; Rinella et al., 2006; Mellits et al., 2009; Ferrero et al., 2012) and probiotic microorganisms (Anderson et al., 2010), but not for filamentous fungi.
Here we show that in polarized IEC monolayer, infection with C. albicans leads to temporarily increased TEER before complete barrier breakdown, associated with markedly delayed epithelial cell damage. Infection leads to a pronounced transcriptional up-regulation of MAPK and NF-κB signalling pathways and activation of NF-κB response. A gene regulatory network of their differentially expressed genes was inferred to further investigate these pathways. However, only inhibition of NF-κB, but not MAP kinases, accelerates cellular damage.
Results
C. albicans infection of IEC leads to temporarily increased TEER and barrier breakdown
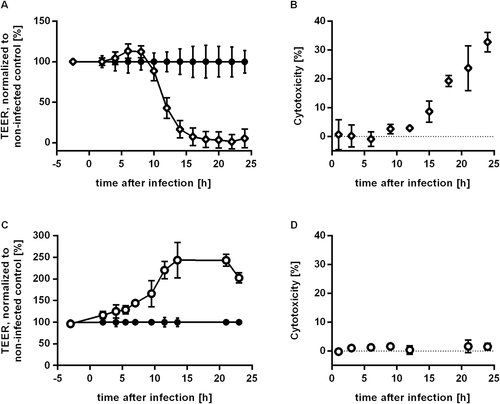
Integrity of the intestinal mucosa is crucial for preventing translocation of microorganisms from the gut lumen to the serosal side of epithelial cells. To assess barrier integrity in the presence of C. albicans we established a transwell system using IECs. Cells of the Caco-2 subclone C2BBe1 (Peterson and Mooseker, 1992) were seeded to confluency in transwell inserts and maintained for 12 days to ensure the establishment of a polarized IEC monolayer. Barrier tightness was determined by measurement of transepithelial electric resistance (TEER) balanced at 500 – 600 Ω∙cm2 at this time. To analyse the influence of C. albicans infection on barrier integrity, C. albicans was added to the C2BBe1 monolayer. After infection with C. albicans strain SC5314 TEER kinetics were measured over the course of 24 h (Fig. 1A). We observed increasing TEER levels starting 4 h after infection (p.i.) with a peak at 6 to 8 h p.i. (infected: 866 ± 53 Ω∙cm2, control: 752 ± 68 Ω∙cm2, P = 0.012). Afterwards TEER levels of infected samples dropped significantly below control values (12 h p.i.: 343 ± 99 Ω∙cm2, 43% of uninfected control). Background levels of empty inserts were reached 18 h p.i. indicating a complete breakdown of the barrier at this time point. To assess whether the barrier breakdown was caused by death of epithelial cells, cytotoxicity was quantified by measuring lactate dehydrogenase (LDH) release from damaged IEC into the apical compartment. Cytotoxicity was undetectable until 12 h after infection. Afterwards cytotoxicity levels increased gradually from 8.7 ± 3.7% at 15 h p.i. to 32.8 ± 3.4% at 24 h p.i. (Fig. 1B). Thus, barrier breakdown clearly preceded damage of the epithelial cells by 3–5 h. C. albicans itself did not contribute to the LDH values as in preparations of C. albicans pure cultures, grown under the same experimental condition, no LDH could be measured (data not shown). Hyphal growth has been described to be related to C. albicans induced host cell lysis. In order to evaluate the influence of hyphal growth in the effects induced by C. albicans wild-type we used the non-filamentous mutant efg1∆/cph1∆ (Lo et al., 1997) in experiments measuring TEER and cytotoxicity. This mutant strain is locked in the yeast phase and lacks expression of several hyphal associated factors (Lo et al., 1997, Martin et al., 2013). Cytotoxicity did not reach values higher than 1.6 ± 2.2% over the whole time course (Fig. 1D). Furthermore, TEER values of IEC inoculated with the non-filamentous mutant strain increased steadily from the first time point measured to reach a plateau 14 h to 21 h after inoculation with 244 ± 41% and 243 ± 14% of non-inoculated IEC. Subsequently, the TEER value dropped at the last time-point measured to 203 ± 12% (Fig. 1C). Consequently, C. albicans efg1∆/cph1∆ was unable to induce barrier breakdown in our model system.
C. albicans induced barrier breakdown is associated with loss of tight junction transmembrane proteins
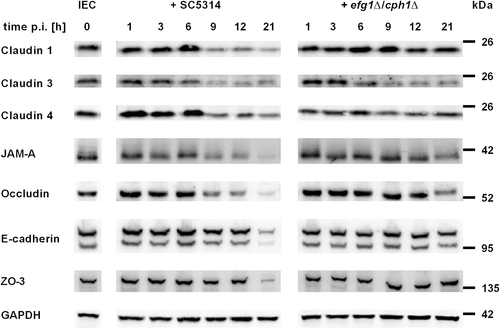
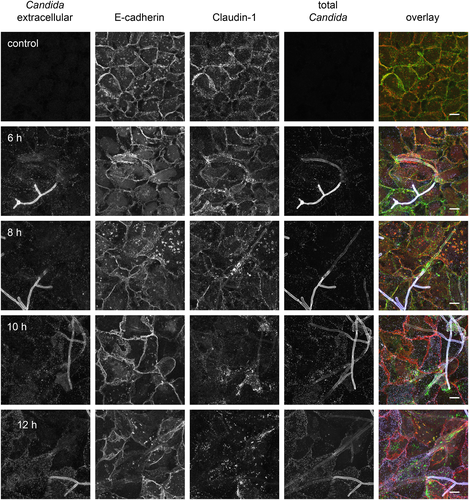
The restriction of paracellular permeability in epithelial barrier function is sustained by tight junctions, whereas adherens junctions are responsible for mechanical stability of the cell layer (Suzuki, 2013; Steed et al., 2010). To assess the role of junctional proteins in the temporarily increase and subsequent drop of TEER we analysed the development of junctional protein levels and distributions after C. albicans infection of C2BBe1 cells by Western blot and immunofluorescence staining. The levels of tight junction transmembrane proteins (occludin, JAM-A, claudin 1, 3 and 4) in whole cell extracts were stable in the first 6 h after infection, but decreased strongly afterwards (Fig. 2). To further analyse barrier composition, the distribution of junctional proteins was visualized at the subcellular level by immunofluorescence microscopy (Fig. 3). Claudin 1 showed a clear cell border staining in control cells and infected samples until 6 h after infection, but 10 h after infection the cell–cell junction staining of claudin 1 was already diminished. At the 12 h time point a distinct cell border staining of claudin 1 was not visible any more. Similar staining kinetics were found for claudin 4, occludin and JAM-A (data not shown). In contrast, the adherens junction protein E-cadherin showed an undisturbed junctional staining pattern even 12 h after infection (Fig. 3). At the total protein level as quantified by Western blot, the amount of E-cadherin was stable until 12 h after infection and decreased only at the 21 h time point. Similarly, the intracellular tight junction component ZO-3 (TJP3) was found to be decreased at 21 h p.i. (Fig. 2). Thus, breakdown of the barrier mainly involves disintegration of tight junction membrane components. In concordance with our previous finding that C. albicans efg1∆/cph1∆ was unable to induce a barrier breakdown, infection with this non-filamentous mutant did not result in diminished levels of claudin 1, ZO-3 and E-cadherin. However, C. albicans efg1∆/cph1∆ did have an effect on some cell-cell-contact proteins as claudin 3 and 4 levels were diminished similar to wild-type infection and JAM-A and occludin were reduced at 21 h p.i. (Fig. 2).
Transcriptome analysis reveals enrichment of stress and immune response pathways
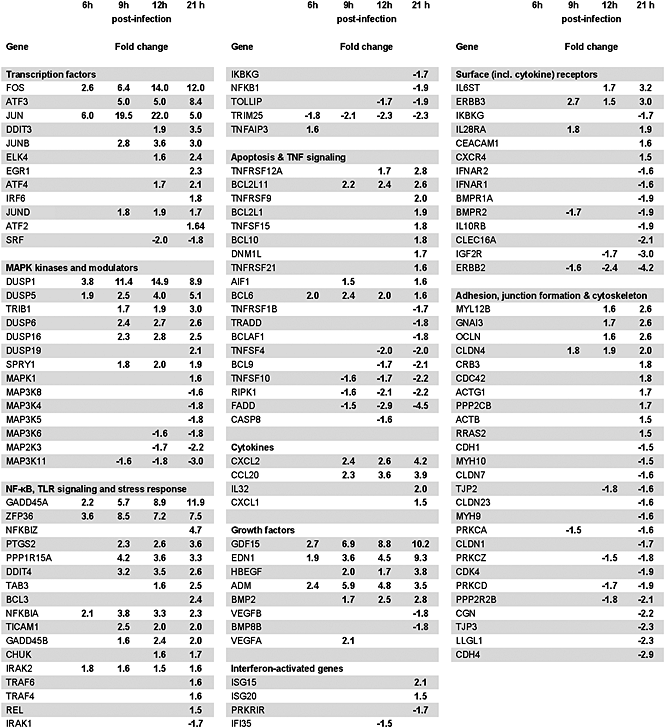
Our results so far suggest that induction of barrier breakdown and host cell lysis are separate events occurring after infection of the intestinal cell monolayer with C. albicans. To gain deeper insight into infection triggered response of IEC, we analysed the transcriptome profile of IEC challenged with C. albicans. IEC grown in transwell inserts were infected with C. albicans at a MOI of 1. Epithelial cell RNA was isolated 1, 3, 6, 9, 12 and 21 h post-infection, reverse transcribed and hybridized to a HumanHT-12 v4 Expression BeadChip. For analysis of differentially expressed genes the cut-off was set to an absolute fold change of 1.5 and an adjusted P-value ≤ 0.05. The number of differentially up-regulated genes steadily increased from 28 at 6 h to 1023 genes at 21 h after inoculation. For down-regulated genes these numbers added up to 17 and 1659 respectively. To look for accumulation of specific signalling pathways in the set of differentially regulated genes, enrichment analysis was carried out on the basis of KEGG functional categories (Table 1). At 6 h significantly enriched functional categories of differentially expressed genes were pathways involved in innate immunity (TLR signalling [16-fold enrichment, adj. P-value 0.018]) and stress response (MAPK signalling pathway [13-fold enrichment, adj. P-value 0.00034] and NF-κB pathway [19-fold enrichment, adj. P-value 0.014]), as well as adaptive immunity and TNF signalling (26-fold enrichment, adj. P-value 0.00017) pathways. The MAPK and TNF signalling pathways continued to be significantly enriched at all later times. Several genes which are part of the MAP kinase signalling pathway (Table 2), a cascade that mediates innate immune response, were found to be upregulated. Both JUN and FOS, whose gene products form the heterodimeric transcription factor AP-1, showed an early up-regulation. Whereas JUN up-regulation peaked at the 12 h time point and dropped afterwards, FOS steadily increased to reach a plateau 12 to 21 h after infection. JUNB, which can also be a component of AP-1 showed up-regulation at later times. That points to a variable composition of AP-1 throughout the course of infection. One major target of AP-1 are the genes of dual specificity phosphatases (Patterson et al., 2009), which inactivate MAP kinases p38, ERK and JNK, thus generating a negative feedback loop of MAPK activation. Indeed, several of these phosphatases, DUSP1, 5, 6 and 16 were moderate to highly up-regulated. In contrast, several MAPKKK protein kinases were down-regulated at the last time point. Another important pathway in innate immune and stress response is the NF-κB signalling cascade. Several transcriptional targets of NF-κB were found to be up-regulated, including the stress response genes GADD45B and DDIT4, apoptosis-related genes (e. g. BCL2L11 [Bim] and BCL2L1 [Bcl-xL]), and the gene of the NF-κB inhibitor IκBα, NFKBIA, which functions as a negative feedback of NF-κB activation. Further up-regulated NF-κB targets included the neutrophil attracting cytokines CXCL1 and CXCL2, the vasoactive factor EDN1 and the growth factor BMP2. Furthermore, highly up-regulated was a member of the TGFβ-family of growth factors, GDF15, with a potential stabilizing function on the mucosal epithelium (Choi et al., 2013).
| KEGG | Term | # of genes | Fold enrichment | Adj. P-value |
|---|---|---|---|---|
| 6 h p.i. | ||||
| hsa04668 | TNF signalling pathway | 5 | 25.7 | 1.7 · 10−4 |
| hsa04010 | MAPK signalling pathway | 6 | 13.2 | 3.4 · 10−4 |
| hsa04660 | T cell receptor signalling pathway | 4 | 21.7 | 1.4 · 10−3 |
| hsa04662 | B cell receptor signalling pathway | 3 | 23.5 | 8.5 · 10−3 |
| hsa04064 | NF-kappa B signalling pathway | 3 | 18.6 | 0.014 |
| hsa04620 | Toll-like receptor signalling pathway | 3 | 16.0 | 0.018 |
| hsa04722 | Neurotrophin signalling pathway | 3 | 14.1 | 0.022 |
| hsa04380 | Osteoclast differentiation | 3 | 12.8 | 0.025 |
| hsa04630 | Jak-STAT signalling pathway | 3 | 10.9 | 0.036 |
| 9 h p.i. | ||||
| hsa04668 | TNF signalling pathway | 11 | 6.2 | 2.2 · 10−4 |
| hsa04010 | MAPK signalling pathway | 15 | 3.6 | 1.2 · 10−3 |
| hsa04144 | Endocytosis | 13 | 3.9 | 1.2 · 10−3 |
| hsa04064 | NF-kappa B signalling pathway | 7 | 4.7 | 0.022 |
| hsa04913 | Ovarian steroidogenesis | 5 | 6.0 | 0.034 |
| hsa04620 | Toll-like receptor signalling pathway | 7 | 4.1 | 0.035 |
| hsa04210 | Apoptosis | 6 | 4.3 | 0.048 |
| 12 h p.i. | ||||
| hsa04144 | Endocytosis | 21 | 2.8 | 2.5 · 10−3 |
| hsa04010 | MAPK signalling pathway | 24 | 2.5 | 2.5 · 10−3 |
| hsa04668 | TNF signalling pathway | 14 | 3.4 | 2.6 · 10−3 |
| hsa04915 | Estrogen signalling pathway | 12 | 3.2 | 0.011 |
| hsa03015 | mRNA surveillance pathway | 11 | 3.2 | 0.014 |
| 21 h p.i. | ||||
| hsa04668 | TNF signalling pathway | 27 | 2.9 | 1.9 · 10−5 |
| hsa04110 | Cell cycle | 29 | 2.8 | 1.9 · 10−5 |
| hsa04141 | Protein processing in endoplasmic reticulum | 34 | 2.4 | 4.2 · 10−5 |
| hsa04144 | Endocytosis | 38 | 2.2 | 6.7 · 10−5 |
| hsa04919 | Thyroid hormone signalling pathway | 25 | 2.5 | 3.7 · 10−4 |
| hsa04010 | MAPK signalling pathway | 41 | 1.9 | 8.8 · 10−4 |
| hsa04920 | Adipocytokine signalling pathway | 17 | 2.9 | 8.8 · 10−4 |
| hsa04146 | Peroxisome | 18 | 2.7 | 1.6 · 10−3 |
| hsa04915 | Estrogen signalling pathway | 20 | 2.4 | 2.9 · 10−3 |
| hsa04210 | Apoptosis | 18 | 2.5 | 2.9 · 10−3 |
| hsa04012 | ErbB signalling pathway | 18 | 2.4 | 3.6 · 10−3 |
| hsa04910 | Insulin signalling pathway | 24 | 2.0 | 6.7 · 10−3 |
| hsa04350 | TGF-beta signalling pathway | 16 | 2.4 | 8.2 · 10−3 |
| hsa04068 | FoxO signalling pathway | 22 | 2.0 | 0.014 |
| hsa04722 | Neurotrophin signalling pathway | 20 | 2.0 | 0.018 |
| hsa04662 | B cell receptor signalling pathway | 14 | 2.3 | 0.018 |
| hsa04070 | Phosphatidylinositol signalling system | 15 | 2.2 | 0.020 |
| hsa04066 | HIF-1 signalling pathway | 18 | 2.0 | 0.021 |
| hsa03015 | mRNA surveillance pathway | 16 | 2.1 | 0.023 |
| hsa04916 | Melanogenesis | 17 | 2.0 | 0.026 |
| hsa04660 | T cell receptor signalling pathway | 17 | 2.0 | 0.034 |
| hsa04620 | Toll-like receptor signalling pathway | 17 | 1.9 | 0.039 |
| hsa04064 | NF-kappa B signalling pathway | 15 | 2.0 | 0.045 |
| hsa04913 | Ovarian steroidogenesis | 10 | 2.3 | 0.045 |
| hsa04390 | Hippo signalling pathway | 22 | 1.7 | 0.047 |
| hsa04114 | Oocyte meiosis | 17 | 1.8 | 0.048 |
Gene regulatory network analysis infers NF-κB as a central hub in the epithelial response to C. albicans
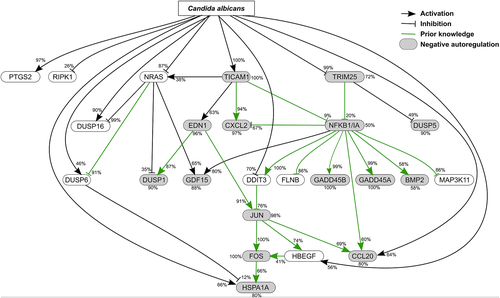
Functional categorical analysis of differentially expressed genes suggested a prominent role of the MAPK and NF-κB pathways (Table 1). For further investigation of the pathways' interplay, we adopted network inference, i.e. the prediction of a gene regulatory network based on gene expression data and prior knowledge. Here, we applied NetGenerator V2.0 (Weber et al., 2013) to predict a small gene-regulatory network from time-resolved microarray data (Suppl. Fig. 1). The utilized set of 24 candidate genes (Suppl. Table) comprised differentially expressed genes (absolute fold change ≥ 2, adj. P-value ≤ 0.05) of KEGG hsa04010 (MAPK signalling) and hsa04064 (NF-κB signalling) pathways. The NF-κB complex was also included, based on the gene expression values of NFKBIA (absolute fold change of 1.09 [at time point 1 h], 1.38 [3 h], 2.06 [6 h], 3.77 [9 h], 3.28 [12 h] and 2.26 [21 h]). Prior knowledge about interactions guides the network interference process. Hence, we extracted prior knowledge from literature and predicted NF-κB and AP-1 transcription factor binding sites (TFBSs). It was softly integrated into the network and the robustness of predicted interactions to noise was tested (see methods). The final predicted robust gene regulatory network (Fig. 4) consisted of 24 nodes (genes) and a total of 56 edges (gene interactions), including 25 activating and 14 inhibiting connections. The complex NFKBIA/NF-κB appeared as the main hub in the predicted network with 11 robust edges. The MAPK transcription factor JUN represented another hub with five edges, connected to both NFKBIA/NF-κB and FOS. This points to the central role these transcription factors play in their respective signalling pathways in response to the infection. Another hub with 6 edges comprised the small G-protein NRAS. NRAS was connected to three of the four DUSP genes present in the network. The interplay between JUN/FOS and NFKBIA/NF-κB in the network is supported by the cytokine CCL20 as a common target of both transcription factor complexes.
Activation of NF-κB pathway decreased C. albicans induced damage of IEC monolayer
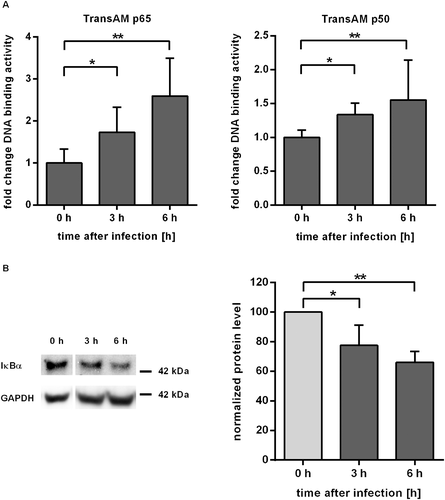
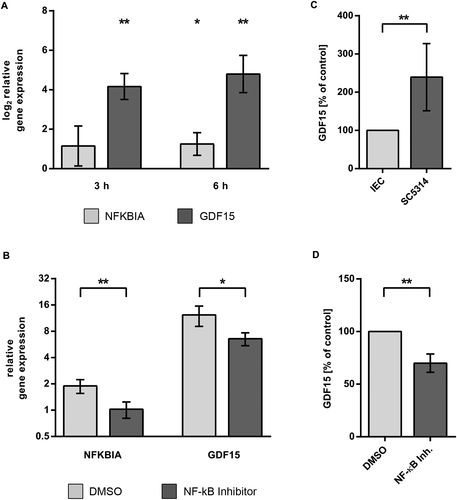
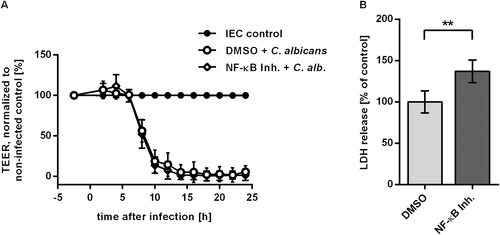
Given the prominent role of the NF-κB pathway in pathway analysis and network inference, we aimed to confirm NF-κB activation in C. albicans challenged IEC. Key events in the activation of the canonical NF-κB pathway are the release of p65 and p50 transcription factors after phosphorylation and subsequent degradation of the inhibitor IκBα. Activation of NF-κB could be demonstrated by TransAM ELISA (Fig. 5A). Equal amounts of nuclear extracts of control and C. albicans infected C2BBe1 cells grown in tissue culture flasks were subjected to transcription factor ELISA. During infection with C. albicans, the activity of p65 increased to values of 1.7-fold at 3 h p.i. and 2.6-fold at 6 h p.i. compared to control cells. Likewise, p50 activity showed a significant increase at 3 h and 6 h (Fig. 5A). Western blot analysis also showed a steady decline of IκBα levels to 68 ± 7.9% 6 h after infection (Fig. 5B). To further confirm NF-κB activation and regulatory effects predicted in our network we quantified transcription of two NF-κB target genes by quantitative RT-PCR. The gene for IκBα, NFKBIA, is part of a negative feedback loop of the NF-κB pathway (Renner and Schmitz, 2009). Degradation of IκBα leads to activity of NF-κB transcription factors with subsequent increase in NFKBIA transcription. Thus, NFKBIA is a known target of NF-κB signalling and was used as a positive control. Our network inference had revealed activating edges from NRAS and NFKBIA/NF-κB to the growth differentiation factor GDF15, which have not previously been described. Thus, we included GDF15 in the transcription analysis to confirm conclusions from our regulatory network. Transcription levels of NFKBIA and GDF15 increased after Candida infection, showing a fold change of 2.5 and 33.2 after 6 h (Fig. 6A). In the presence of the NF-κB activation inhibitor 6-Amino-4-(4-phenoxyphenylethylamino) quinazoline (Tobe et al., 2003), upregulation of both genes was reduced, confirming NF-κB dependent regulation (Fig. 6B). In addition to transcription analysis, we could also confirm increased secretion of GDF15 by C. albicans infected epithelial cells (Fig. 6C). Again, release of GDF15 after NF-κB inhibition in infected cells dropped to 71.7 ± 7.4% of control (P < 0.01, Fig. 6D), further showing the NF-κB dependence of GDF15 regulation. In contrast, uninfected IEC treated with NF-κB inhibitor showed no significant increase compared to DMSO-treated control (Suppl. Fig. 4). To test whether NF-κB signalling is also involved in the two major processes of barrier breakdown and host cell damage, we quantified TEER and cytotoxicity in the presence of the NF-κB activation inhibitor. No effect of NF-κB inhibition on TEER kinetics could be observed during infection with C. albicans (Fig. 7A). Consistently, Western blot analyses showed similar kinetics of tight junction protein levels for C. albicans infected IEC cells treated with either DMSO or NF-κB activation inhibitor (not shown). In contrast, inhibition of NF-κB led to a significant higher LDH release into the supernatant compared to DMSO treated control (Fig. 7B) during C. albicans infection, indicating enhanced cytotoxicity. In control experiments treatment of uninfected IEC with the NF-κB activation inhibitor did not affect cytotoxicity levels (Suppl. Fig. 2). In addition, neither inhibition of mTor, PI3K, p38, ERK1/2, nor JNK did enhance cytotoxicity in C. albicans infected IEC (Suppl. Fig. 3).
Discussion
In our study, we investigated the response of an in vitro model system for the intestinal epithelial barrier to infection with C. albicans. Upon infection, TEER increased until 8 h post infection before total breakdown of the barrier. Time course analyses clearly showed that this breakdown was not directly related to infection induced cell death, which occurred at later time points. Thus loss of barrier integrity as well as invasion of hyphae into IEC preceded cell death. In contrast to endothelial and oral epithelial cells, IEC do not endocytose C. albicans (Dalle et al., 2010). Indeed we observed cellular actin staining surrounding hyphae, indicative of protective responses in host cells. Recently, Albac et al. (2016) showed C. albicans transcytosis through M cells. Although this was the main route of fungus translocation in their model, they still observed a considerable portion of invasion into IEC, which did not occur via endocytosis. Using Western blot and confocal microscopy, we could show that barrier breakdown was related to a decline of tight junction protein levels and their concomitant disappearance from cell–cell borders. Compared to the transient TEER peak observed for wild-type infection, the non-filamentous C. albicans mutant efg1∆/cph1∆ triggered a persistent rise in TEER and no enhanced LDH release. This confirms its inability to induce barrier breakdown as well as cell death and resembles patterns found in IEC challenged with probiotic bacteria, e.g. increasing TEER in Caco-2 monolayers by Lactobacillus plantarum (Anderson et al., 2010). This study observed increased transcription of occludin and other tight junction protein genes. Furthermore, Hering et al. (2014) reported an increase of TEER in response to the probiotic Escherichia coli strain Nissle in HT-29 IEC, which was dependent on elevated claudin 14 levels and involvement of PKCζ and ERK1/2. In T84 cells Zyrek et al. (2007) observed a ZO-2 and PKCζ dependent TEER increase. In contrast, we did not observe enhanced expression of major cell–cell contact proteins upon infection with C. albicans efg1∆/cph1∆. To investigate molecular mechanisms of barrier breakdown after C. albicans wild-type infection of IEC, we performed a time course analysis of transcriptomic changes in the epithelial cells. Our analyses revealed a considerable up-regulation of genes involved in PRR downstream signalling, cellular stress and inflammation, namely MAPK, TNF and NF-κB signalling pathways. On the other hand, no early up-regulation of tight junction transmembrane components, which could explain the transient TEER peak, was detected by microarray. Array data revealed strong differences between intestinal and oral epithelial cells (Moyes et al., 2014): noticeable, in our system, C2BBe1 cells do not up-regulate anti-microbial peptides, whereas especially DEFB4 (hBD-2) was highly up-regulated in oral epithelial cells. Moreover, the pattern of differentially regulated cytokine genes is different. Whereas oral cells up-regulate IL-8, GM-CSF and many components of IL-1 and IL-6 family cytokines, intestinal cells showed increased transcription of several vasoactive cytokines, e.g. EDN1. Gingival cells displayed a mixed pattern (Ikuta et al., 2012). Although oral cells display a stronger pro-inflammatory cytokine response than the more hyporesponsive intestinal cells, several genes of the inflammatory response and PRR downstream signalling were similarly activated in both oral and intestinal cells upon Candida challenge. This included genes of the NF-κB signalling pathway, namely NFKBIA and some stress response genes (GADD45A, TNFAIP3) as well as a number of dual specificity phosphatases, negative regulators of the MAP kinases. However, of the several up-regulated components of the AP-1 transcription factor, only the eponymous genes JUN and FOS appeared differentially regulated in both cell types. Interestingly, the biphasic response of oral epithelial cells to Candida infection, depending on sequential activation of FOS and JUN transcription factors (Moyes et al., 2010), was also reflected by the transcriptional data in our study, as microarray data show a similar time shifted differential expression of JUN and FOS. To elucidate the specific effect of Candida infection we applied a network inference approach based on differentially regulated genes of both pathways. NetGenerator (Weber et al., 2013) has already been successfully applied for network modelling in C. albicans (Linde et al., 2015), an interspecies regulatory network of host cells interacting with this pathogen (Tierney et al., 2012), and for cells challenged with multiple stimuli (Kupfer et al., 2014). In our work, the network inference modelling of MAPK and NF-κB signalling pathway components induced by C. albicans infection demonstrates the interplay between the two pathways through a DDIT3-JUN-FOS axis and joint regulation of CCL20 by NF-κB and JUN. A NF-κB TFBS in the DDIT3 promoter region was detected by the oPOSSUM tool. This fits to the observation that in radiation stressed MCF7 cells DDIT3 upregulation is suppressed by inhibition of NF-κB activity (Guo et al., 2003). Moreover, interaction of DDIT3 with JUN and FOS was found by Ubeda et al. (1999). Another robustly predicted connection in the gene regulatory network represents an activating edge from NFKBIA/NF-κB to GDF15. This member of the TGFβ superfamily of cytokines was reported to be up-regulated after oxidative (Han et al., 2008) and nitrosative stress (Kempf et al., 2006) in tissue, and also had protective effects on cultured myocytes (Kempf et al., 2006). Baek et al. (2001) found a putative NF-κB binding site in the GDF15 promoter of HCT 116 cells, although the authors did not further examine the functionality of this site. In our model, inhibition of NF-κB in C. albicans infected IEC suppressed transcription of GDF15 and GDF15 release into supernatants. As GDF15-dependent prolonged NF-κB activation leads to improved cell survival after EPEC infection in cultured epithelial cells (Choi et al., 2013) this might represent a protective feedback loop. The NF-κB pathway has to be tightly regulated, because permanent activation as well as inhibition of NF-κB could lead to intestinal damage (Wullaert et al., 2011). In our study, inhibition of NF-κB signalling led to increased damage in C. albicans infected IEC. This is consistent with data from murine models, which showed that inhibition of NF-κB by enterocyte-specific ablation of IKK2 enhanced acute inflammation and increased apoptosis rate of epithelial cells after induced colitis (Eckmann et al., 2008) and Clostridium difficile toxin treatment (Chae et al., 2006). Thus, the increased damage induced by DSS or toxin A in the intestinal mucosa of mice with disrupted epithelial NF-κB signalling could be attributed to the impaired antiapoptoic function of NF-κB in mucosal cells (Spehlmann and Eckmann, 2009). On the other hand, IEC specific overexpression of IKK2 resulted also in increased damage and impaired barrier (Guma et al., 2011) caused by proinflammatory NF-κB signalling and immune cell infiltration, also showing the importance of proper regulation for intestinal homeostasis. Interestingly, in our study inhibition of NF-κB did not modulate barrier breakdown. This confirms that barrier breakdown and cell damage are distinct biological processes mediated by different mechanisms.
In conclusion, inhibition of NF-κB, but not MAPK signalling augmented damage of infected cells, but had no effect on loss of tight junction capacity. Thus, proper regulation of NF-κB signalling is important in the cells' resistance to C. albicans induced damage, but neglectable for regulation of barrier function.
Experimental procedures
Maintenance and growth of IECs
The IEC line C2BBe1 (ATCC® CRL2102™), a Caco-2 subclone (Peterson and Mooseker, 1992), was purchased from LGC Standards. Cells at passages 55 to 70 were grown in DMEM/Ham's F12 medium with 17.5 mM glucose and stable glutamine (PAA), supplemented with 0.1 Vol. Fetal Bovine Serum (FBS Gold, PAA), and 5 µg/ml Proxyferrin (Biochrom). IEC were seeded at a density of 75 000 cells/cm2 in Transwell polycarbonate inserts with 0.4 µm pore size (Corning) coated with Matrigel (BD Biosciences) and maintained for 12 days to reach confluent polarized monolayers. Culture media was changed every 3–4 d. For transcription factor activity and qRT-PCR experiments 25 000 cells/cm2 were seeded into Matrigel-coated cell culture flasks and cultivated for 5–6 d.
C. albicans growth and infection
C. albicans wild-type (SC5314) was used for most experiments (Gillum et al., 1984). The non-filamentous C. albicans mutant strain cph1∆/efg1∆ (cph1::hisG/cph1::hisG, efg1::hisG/efg1::hisG-URA3-hisG) and the corresponding parental strain CAI4 (ura3::imm434/ura3::imm434, RPS1/rps1::CIp10) (Fonzi and Irwin, 1993) were provided by B. Hube, HKI Jena. For infection of IEC monolayers Candida cells were grown in YPD medium overnight at 30°C, diluted to an OD of 0.25 and harvested in the exponential growth phase when reaching an OD of 1–1.2. Yeast cells were washed two times with PBS before C2BBe1 monolayers were mainly inoculated at a MOI of ≈1.
Infection of inhibitor treated IEC
For infection of inhibitor treated IEC media was changed to serum-free culture media 24 h before inoculation. Twenty-three hours later 2.5 μM NF-κB activation inhibitor [6-Amino-4-(4-phenoxyphenylethylamino)quinazoline] was added to the basolateral compartment. An equal volume of the inhibitor solvent dimethylsulfoxide (DMSO) was added to control inserts.
Determination of barrier integrity and cellular cytotoxicity
Measurement of barrier integrity of C2BBe1 monolayer was performed by measuring TEER with a chopstick electrode connected to a Volt-Ohmmeter (World Precision Instruments). The blank value determined before seeding the cells was subtracted from the measured value. TEER usually reached 600 Ω∙cm2 3–4 d after seeding. Cytotoxicity was determined by measuring LDH activity of the supernatant from the apical compartment with a colorimetric assay (Roche Diagnostics). Cytotoxicity was calculated with the formula: cytotoxicity [%] = (exp. value − low control) / (high control − low control) × 100.
Quantification of secreted GDF15
Concentration of GDF15 in supernatants was measured by Luminex technology with the Human Magnetic Luminex Screening Assay (R&D Systems) according to the manufacturer's instruction.
Immunoblotting
Cell pellets were lysed in lysis buffer (200 mM NaCl, 50 mM Tris, 1% deoxycholate, 1% Triton X-100, 0.1% SDS and 4 mM EDTA), supplemented with protease inhibitor (Roche, Mannheim, Germany) for 45 min on ice, centrifuged at 4°C, 18 000 × g, 15 min. Protein concentration of the supernatants was determined with BCA protein assay (Thermo Scientific). Equal amounts of protein were separated on SDS-PAGE (Tris-HEPES gels, Thermo Scientific) and transferred onto polyvinylidene fluoride sheets (Immobilon-FL; Merck Millipore). PVDF membranes were blocked with BSA and incubated with primary antibody overnight at 4°C. Fluorochrome-conjugated secondary antibodies were applied for 2 h at RT. Blot images were captured with a Fluorchem Q imager (Biozym) and quantified with Alphaview software.
Immunofluorescence microscopy
C2BBe1 were grown in 24-well transwell inserts for 12 d, inoculated with C. albicans at a MOI of ≈1. At specified times inserts were fixed with 4% phosphate-buffered formaldehyde (Histofix, Carl Roth) for 10 min and then washed with PBS. For differential staining of the extracellular, non-penetrating fraction of C. albicans, samples were incubated first with horseradish peroxidase conjugated anti-Candida antibody (Acris Antibodies) for 45 min at 37°C. Then, samples were permeabilized with 0.5% Triton X-100 for 7 min on ice. After washing with PBS, inserts were incubated with 5% normal donkey serum in combination with primary antibodies (including FITC-labelled anti-Candida antibody for staining intra- and extracellular Candida) for 2 h at 37°C. Incubation with appropriate secondary antibodies and DyLight 649-labelled rabbit anti-horseradish peroxidase IgG (staining of extracellular Candida) followed for 45 min at 37°C. Stained inserts were mounted in 1,4-Diazabicyclo[2.2.2]octan (DABCO, Carl Roth) containing polyvinylalcohol (Mowiol 4–88, Carl Roth). Images were recorded with a 63x Plan-Apochromat oil immersion objective (NA 1.46) on a confocal laser scanning microscope (LSM780, Zeiss, Göttingen) and processed with ZEN software (Zeiss). Final figure processing and compilation was carried out in Adobe Photoshop.
Antibodies
Antibodies used were polyclonal rabbit anti-C. albicans conjugated with FITC or horseradish peroxidase (Acris Antibodies), polyclonal goat anti-E-cadherin (R&D Systems), monoclonal mouse anti-E-cadherin (clone 36, BD Bioscience), polyclonal rabbit anti-occludin (Life Technologies), monoclonal mouse anti-claudin 1 (clone 2H10D10, Life Technologies), polyclonal rabbit anti-claudin 3 (Life Technologies), monoclonal mouse anti-claudin 4 (clone 3E2C1, Life Technologies), monoclonal mouse anti-GAPDH (clone 6C5, Abcam), polyclonal rabbit anti-JAM-A (F11R) (Life Technologies), polyclonal mouse anti-ZO-3 (Abnova) and monoclonal mouse anti-IκBα (clone L35A5, Cell Signaling). DyLight 405, 488, 549 and 649 conjugated species-specific secondary antibodies raised in donkey were used for immunocytochemistry and immunoblots (Jackson Immunoresearch). Secondary antibody against horseradish peroxidase was DyLight 649 labelled rabbit IgG (Jackson Immunoresearch).
RNA isolation
Immediately after removal of culture media, RNAprotect (Qiagen) was added to the cells in order to stabilize the cellular RNA. The detached cells were removed from the insert and stored at 4°C until RNA isolation. Preparation of whole RNA was carried out with the RNeasy Plus Mini Kit (Qiagen) according to the manufacturer's protocol. The quality of the RNA preparations was controlled by analysing the samples with a Bioanalyzer 2100 (Agilent), RNA concentration was measured spectrophotometrically with a microplate reader (Nanoquant plate, Tecan).
Microarray procedures and gene expression analysis
For whole transcriptome analysis three biological replicates were conducted. Non-infected IEC sampled at matched time-points served as control. Five hundred nanograms of total RNA was subjected to cRNA synthesis with the Illumina TotalPrep RNA Amplification Kit (Ambion, Life Technologies) according to the manufacturer's protocol. Briefly, RNA was reverse transcribed to yield cDNA which was subjected to second strand synthesis. In vitro transcription of cDNA with biotin-dUTP was then performed overnight to yield labelled cRNA. Biotinylated cRNA (750 ng) was hybridized overnight at 58°C to HumanHT-12 v4 Expression BeadChip arrays (Illumina) followed by labelling with Cy3-conjugated streptavidin. Slides were then scanned with an iScan microarray scanner (Illumina), and raw intensity values were further processed with GenomeStudio software vers. 1.9.0. The microarray chip contains 47 323 probes, targeting approximately 31 000 genes. A total of 21 242 probes were detected in all three replicates. After quality control, arrays were preprocessed using R software version 3.0.2 (http://www.r-project.org). Data were normalized using quantile normalization and logarithm. A linear model was fitted to the normalized data resulting in one normalized intensity value per probe and chip. Probes were regarded as being significantly differentially expressed when they showed an absolute fold change of larger than 1.5 between at least two different conditions and a FDR adjusted t-test P-value of less than 0.05. Probes measuring the same gene were summarized by calculating their mean expression. Enrichment analysis of biological pathways was applied using the most recent KEGG PATHWAY annotation, which is available on the KEGG website (www.genome.jp/kegg). The downloaded annotation files were processed using routines of the Bioconductor package KEGGgraph. Significantly enriched pathways were identified in the set of differentially expressed genes relative to a background gene set (all annotated genes on the microarray). KEGG pathways with a significant P-value (Fisher exact test) were extracted for further analysis.
Quantitative RT-PCR
Quantitative real-time PCR was performed with 50 ng total RNA using Brilliant III Ultra-Fast SYBR Green QRT-PCR Master Mix (Agilent Technologies) and QuantiTect Primer Assay oligonucleotides (Qiagen) including the reference dye on a Stratagene Mx3500P cycler. Gene expression was normalized to GAPDH transcript as housekeeping gene. Fold changes of gene expression were calculated using the 2−∆∆CT method (Livak and Schmittgen, 2001).
TransAM ELISA
DNA binding activity of NF-κB transcription factors was assessed with TransAM ELISA kit (Active Motif). Samples were processed according to the manufacturer's instruction. In brief, cells were washed once with PBS containing phosphatase inhibitor, then subjected to hypotonic lysis. Nuclei were pelleted by centrifugation and subsequently lysed. Nuclear extracts were quantified using reducing agent compatible BCA protein assay (Thermo Scientific). Equal amounts of nuclear proteins were used in the assay.
Network inference
Network inference was carried out with NetGenerator V2.0 (Weber et al., 2013). In the first step, genes to be included in the model were selected based on microarray data (fold change ≥ 2, adj. P-value ≤ 0.05) and their affiliation to the KEGG MAPK and NFκB signalling pathways. Transcription factor NF-κB and its inhibitor NFKBIA were modelled as a NF-κB/NFKBIA complex based on the gene expression values of NFKBIA. Prior knowledge from additional data sources and/or literature was integrated to guide the network inference to a knowledge-driven solution. Three sources of prior knowledge were used for modelling interactions: (i) regulatory relationships automatically extracted from literature by PathwayStudio V9.0 (Nikitin et al., 2003), (ii) potential AP-1 and NF-κB TFBSs predicted by oPOSSUM V3.0 (Kwon et al., 2012), and (iii) MAPK and NF-κB signalling pathway interactions from KEGG database (Kanehisa et al., 2012). Prior knowledge was softly integrated into the mathematical model, i.e. knowledge which does not fit to the measured data might be removed and additional edges not present in the prior knowledge might be added. The standard NetGenerator approach was augmented by testing whether predicted interactions were robust against Gaussian noise (mean = 0, sd = 0.01, 1000 iterations) (Linde et al., 2010).
Microarray data
Microarray raw data are available at ArrayExpress (https://www.ebi.ac.uk/arrayexpress) under accession no. E-MTAB-3341.
Statistical analysis
Data were analyzed with GraphPad Prism software version 6 using two-tailed t-test. A P-value of <0.05 was regarded as significant.
Acknowledgements
We thank Markus Bläss for microarray scanning and raw data processing. Cindy Reichmann contributed to this study with expert technical assistance. Our work was supported by the German Ministry for Education and Science in the programme ‘Unternehmen Region’ (BMBF 03Z2JN21 to OK). JL and SS were supported by the Deutsche Forschungsgemeinschaft (DFG) CRC/Transregio 124 ‘Pathogenic fungi and their human host: Networks of interaction’, subproject INF (JL) and subproject B3 (SS).t
Competing interests
The authors declare that they have no competing interests.


