A Comparative Study on the Accuracy of Implant Placement Using 3D-Printed and Milled Guides Without Metal Sleeves
ABSTRACT
Purpose
The present study aims to evaluate whether differences in accuracy of the implant positions exist for static computer-aided implant placement based on the manufacturing process of surgical guides and the inclusion or not of metal sleeves.
Methods
Seventy-two implants (6 per model) were placed in 12 models simulating a partially edentulous maxilla using 12 dentally supported surgical guides anchored with 2 anchor pins. The surgical guides were divided into three groups: additive manufactured with a metal sleeve (Group PS), additive manufactured without a metal sleeve (Group PNS), and subtractive manufactured without a metal sleeve (Group MNS). The internal drilling diameter was standardized for all groups (4.85 mm). Deviations between the planned virtual implant positions and the scanned postoperative models were assessed in three parameters: 3D deviations at the crest, 3D deviations at the apex, and angular deviations in the implant insertion axis. The Shapiro–Wilk test was applied to analyze the normality of the sample distribution. Kruskal–Wallis and Mann–Whitney tests were used to analyze the deviations among the groups (α = 0.05).
Results
Statistical differences were reported among the groups in the parameters: 3D deviations at the crest, 3D deviations at the apex, and angular deviations in the implant insertion axis (p < 0.05). At the crest, the smallest 3D deviation was recorded in the MNS group (0.498 ± 0.337 mm) followed by the PNS group (0.660 ± 0.572 mm) and the PS group (1.028 ± 0.424 mm) (p < 0.05). At the apex, as well, the lowest deviation was observed in the MNS group (0.810 ± 0.544 mm) followed by the PNS group (0.840 ± 0.620) and the PS group (1.360 ± 0.990 mm) (p < 0.05). Regarding angular deviations, the best results were obtained by the PNS group (1.44° ± 1.57°) with statistically significant differences with both the MNS group (2.90° ± 2.35°) and the PS group (3.88° ± 2.85°) (p < 0.05).
Conclusions
The accuracy of the implant position was affected by the inclusion or absence of metal sleeves and the manufacturing method. Overall, non-sleeved guides deliver better accuracy by reducing crestal and apical deviations, as well as angular errors. Differences between the groups without metal sleeves, 3D printed and milled, were found in the implant angulation, where the 3D printed group obtained more accurate results.
1 Introduction
The adoption of digital workflows in dentistry has increased significantly, with static computer-aided implant placement gaining popularity and gradually replacing traditional freehand implant placement, especially in complex cases [1-7]. The introduction of intraoral scanners (IOSs) represented a significant advancement, enabling the direct digital capture of intraoral structures, including implant positions, and offering substantial advantages over previous methods, such as analog impressions, stone casts, and extraoral scanners [8].
Two types of files are necessary for the digital planning of surgical implant placement. IOSs generate digital files in STL format (Standard Tessellation Language). On the other hand, CBCT (Cone Beam Computed Tomography) scanners produce high-resolution 3D images of bone structures in DICOM (Digital Imaging and Communication in Medicine) format [9]. By considering bone availability and anatomical structures, this approach helps determine the optimal implant placement for prostheses. As a result, static computer-aided implant placement has been shown to offer greater accuracy and predictability than the freehand technique [4].
Static computer-aided implant placement software programs provide clinicians with all the necessary information for designing surgical guides for implant placement [10]. These programs facilitate prosthetically guided surgeries by enabling the virtual design of final restorations, offering key advantages. This approach minimizes both biological and mechanical complications, making surgeries safer and less invasive [11]. The rise of immediate implantology further highlights its value, as placing implants at the time of the extraction can reduce the need for flap surgery and help preserve the alveolar ridge [12, 13] When combined with static computer-aided implant placement, this approach also allows for optimal 3D positioning of the implant [14-18] Nevertheless, the accuracy of implant placement in guided implant surgery is influenced by multiple factors, including the type of guidance technique, the design of the surgical guides (whether dental, mucosal, or bone-supported), and whether the procedure is performed with or without a surgical flap [14-18]. In addition, data acquisition, processing, and alignment methods, along with factors such as guide movement during surgery and the operator's experience level, significantly contribute to the overall accuracy [18].
The potential impact of inaccuracies in challenging cases could lead to treatment failures, such as implant displacement outside the bone framework. This becomes more critical with the trend toward immediate implant placement and loading. In these procedures, precise 3D positioning and primary stability are essential for success [19, 20]. Given the potential deviations, maintaining a safety margin during implant planning is essential when considering potential deviations during implant placement [18, 21, 22]. The objective is to avoid damage to adjacent structures and ensure that the implant position is located inside the bone anatomical contour. This margin is typically established in 1–2 mm horizontally and vertically around the implant and about 5° in the implant axis angle [21, 22].
Surgical guides can be fabricated by subtractive (milling) or additive (3D printing) techniques. The choice between 3D printers and milling machines, as well as the materials used, may affect the overall characteristics of the surgical guides. However, the existing literature on the accuracy of implant positions in static computer-aided implant placement, based on the manufacturing method of the guide, is scarce [23-30].
Traditionally, the guides employed in static computer-aided implant placement have included metal sleeves. Nevertheless, the potential gain or loss in accuracy when using or omitting them on the surgical guide should also be considered. This relates to the debate about the tolerance of metal components, such as drills, sleeves, and implant drivers, in the milling system [31-40].
The aim of this study is to assess whether significant differences exist in the accuracy of implant placement when using surgical guides based on the method of fabrication (milling or 3D printing) and the presence or absence of metal sleeves in the milling hole. The null hypothesis was that there are no significant differences in implant positioning accuracy between guides fabricated by 3D printing or milling, nor between the use or absence of metal sleeves.
2 Materials and Methods
2.1 Study Design
This in vitro study was conducted following the checklist for reporting in vitro study (CRIS guidelines), simulating a partially edentulous clinical scenario with 12 printed models in which 72 implant placements were prospectively analyzed.
2.2 Surgical Planning for Implant Placement and Guide Fabrication
A CBCT scan (CS 9300; Carestream, Rochester, NY, USA) and a digital intraoral scan (Trios 5 v 23.1.4 (2.18.0.2); 3Shape, Copenhagen, Denmark) from a partially edentulous patient were obtained. Both files were imported to a static computer-aided implant placement software (Implant Studio, 3Shape v 23.1.4 (2.18.0.2), Copenhagen, Denmark), where they were aligned by using the software's specific tools. Then, a virtual implant planning was conducted. Implant positions were planned by an experienced operator (8 years of experience in software planning and implant static computer-aided implant placement), considering both the bone availability and tooth positions of the future implant-supported prosthesis. The surgical guides for implant placement were designed based on this plan. A total of six tapered internal connection implants (3.75 mm in diameter, 11.5 mm in length) (Spiral implants; Alpha Bio Tec, Petah Tikva, Israel) were selected from the software library and planned for the following positions: right canine, first right premolar, second right premolar, left canine, first left premolar, and second left premolar. This process created the virtual reference model (VRM), including the planned implant positions.
Based on this planning, two types of surgical guides were digitally designed, with identical implant and anchor pin positions, differing only in the presence or absence of a metal sleeve in the drilling area. The first design included a digital space in each drilling hole, accounting for the posterior inclusion of a prefabricated metal sleeve. It was employed to manufacture the surgical guides corresponding to the group additive manufactured guide with metal sleeves. In the second design, space for the metal sleeve was digitally removed, and a cylindrical hole with the same diameter as the sleeves (4.85 mm) was created. This design was employed for the fabrication of the guide corresponding to the groups without sleeves, by additive and subtractive techniques.
2.3 Model and Guide Fabrication
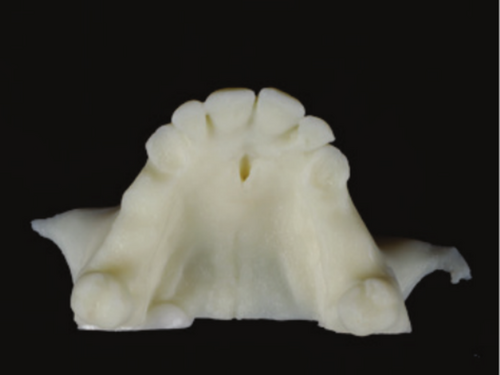
Twelve printed models were manufactured by using a 3D fused filament printer (Up Box Plus Tiertime; Beijing, China). A medical-grade ABS material (Smart Material 3D; Jaén, Spain) indicated for the manufacturing of models was employed (Figure 1). Each model received six implants (N = 72). The manufactured 12 surgical guides were divided into three groups according to their manufacturing technique and the inclusion or not of metal sleeves: PS group: additive manufactured guide with metal sleeves; PNS group: additive manufactured guide without metal sleeves; MNS group: subtractive manufactured guide without metal sleeves.
Additive manufactured surgical guides were fabricated by using a DLP 3D printer (Sprint Ray Pro 55; Los Angeles, CA, USA) with a 55-μm layer size. The guide's thickness was 3 mm, the sleeve's offset was 0.20 mm, and the offset to teeth and model was 0.20 mm. A specific material indicated for fabricating surgical guides was employed (Surgical Guide 3 resin, Sprint Ray Los Angeles, CA, USA) (Figure 2A,B). For the subtractive manufactured surgical guides, a 5-axis milling machine was used (Imes Core GmbH 150 Pro milling machine; Eiterfeld, Germany). Transparent polymethyl methacrylate (PMMA) discs (Anaxdent Clear; Eiterfeld, Germany) were used for guide fabrication (Figure 2C).

In the group with sleeves, PS, once the guides were manufactured, a 4.85 mm diameter metal sleeve (DAS sleeve; Dynamic Abutment System; Lérida, Spain) was placed in each hole. Each sleeve was positioned and cemented using the same resin (Surgical Guide 3 resin, Sprint Ray Los Angeles, CA, USA). A minimal quantity of resin was applied to the external surface of the sleeve using a syringe. The sleeve was then inserted into the hole, and the resin was photo-polymerized using a photocuring lamp (Procure, Sprint Ray; Los Angeles, CA, USA).
2.4 Sample Size Calculation
The sample size was calculated using Granmo software (Datarus v.8. Regicor; Gironí del Cor). An independence test was applied for three groups, with 80% statistical power, α = 0.05, and a minimum detectable difference of 0.5 between groups. This value was based on differences observed in preliminary data from the study population. The required minimum sample size was 21 subjects per group; however, 24 subjects were allocated to each group. The analysis assumed a common standard deviation of 0.5 and a follow-up loss rate of 0%.
Twelve printed surgical models were assigned to three main groups: PS, PNS, and MNS. Each model received six implants (n = 6), resulting in a total of 24 implants per group (PS: n = 24, PNS: n = 24, MNS: n = 24), for a total of 72 implants (N = 72).
2.5 Surgical Protocol and Implant Placement
Models and surgical guides were first examined for manufacturing defects. The fit of each surgical guide on the models was then evaluated visually, and alternative finger pressure was applied to ensure stability and the absence of oscillation in the seated position (Figure 3A–C).

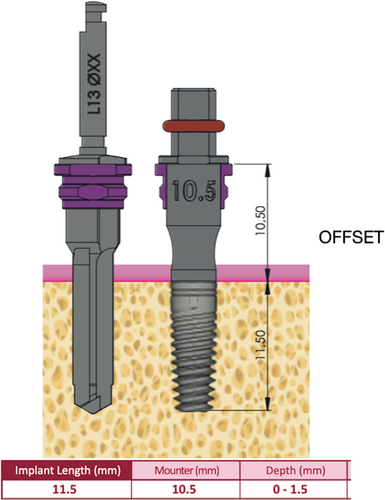
The drilling procedure was performed employing a universal static computer-aided implant placement kit (Dynamic Abutment System; Lérida, Spain). The kit included compatible implant drivers and metal sleeves for guided procedures. Implant placement followed a standardized surgical drilling sequence. The drilling varied depending on the elements incorporated in the surgical guides. In the PS group, the elements involved were the drill, sleeve, and 3D-printed guide. The PNS group lacked sleeves, so only the drill and the 3D-printed guide were used. Similarly, in the MNS group, the elements involved were the drill and the milled guide, without the presence of a sleeve (Figure 4A–C). Osteotomy was initiated with a pilot drill and completed using sequential drills with their corresponding drill handles/spoons with depth stops to ensure accuracy, all performed with the surgical guide in position. After completing the drilling sequence, implants were inserted using a driver designed for a 10.5 mm offset height (Figure 5). All the procedure was performed by the same operator with experience (8 years) in static computer-aided implant placement, ensuring intra-calibration and adherence to a standardized protocol.

2.6 Digital Alignment of Virtual Models
After implant placement, an implant scan body (ISB) (IH Alpha Bio, Alpha Bio Tec, Petah Tikva, Israel) was screwed onto each implant at 10 N cm using a torque wrench (Alpha Bio, Alpha Bio Tec, Petah Tikva, Israel). The models were digitized using a desktop scanner (E4; 3Shape; Copenhagen, Denmark) with a manufacturer-reported accuracy of 4 μm, generating STL files. On the digitized surface of each ISB, a geometrically perfect virtual analog from the software library was aligned using the best-fit algorithm (ExoCAD v.3.1, Rijeka, Tempe, AZ, USA). A digital implant analog was then virtually connected to determine the implant position. This procedure was repeated for all implants in each model, obtaining the virtual test models (VTM).
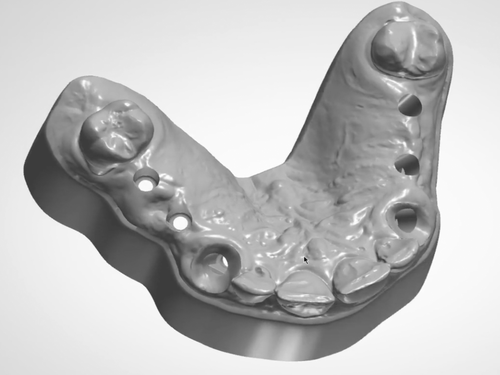
The implant position on each definitive VTM was compared with those in the VRM (virtual reference model) of the digital implant planning. For this purpose, the first step was to connect a virtual ISB on the implants of the original scan (OS). First, six holes were virtually designed in the implant locations of the OS by using a software program (Figure 6). Then, a virtual implant analog was placed following the original planning. Subsequently, a virtual scan body was digitally positioned on each virtual implant analog using the implant planning software (Dental System v 2.24.1.1; Copenhagen, Denmark).
2.7 Evaluation of Implant Position Deviations
2.7.1 Alignment of Models and Comparison
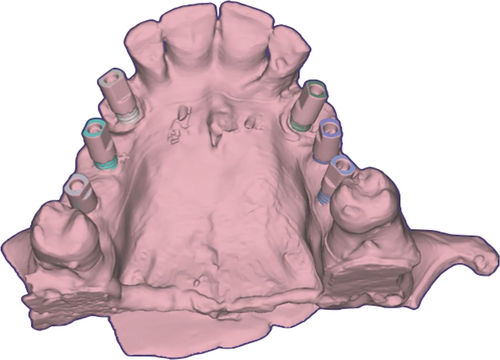
A CAD dental software program (ExoCAD v.3.1, Rijeka, Tempe, AZ, USA) was used to align the VRM with each VTM. The alignment was performed by best-fit using the corresponding software tools, selecting areas of the virtual ISBs of both files (Figure 7). Once the STL containing the implant replicas and scan bodies was obtained, the scan bodies were removed, as they were no longer required.
Then, the aligned files were imported into a CAD software program (CAD-3D; SolidWorks v 2025.Sp.0.0, Waltham, MA, USA) for analysis. The analysis included three types of deviations: Linear deviations along the XYZ axes, 3D deviations at the crestal and apical levels, and angular deviations in the implant insertion axis (Figure 8). This method allowed precise evaluation of differences between the planned and actual implant positions (Figure 9A). All the alignment and measurement procedures were performed by an experimented operator, ensuring intra-calibration. Repeated measurements were performed to ensure consistency in the procedures.
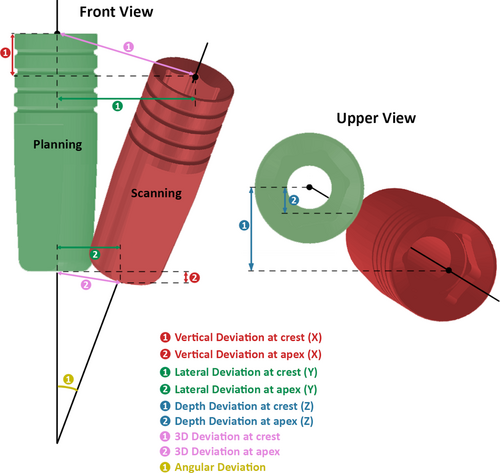
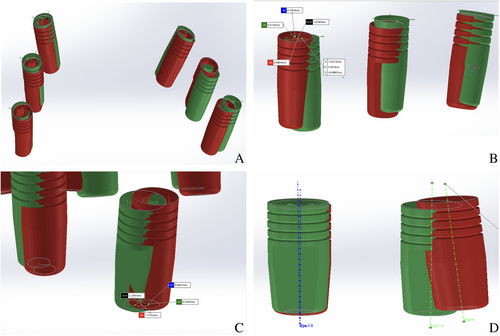
For the crestal deviation, the geometrical center of the implant at its most coronal point (Crestal Geometrical Center [CGC]) was identified. The implant's circumference was selected using the software, which automatically determined its center. A measurement tool was used to mark at CGC in both the VRM and VTM, allowing for the calculation of differences in the XYZ axes and the 3D deviation at the crestal level (Figure 9B).
The same procedure was repeated at the apical level, identifying the Apical Geometrical Center (AGC). The measurement tool was used to mark the AGC in both models, providing differences in the XYZ axes and the 3D deviation at the apical level (Figure 9C).
Angular deviation was assessed by determining the implant axis using the software's tools. A straight line was generated connecting the CGC and AGC. The measurement tool was then used to calculate the angular difference between the planned and actual implant axes (Figure 9D).
2.8 Statistical Analysis
A descriptive and graphical analysis of the main variables was conducted. All tests were performed at a 95% confidence level (SPSS v. 29.0; IBM). The Shapiro–Wilk test was applied to analyze the normality of the sample distribution. To test for independence, statistical tests were used to determine if the main variables were independent of certain factors. As normality was not met (p > 0.05), nonparametric tests were used. The Mann–Whitney test identified significant differences between groups. The Kruskal–Wallis test was used for comparisons across multiple groups. A p < 0.05 indicated a statistically significant difference between groups, with 95% confidence.
3 Results
3.1 Overall 3D Deviations
The overall 3D crestal and apical deviations, including all the groups, were 0.720 mm (IQR: 0.551 mm) and 0.925 mm (IQR = 0.721 mm), respectively. The mean angular deviation was 2558° (IQR = 2.8°).
3.2 Crestal Deviations
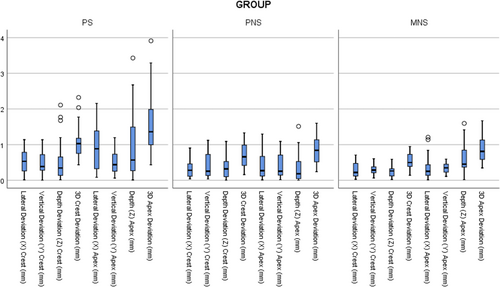
At the crestal level, significant differences were observed in the 3D deviation between the groups (p = 0.000). The PS group exhibited the highest 3D deviation (median = 1.028 mm; IQR = 0.424 mm) with significant differences with both PNS (median = 0.660 mm; IQR = 0.572 mm) (p = 0.050) and MNS groups (median = 0.498 mm; IQR = 0.337 mm) (p = 0.000). When analyzing the deviations in the three axes, statistical significance was reported in lateral deviation (X) (p = 0.012). The PS group showed the highest deviation (median = 0.533 mm; IQR = 0.524 mm), with statistically significant differences with both PNS (median = 0.281 mm; IQR = 0.347 mm) (p = 0.018) and MNS (median = 0.221 mm; IQR = 0.353 mm) groups (p = 0.004). No significant differences were found in vertical and depth deviations (Y and Z) at the crest (Table 1; Figure 10).
| PS | PNS | MNS | Kruskal–Wallis p | Mann–Whitney test | |||||
|---|---|---|---|---|---|---|---|---|---|
| Median | IQR | Median | IQR | Median | IQR | ||||
| Crestal deviations (mm) | 3D Crest deviation | 1.028 | 0.424 | 0.660 | 0.572 | 0.498 | 0.337 | 0.000* | (PS–PNS: p = 0.050) |
| (PS–PNS: p = 0.000) | |||||||||
| Lateral deviation (X) crest | 0.533 | 0.524 | 0.281 | 0.347 | 0.221 | 0.353 | 0.012* | (PS–PNS: p = 0.180) | |
| (PS–PNS: p = 0.040) | |||||||||
| Vertical deviation (Y) crest | 0.384 | 0.438 | 0.256 | 0.591 | 0.288 | 0.166 | 0.112 | ||
| Depth deviation (Z) crest | 0.345 | 0.515 | 0.320 | 0.424 | 0.262 | 0.201 | 0.194 | ||
| Apical deviations (mm) | 3D Apex deviation | 1.360 | 0.990 | 0.840 | 0.62 | 0.810 | 0.544 | 0.000* | (PS–PNS: p = 0.000) |
| (PS–PNS: p = 0.000) | |||||||||
| Lateral deviation (X) apex | 0.884 | 1.060 | 0.271 | 0.549 | 0.252 | 0.259 | 0.001* | (PS–PNS: p = 0.001) | |
| (PS–PNS: p = 0.000) | |||||||||
| Vertical deviation (Y) apex | 0.438 | 0.475 | 0.257 | 0.562 | 0.349 | 0.221 | 0.226 | ||
| Depth (Z) apex | 0.568 | 1.225 | 0.182 | 0.482 | 0.453 | 0.478 | 0.013* | (PS–PNS: p = 0.007) | |
| Angular deviations (°) | Angular deviation | 3.883 | 2.850 | 1.442 | 1.567 | 2.900 | 2.350 | 0.000* | (PS–PNS: p = 0.000) |
| (PNS–MNS: p = 0.022) | |||||||||
- Abbreviations: IQR, interquartile range; MNS, subtractive manufactured without metal sleeve; PNS, additive manufactured without metal sleeve; PS, additive manufactured with metal sleeve.
- * p < 0.05 indicates statistical significance.
3.3 Apical Deviations
At the apical level, the Kruskal–Wallis test reported statistical significance (p = 0.000). The Mann–Whitney test showed that, as in the crestal 3D deviation, the differences appeared between the groups without sleeves (MNS: median = 0.810 mm; IQR = 0.544 mm; PNS: median = 0.840 mm; IQR = 0.62 mm) and the group with sleeves, showing higher deviations in this group (PS: median = 1.360 mm; IQR = 0.99 mm) (p = 0.000).
When analyzing the deviations along the three axes, statistical significance was found in both lateral (X) and depth (Z) deviations (X: p = 0.001; Z: p = 0.013). The PS group exhibited the highest lateral deviation (X) (PS: median = 0.884 mm; IQR = 1.06 mm), with significant differences between the PS and both the PNS (X: median = 0.271 mm; IQR = 0.549 mm) (p = 0.001) and MNS (X: median = 0.252 mm; IQR = 0.259 mm) (p = 0.000) groups.
For depth deviations (Z), the PNS group showed the lowest deviations (PNS: median = 0.182 mm; IQR = 0.482), with significant differences between the PS (median = 0.568 mm; IQR = 1.225 mm) (p = 0.007). No significant differences were found in vertical deviations (Y) at the apex (Table 1; Figure 10).
3.4 Angular Deviations
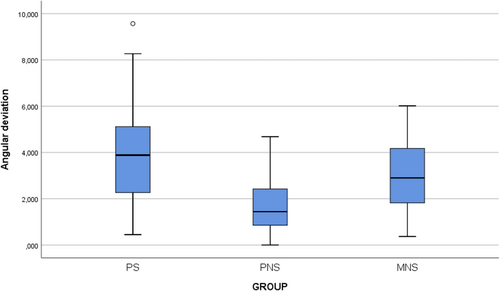
The Kruskal–Wallis test detected statistically significant differences among the groups (p = 0.000). Subsequent Mann–Whitney test reported significant differences between the groups (p > 0.05).
The PNS showed the lowest mean angular deviation (median = 1.442°; IQR = 1.567°) with statistically significant differences with the other groups: MNS group (median = 2.90°; IQR = 2.35°) (p = 0.022) and PS group (3.883° ± 2.85°) (p = 0.000). These results suggest that the absence of a sleeve improves angular accuracy (Table 1; Figure 11).
4 Discussion
The present study aims to evaluate the accuracy of implant positioning in fully static computer-aided implant placement by analyzing the influence of metal sleeves and different production techniques (3D printing and milling). Overall, the findings of this study demonstrate that the accuracy of implant positioning in fully static computer-aided implant placement is affected by both the presence or absence of metal sleeves and the guide production technique. The null hypothesis was rejected, as significant differences were observed between the groups. In particular, sleeve-free guides (PNS and MNS) showed superior accuracy compared to sleeve guides (PS) across multiple parameters, particularly in 3D deviations, lateral (X) deviations, and angular deviations. These results are in line with previous studies that suggest that eliminating the metal sleeve in guides may enhance surgical accuracy by removing the gap between the guide, drill, and sleeve. By reducing the interface to only one gap between the drill and guide, better results may be expected [26, 31, 32]. With respect to the manufacturing technique, the only parameters that reported differences were angular deviation, reporting the PNS group higher accuracy than the MNS group, while no significant differences were found between the PNS and MNS groups.
The greatest deviations were observed in the PS group in all parameters: 3D crestal deviations (median = 1.028 mm; IQR = 0.424 mm), 3D apical deviations (median = 1.36 mm. IQR = 0.990 mm), and angular deviations (median = 3.883°; IQR = 2.85°). The linear deviations were especially observed in the X-axis at both the crestal (median = 0.533 mm) and apical (median = 0.884 mm) levels. These findings suggest that printed guides with metal sleeves exhibit the lowest accuracy. In contrast, the PNS and MSN groups reported similar results, unless the PNS showed higher accuracy in angular deviations (median = 1.442°; IQR = 1.567° vs. median = 2.90°; IQR = 2.350°).
To the authors' knowledge, only two previous studies have evaluated the employment of surgical guides without metal sleeves [26, 38]. Tallerico et al. observed different results than those obtained in the present study, with greater deviations in implants placed with guides featuring metal sleeves (0.52 ± 0.30 mm; 0.61 ± 0.49 mm), though without statistically significant differences [26]. These variations may be attributed to factors such as the stability of the surgical guide, the operator's experience, and anatomical considerations. While guides with metal sleeves can improve drilling control, they may also introduce tolerances that increase deviation if the guide does not fit properly. In addition, the manufacturing procedures for both additive and subtractive techniques are continuously evolving, and the ones employed in the present study are newer. At last, differences in measurement methodologies may also contribute to explaining discrepancies between studies [25]. Adams et al. obtained results comparable to the present study, with greater deviations in implants placed with guides featuring metal sleeves than those placed without sleeve-free guides (−0.30 ± 0.17 vs. −0.17 ± 0.14 mm) [38].
Regarding apical deviations, the results are also similar to those reported previously [26, 38], which observed greater apical deviations in implants placed with guides with metal sleeves than those placed with sleeve-free guides. However, in the study by Adams et al., these differences were not statistically significant (p = 0.691). The findings suggest that the presence of metal sleeves may influence the magnitude of apical deviation, possibly due to variations in the fit of the drill within the sleeve or restrictions in the drilling trajectory [37].
Concerning angular deviations, significant differences were found between the groups (PS: median = 3.883°; IQR = 2.85°; PNS: median = 1.442°; IQR = 1.567°; MNS: median = 2.90°; IQR = 0.35°) (p < 0.05), with the PNS group showing significantly lower deviations than both the MNS (p = 0.022) and PS (p = 0.000) groups, which is consistent with previous studies. It is suggested that the absence of metal sleeves may improve angular accuracy, possibly due to the manufacturing technology of the guides, which optimizes their stability during drilling [23, 24, 28-30, 39].
In general, the results suggest that sleeve-free printed guides offer greater accuracy in implant placement compared to those with metal sleeves, reducing both angular and lateral deviations. In terms of fabrication methods, previous studies have not definitively determined results regarding the accuracy of surgical guides produced using additive (3D printing) and subtractive (milling) techniques. Henprasert et al. found no significant differences between both methods, reporting comparable deviations in implant positioning (buccolingual angular deviation of 1.60° ± 1.22° for printed guides vs. 1.77° ± 0.76° for milled guides) [23]. In contrast, Lo Russo et al. observed statistically significant differences, with milled guides reporting lower deviations in specific parameters, such as axial deviation (0.82° vs. 1.37° for printed guides) [29]. The present study shows differences between fabrication methods, specifically in angular deviations, reporting higher accuracy in the PNS group than in the MNS group (PNS: median = 1.442°; IQR = 1.567°; MNS: median = 2.90°; IQR = 0.35°) (p < 0.05). These disparities between the studies' results could be caused by manufacturing accuracy, guide stability, and study-specific methodology variability. An issue to be considered when using sleeveless guides is the material loss. This may lead to the presence of plastic particles in the surgical site due to wear of the guide material during drilling and, consequently, to deviations. Nevertheless, the evidence about the amount of material loss and its clinical relevance is scarce [41].
Several limitations should be addressed. The present study did not assess the potential impact of drilling characteristics—such as variations in speed, depth, or cooling methods—on accuracy. It also did not examine the effects of repeated drilling on sleeve-free guides or the influence of material wear. In addition, different manufacturing methods, metal sleeve models, and operator's skill or experience may influence the obtained results, so the present conclusions must be carefully extrapolated. Finally, the guide's storage conditions under different temperature and humidity levels may produce fluctuations in resin stability.
While the findings of this study provide valuable insights, several areas warrant further investigation to enhance the accuracy of static computer-aided implant placement. Further evaluation of the surgical safety implications involves understanding how resin debris affects bone tissue and potential biocompatibility risks for all types of surgical guides, with or without metal sleeves, and additive or subtractive manufactured. At last, further well designed clinical studies are needed to probe the obtained in vitro results.
5 Conclusions
Within the limitations of this study, it can be concluded that:
The manufacturing technique of surgical guides and the presence or absence of a metal sleeve influence the accuracy of the implant position in comparison with the planned one.
The position of implants placed using sleeve-free surgical guides was more accurate than that placed with guides featuring metal sleeves, especially in terms of 3D deviations at the implant crest and apex. No differences were observed between printed and milled sleeve-free guides in terms of 3D deviations at the crest and apex.
Angular deviations were reduced in the printed sleeve-free group compared to the other groups, highlighting the potential benefits of this approach for angular accuracy.
Sleeve-free guides provided the most consistent results, with the printed sleeve-free guides performing better in angular deviation when compared to milled versions.
Conflicts of Interest
The authors declare no conflicts of interest.
Open Research
Data Availability Statement
The data that support the findings of this study are available on request from the corresponding author. The data are not publicly available due to privacy or ethical restrictions.


