Expression of visfatin in the diabetic rat retina
Abstract
Background
Visfatin has been found in adipose tissue, liver and kidney of healthy and diabetic people, with its expression being increased in the aforementioned tissues in diabetes. Based on the former researches, visfatin may exist in the retina and affect the development of diabetic retinopathy. The expression of visfatin in Sprague–Dawley rats' retina, which may carve a path to study the pathogenesis of diabetic retinopathy, was investigated by this study.
Methods
The mRNA and protein expression of visfatin in Sprague–Dawley rats' retina were detected by the reverse transcription-polymerase chain reaction (RT-PCR) and western blot. Immunohistochemical staining was applied to detect the expression location of visfatin in the rats' retinas.
Results
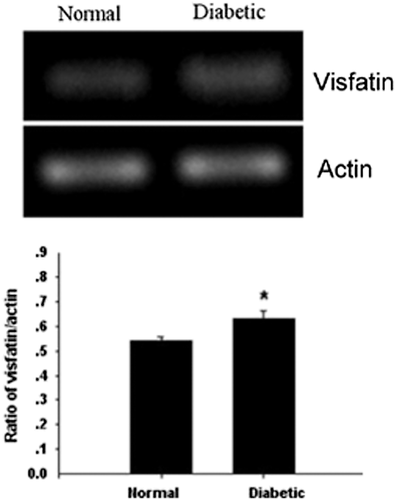
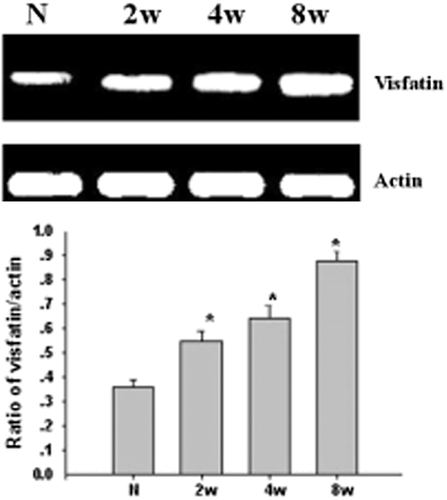
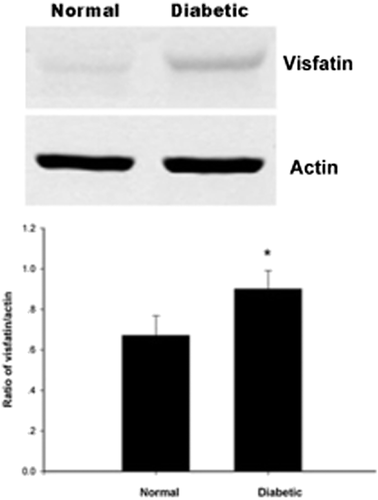
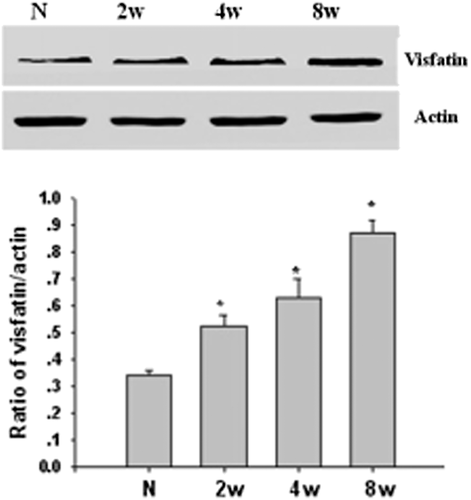
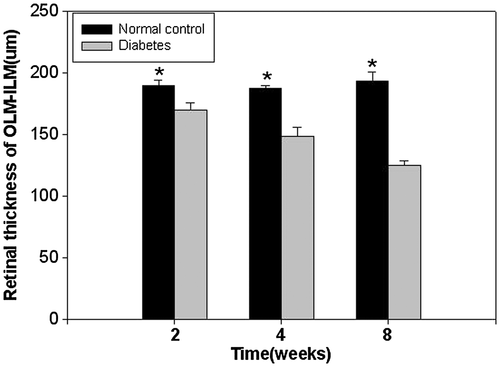
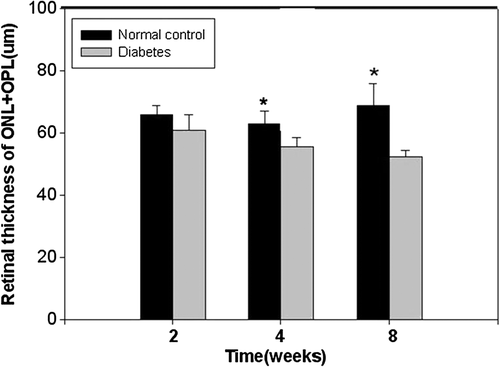
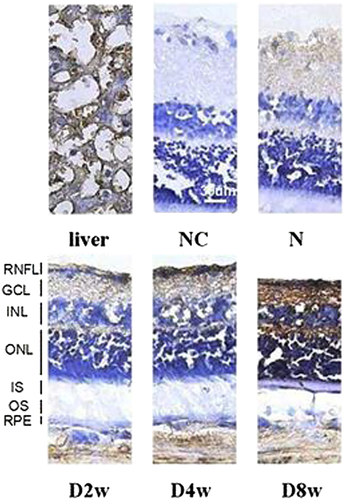
The mRNA and visfatin protein expressions in both normal and streptozocin-induced diabetic rats' retina increased significantly in 2 to 8 weeks of diabetes mellitus (DM). Compared with the normal control groups, the difference was statistically significant (P < 0.05). The histological examination showed that the retinal thickness decreased gradually over the course of DM and the decrease in the outer nuclear layer was the most obvious. At 4 and 8 weeks, the decrease in the retinal thickness was significant (P < 0.01). Visfatin was expressed in the retinal nerve fibre layer, inner plexiform layer and outer plexiform layer, and with the progression of DM, its expression was increased.
Conclusions
Visfatin was expressed in the rats' retinas, mainly in the retinal nerve fibre layer, inner plexiform layer and outer plexiform layer. As the development of DM course, its expression was gradually increased.
Introduction
Diabetic retinopathy (DR) is a chronic eye disease characterized by microaneurysm, hard exudate, retinal haemorrhage and neovascularization. Among these, neovascularization is the leading pathological change in DR, and it is also the most important cause of blindness. The pathogenesis of DR is very complicated. It is generally acknowledged that this is due to the impairment of the retinal blood vascular system. Recent data1 have supported the fact that there is direct communication between many kinds of histiocytes and the factors and formation of neovascularization.
Long-term hyperglycaemia is the basis of DR. Current research suggests that the hyperglycaemic condition affects the retinal microvascular structure through a series of mechanisms: polyol pathway hyperfunction,2 protein kinase-C activation3, 4 and the formation of advanced glycation end products.5, 6 A continuous condition of hyperglycaemia breaks the blood retinal barrier at an early stage, inducing the retina to ischaemia and anoxia. This condition disrupts the balance between the retinal angiogenesis factor and the inhibiting factor, inducing an increase in multiple vascular growth factors;7, 8 consequently, retinal neovascularization is formed.
There have been limited reports on the effective treatment for DR because of its complex mechanism. Some researchers9 have proven that the systematic therapies such as optimal glucose control, attainment of euglycaemia and hypertension control (if any) could also slow the progression of DR. Others reported10 that procedures such as laser treatment and vitrectomoy have the potential to alleviate the symptoms to some extent. However, those procedures are invasive and irreversible. Thus, finding less invasive procedures and effective medications specifically targeting the retina is the hot spots of the ophthalmic research in recent years.
Visfatin, also called nicotinamide phosphoribosyltransferase (Nampt), is a new adipocyte factor that has been found in recent years11 and is secreted by visceral fat. Its structure is the same as that of an immune system protein called the pre-B-cell enhancing factor, which is found in lymphocytes. The current research has reported that visfatin is expressed in the liver, lung, skeletal muscle, marrow, heart, brain, pancreas, paranephros, kidney and adipose tissue.12 It can reduce the blood glucose by combining with the insulin receptor (IR). It induces the phosphorylation of the IR, IR substrate-1 (IRS-1) and IR substrate-2 (IRS-2), activating protein kinase-B, mitogen and the protein kinase signal transduction pathway, which is the same as the insulin signal transduction pathway.13-16 As shown in receptor analysis dynamics, the visfatin–IR Kd is 4.4 nmol/L, which is close to the insulin–IR Kd of 6.1 nmol/L. The mutation of the N15K site of the IR gene can cause a change in the insulin affinity coefficient, but visfatin does not act on it. This suggests that there is a difference in the IR combination site between visfatin and insulin, but the specific binding domain is not clear.
We attempted to determine the expression of visfatin in Sprague–Dawley (SD) rats' retinas based on the following: in a cellular experiment,17 visfatin was found to induce phosphorylation of the IR, IRS-1 and IRS-2 tyrosine residues, which was considerably enhanced through intravenous treatment. In one clinical trial, Chen et al.18 found that the visfatin level in the plasma of type 2 diabetic patients was higher than that in the control group. The same results were seen in the experiment of López-Bermejo et al.19, where there was an independent negative correlation between the visfatin concentration in the plasma and the insulin secretion in the control group. All of the reports stated that visfatin could combine with the IR to a certain degree in diabetes mellitus (DM). Because IR also exists in the retina, we believe that visfatin might reduce the blood glucose and improve the retinal environment to protect the retina through its insulin-like function.
Methods
Experimental animals
The adult male SD rats used in this study were obtained from the Shanghai Laboratory Animal Centre (Shanghai, China), with an average weight of approximately 150 g. The use of these rats complied with the related rules about the ‘Instruction and Administration of Experimental Animals’ from the Tongji University School of Medicine, and the requirement about the use of experimental animals in ophthalmology from ‘The Association for Research in Vision and Ophthalmology’. The rats were fasted for 24 h before the experiment, and DM was induced by the intraperitoneal injection of streptozocin (60 mg/kg dissolved in the citric acid solution, pH 4.5). Those rats with glucose levels exceeding 250 mg/dl were defined as having DM. The same volume of citric acid solution was injected into the intraperitoneal of the rats in the control group. According to the course of DM, the 30 diabetic rats were divided into three groups: D2w, D4w and D8w. There were three normal control groups, and the age of the rats in each group was the same as in the experimental groups: N2w, N4w and N8w.
RNA extraction from the rats' retinal tissues
All of the reagents were purchased from the Huzhou Chemical Reagent Factory (Zhejiang, China). The visfatin kit was from Abcam (Shanghai, China), whereas the primer was designed and compounded by Sangon Biotech (Shanghai, China).
The rats were killed by the injection of a 2% pentobarbital solution (30 mg/kg) into the abdomen. Then, the rats' heads were removed at the neck, and the eyeballs were removed. The retina was quickly separated under the microscope, frozen in liquid nitrogen and preserved at −80 °C.
The Trizol method was used for the extraction of the RNA, in which the retinal tissue was put into a 1.5-ml centrifuge tube, mixed with 250 μL of Trizol and homogenized completely. The mixture was placed on ice for approximately 5 min to allow full denaturisation. It was then mixed with 0.2 ml of chloroform, oscillated for 15 s and allowed to stand for 3 min. In order to obtain the supernatant, the mixture was centrifuged at 4 °C, 12 000 g for 15 min. Isopropanol (0.5 mL) was added and blended, and it was allowed to stand at room temperature for about 10 min. The mixture was then centrifuged at 4 °C, 12 000 g for 10 min, and the supernatant was removed. Next, 1 mL of 75% ethanol was added, and the pellet was washed and precipitated, and centrifuged at 4 °C, 7500 g for 5 min. The supernatant was removed, most of the ethanol solution was absorbed, and the RNA was precipitated and air dried for 5–10 min. Finally, 40 μL of diethylpyrocarbonate (DEPC) H2O was used to cause complete RNA dissolution, and it was stored at −80 °C.
Measurement of RNA quality via ultraviolet absorption spectrometry
There is a maximum absorption peak at the 260 nm of wavelength for RNA; therefore, 260 nm was used to measure the RNA concentration. First, the spectrometer was preheated for approximately 10–20 min and zeroed using the DEPC solution. Some of the RNA was diluted by using DEPC (1:100), the absorption value was read at 260 and 280 nm, and the RNA solution's concentration and purity were measured. The RNA solution optical density (OD) 260 nm/OD 280 nm ratio was between 1.8 and 2.1 in our study.
Primer designation
The Primer Premier 5.0 software was used to design the primer, and it was compounded by Sangon Biotech (Shanghai, China).
| Primer | F/R | Sequence (5′–3′) | bp | Size (bp) | Annealing temperature |
|---|---|---|---|---|---|
| Beta actin | F | GTAAAGACCTCTATGCCAACA | 21 | 227 | 56 |
| R | GGACTCATCGTACTCCTGCT | 20 | |||
| Visfatin | F | AGCGGCAGAGCACAGTACCATA | 22 | 101 | 56 |
| R | CCACAGACACAGGCACTGATGA | 22 |
Reverse transcription
The total system consisted of 20 μL, with the following components in the polymerase chain reaction (PCR) tube: RNA template (4 μL), upstream primer (0.4 μL), downstream primer (0.4 μL), deoxy-ribonucleoside triphosphate (dNTP) (0.2 μL) and DEPC (10 μL). These reagents were blended, centrifuged at 6000 rpm, heated for 5 min at 70 °C, then taken out of the PCR tube and placed on ice. The inner and outer temperatures were determined to be the same; then, the following components were mixed: 5 × reverse transcription (RT) buffer (4 μL), moloney murine leukemia virus (MMLV) (1 μL). The total volume was 20 μL, and the mixture was blended and centrifuged at 6000 rpm and placed in a water bath for 60 min at 42 °C. The mixture was taken out of the tube and heated for 10 min at 95 °C (to destroy the MMLV), and the complementary deoxyribonucleic acid (cDNA) solution was preserved at 4 °C.
PCR reaction
The cDNA sample was placed in a 25-μL PCR reaction system with the following disposition: cDNA template (2 μL), upstream primer (1 μL), downstream primer (1 μL), ddH2O (8.5 μL) and 2 × mix (12.5 μL). The solution was blended by brief centrifugation at 6000 rpm; then, the solution was placed in a PCR reaction instrument for augmentation. The reaction parameters were as follows: predenaturation at 94 °C for 5 min; amplification at 94 °C for 30 s, 56 °C for 30 s, 72 °C for 30 s, in 33 cycles; and extension at 72 °C for 7 min. The PCR product was stored at 4 °C.
Electrophoresis of PCR
The compounding of a 0.5 × tetrabromoethane (TBE) buffer in 300 mL created a 5 × TBE solution that was diluted 10 times. This was concentrated in a 2% agar gel, which was made up of 0.8 g of agarose mixed in 40 mL of 0.5 × TBE. The solution was dissolved by using the microwave at moderate heat for 2 min. Then, the solution was cooled to 60 °C and mixed in 2 μL of ethidium bromide. It was strained, poured onto a board for solidification and loaded (8 μL of the PCR reaction product was mixed with 2 μL of bromophenol blue). Electrophoresis was performed with an electric current at 10 mA and a power of 100 V for approximately 10 min. The results were observed under ultraviolet light and scanned. The results were analysed using the Quantity One software (Bio-Rad, Shanghai, China).
Measurement of visfatin protein in the retinal tissue using the western blot
Before extracting the protein, 250 μL of lysis buffer was mixed in each tube (Radio Immunoprecipitation Assay (RIPA) : Phenylmethanesulfonyl fluoride (PMSF) = 100:1), homogenized and centrifuged at 4 °C, 20 000 g for 5 min. The supernatant was placed into a centrifuge tube, and the quantity of the protein was analysed using the bicinchoninic acid (BCA) method. Part of the liquid that was extracted from the retina was diluted approximately three times, mixed in the working fluid from the BCA and placed in a water bath for 30 min at 37 °C. The light absorption was read at 562 nm using a microplate reader, and the protein concentration of the sample was calculated using a standard curve. A moderate amount of the quadrupled protein sample was buffered in the liquid extracted from the retina, mixed well, heated for 10 min in hot water, cooled immediately in ice water and refrigerated at −80 °C, and finally, gel electrophoresis was conducted using sodium dodecyl sulphate (SDS)-polyacrylamide gel electrophoresis.
Sodium dodecyl sulphate-polyacrylamide gel electrophoresis
Water (H2O, 5.9 mL) was mixed with 5.0 mL of 30% acrylamide, 3.8 mL of 1.5 M Tris-HCl (pH 8.8), 0.15 mL of 10% SDS, 0.15 mL of 10% ammonium persulfate and 0.006 mL of tetramethylethylenediamine in a tube and blended well. The mixture was poured into a glass tank up to four fifths full; then, the gel was insulated from the air by using ultrapure water on the surface, which also made the surface smooth. When the gel became solidified, the water was poured off, and the gel was washed a second time with ultrapure water. The surface was dried using qualitative filter paper. Then, 4.1 mL of H2O was mixed with 1.0 mL of 30% acrylamide, 0.75 mL of 1.0 M Tris-HCl (pH 6.8), 0.06 mL of 10% SDS, 0.06 mL of 10% ammonium persulfate and 0.006 mL of tetramethylethylenediamine to compound the concentrated gel. The mixture was well blended and then poured into the glass tank. The sample was inserted and then removed when the gel cooled.
Protein sample loading for electrophoresis
The solution was pipetted into the electrophoresis tank, expelling the bubbles in the tank. The protein electrophoresis standard was mixed with the positive control and protein sample in the tank, at a loading amount of 40–60 µg. First, the electrophoresis was run for 30 min at an 80-V constant voltage. Then, the process was continued for 2 h, changing the voltage to 120 V. The power was turned off when the marker dye began to run out of the gel.
Transmembrane
The SDS-polyacrylamide gel electrophoresis gel, nitrocellulose membrane, qualitative filter paper and fibre mat were placed into the electrophoresis tank transfer solution, where the gel and nitrocellulose membrane were placed between the qualitative filter paper and the fibre mat. The gel was fixed, and the bubbles were cleared. Then, it was put into the transfer tank filled with the pipetted solution. The power was connected to the correct poles, and the protein gel was transferred to the nitrocellulose membrane using 300 mA for approximately 2 h.
Antibody labelling
The direction in the nitrocellulose membrane was labelled with protein; it was immersed in an antibody confining liquid and incubated for about 30 min in a shaker at room temperature to confine the nonspecific protein binding site (5% milk confining the visfatin). The nitrocellulose membrane was placed into an incubation buffer with the primary antibody (rabbit antivisfatin, Abcom, Cambridge, MA, USA) and left overnight at 4 °C. The membrane was washed for 15 min, three times in a shaker, by using the phosphate buffer solution tween (PBST) buffer. Then, the membrane was immersed into the secondary antibody (goat antirabbit, Sangon Biotech, Shanghai, China) incubation buffer with horseradish peroxidase, for 1 hour of incubation at room temperature. The membrane was washed again for 15 min, three times in a shaker, using the PBST buffer, and detected using the coloration method.
Coloration
For the chemiluminescence method, an x-film image was used to detect the site and contents of the relative protein. The image was scanned and inputted into a computer, using Quantity One to determine the quantitative analysis of the protein.
Expression of visfatin in the retina detected by immunohistochemistry (IHC)
The rats were killed using an injection of a 2% pentobarbital solution (30 mg/kg) into the abdomen, and the head was removed at the neck. Before removing the eyeball, the nasal and temporal directions were marked on it. It was then soaked for 24 h in 4% paraformaldehyde (phosphate buffer saline (PBS) buffered). The eyeball was dissected along the corneal limbus under a microscope, removing the anterior segment, after dehydration using the sucrose gradient method. The optical cutting temperature compound (Tissue Tek, Sakura, Japan) was used, freezing the microtome processed serial section to the optic nerve head (the thickness was 10 µm). After drying for 24 h at room temperature, the samples were preserved in a 4 °C refrigerator.
Immunohistochemical staining procedure20
The sample sections were taken out of the freezer and placed for 30 min at room temperature, immersed in acetone at 4 °C for about 10 min and washed for 5 min, three times using PBS. The samples were incubated for 10 min in 3% hydrogen peroxide to eliminate enzymatic activity and washed for 5 min, two times using PBS. Then, 5% goat serum (PBS dilution) was used to seal the samples, and they were incubated for 10 min at room temperature. The serum was removed (without washing), and they were dropped into the primary antibody (1:125 dilution), where they spent the night at 4 °C. The next day, the samples were washed for 5 min, three times using PBS, dropped into the secondary antibody that was marked with biotin (1:125 1% bovine serum albumin in phosphate buffered saline (BSA–PBS) dilution) and incubated for 20 min at 37 °C. The samples were washed for 5 min, three times using PBS, and dropped into streptavidin that was marked with horseradish peroxidase (PBS dilution), where they were incubated for 20 min at 37 °C. Finally, the samples were washed for 5 min, three times using PBS, placed into a colour developing agent ((3,3 N-Diaminobenzidine Tertrahydrochloride) Horseradish Peroxidase Color Development Kit (DAB) or 3-amino-9-ethylcarbazole (AEC)), fully washed using running water and dyed again; the film was sealed, and the images were taken.
Statistical analysis
All of the data were reported as the mean ± standard error of the mean. The t-test was used for the analysis of the distinction between the experimental group and the control group. P < 0.05 was considered to be statistically significant, and P < 0.01 was considered to be markedly statistically significant.
Results
mRNA of visfatin expressed in the rat retina by using RT-PCR
This study used the RT-PCR to detect the expression of visfatin in the rat retina, as well as the changes in the course of DM. From Figure 1, we could see that the expression of mRNA quantity increased in the D4w group (P < 0.05). From Figure 2, compared with the control group, the difference had statistical significance; additionally, from 2 to 8 weeks in the DM group, the expression increased with the progress of DM.
Visfatin protein expressed in the rat retina by using western blot
To detect the expression of visfatin protein in the retina, we used western blot in our study. From Figure 3, we could see that the expression of protein quantity increased in the D4w group (P < 0.05). From Figure 4, compared with the control group, the difference had statistical significance; the same as the expression of mRNA, from 2 to 8 weeks in the DM group, the expression increased with the progress of DM.
Expression of visfatin in the rat retina by IHC
In our study, the frozen sections were evaluated using immunohistochemical staining, and the thicknesses were observed under a microscope. The measurement distance was 1 mm away from the optic disc, on both sides, including the outer limiting membrane (OLM)–inner limiting membrane (ILM), OLM–ganglion cell layer (GCL), outer nuclear layer (ONL)–outer plexiform layer (OPL), inner nuclear layer (INL) and inner plexiform layer (IPL). There were five rats in every group and five retinal sections from each eyeball. As shown in the pictures, in the course of DM, the rats' retinal thicknesses gradually decreased, and the change in the ONL was the most obvious. For 4 and 8 weeks, the decrease in the retinal thickness was remarkable (P < 0.01). Visfatin was expressed in the retinal nerve fibre layer, IPL and OPL, and the expression increased with the progression of DM (Figs 5-8).

Discussion
As one kind of adipokine secreted by visceral adipokine, visfatin can combine with and activate the IRs' noninsulin combining site. This activates the IR signalling pathway and stimulates the peptide hormone with insulin functions, thereby promoting the transformation of adipokine, stopping the release of hepatic glycogen and maturing the smooth muscle cells, thus achieving the aim of reducing the blood glucose level and changing the insulin resistance. After the visfatin is combined with the IR, it can induce the phosphorylation of the IR, IRS-1 and IRS-2 tyrosine residues, activating protein kinase-B, mitogen and the protein kinase signal transduction pathway. This is the same as in the insulin signal transduction pathway, which plays the role of reducing the blood glucose in the liver, fat and kidney. Recent reports21 have shown that there is a close relationship between visfatin and DM and visfatin might play an important role in the course of the disease. The discovery of visfatin added new contents to the study of the mechanism of DM and might afford a new target for the treatment. In view of the amount of IRs,22 we speculated that visfatin might be expressed in the retina and protect the retinal tissue through the reduction of the blood glucose. To discuss the mechanism of visfatin in the retina, it is necessary to study the expression of mRNA and the proteins in the retinal tissue, especially the relationship of visfatin and the course of DR.
Our study used a course of 2 months in the DM rats (there was no significant ischaemia at this stage) to research the change in visfatin in the retina and whether it was expressed in the retina, and the mechanism of DR. The results showed that it was expressed in both the mRNA and the protein in the SD rats' retinas. When compared with the normal group, the expression in the DM group exceeded that of the normal group, and the difference was statistically significant (P < 0.05). We suspected that there was some degree of relationship between the high expression of visfatin and the course of the disease. This was similar to previous studies; for example, Chen et al.18 observed the visfatin level in the plasma of 61 type 2 diabetic patients and 59 healthy controls and found that the visfatin level increased in the type 2 diabetic group. The multivariate regression equation hinted that there was an independent relationship between the visfatin and the disease. Dogru et al.23 measured the plasma visfatin level in type 2 diabetic patients (impaired glucose tolerance and healthy individuals), in which there was no hypertension or fatty disease in three groups. They found that the visfatin level was higher in the DM group and there was no relationship with the body mass index. They believed that hyperglycaemia induced an increase in visfatin, which increased obviously with the rise in the blood glucose. Additionally, López-Bermejo et al.19 reported that there was a relationship between the visfatin level and the insulin produced in non-DM circulation; however, there was no relationship with the insulin sensibility, so they concluded that the visfatin level increased with the insulin B-cell disorder. The visfatin expression increase in the DM group might be because the organism determined that the insulin function was insufficient to compensate the regulation of the expression to augment the visfatin, using visfatin-like insulin to increase the blood glucose and tend towards balance. These studies suggested that the visfatin might play a part in maintaining the metabolism in a steady state. In our study, when compared with the normal control group, the visfatin expression was higher in the retinas in the DM group. This revealed that there was a relationship not only in the DM but also in the DR.
Our experiment also applied frozen section immunohistochemical staining to detect the visfatin expression site in the rat retina, changing the retinal tissue morphology. We observed the retinal thickness under a microscope, where the measurement distance was 1 mm away from the optic disc on both sides, and the results showed that in the course of DM, the rats' retinal thicknesses gradually decreased, with the change in the ONL being the most obvious. From weeks 4 to 8, the decrease in the retinal thickness was remarkable (P < 0.01), and visfatin was expressed in the retinal nerve fibre layer, IPL and OPL. The expression increased with the progression of DM. To this phenomenon, we conjectured that there exited relation between the decrease of retinal thickness and the reduction of cell and neuron's apoptosis. And thought about the high expression of visfatin in the DM rats' retinas, we firmly believed that there might be a close bond between visfatin and DR.
The existing studies showed that the specific mechanism of visfatin was not clear. Some studies24 have found that injecting visfatin directly into DM rats' bodies, which could improve the sensitivity to insulin, reduced the level of blood glucose and insulin. Through one study25 of rats with the wild-type rat 2/3 visfatin heterozygote, it was also observed that endogenous visfatin could regulate and control the entire insulin sensibility. Therefore, the analysis of visfatin's insulin simulation function uncovered an amazing result: the visfatin took effect through the IR and had appetency that was the same as insulin, except towards the binding site. We could assume that the function of the enhanced sensitivity belonging to visfatin might establish the basis of the insulin mode of action, pointing out that visfatin might activate the IRs' activator pathway through a new mechanism.
In vitro experiments26-28 found that visfatin could promote the glucose uptake of adipocytes and myocytes, restraining the glucose release of hepatocytes, and the accumulation and composition of triacylglycerol in adipocytes, thus reducing the glucose concentration. Revollo et al.29 found that visfatin was the Nicotinamide Phosphoribosyltransferase (NAMPT) of the adjustment and composition of nicotinamide adenine dinucleotide (NAD) and that it was expressed both extra and intracellularly. Wild-type rats with a visfatin gene mutation were used in a sugar tolerance experiment with insulin hyposecretion. After the administration of nicotinamide mononucleotide (the metabolite of the synthetic process of NAD by visfatin), it obviously improved the phenomenon of insulin deficiency. Because of the low level of visfatin in pancreatic cells, the researchers guessed that the function of improving insulin secretion belonged to extracellular visfatin. At the same time, Dogru et al.22 reported that the intravenous injection of glucose induced a rapid increase in visfatin in the plasma, increasing insulin secretion. These results proved the relationship between the visfatin and the insulin B-cell function. All of the aforementioned experiments certified that visfatin could reduce the blood glucose and had a close relationship with DM.
The expression of visfatin has been regulated by multiple factors, including certain hormones and inflammatory factors. For example, to differentiate the 3T3-L1 preadipocyte, dexamethasone can increase visfatin expression; conversely, the growth hormone and isoprenaline can decrease it. In addition, the cholera toxin and forskolin can stop the expression altogether. Tumor necrosis factor (TNF-α) had different regulated functions in different types of cells: there was negative regulation in the 3T3-L1 preadipocyte, and there was positive regulation in the human monocyte cell line a kind of Monocyte-macrophages (THP21) and neutrophil granulocytes.
Overall, visfatin is a new adipocyte factor and is a peptide hormone that can combine and activate the IR, imitating the function of insulin. Additionally, it has other multibiological functions. Although visfatin affects some of the functions in the occurrence and development of type 2 DM, the studies and reports were lacking, and the conclusion was different. This is definitely a physiological and pathological mechanism that requires further research.
This study has shown the expression of visfatin in rat retinal tissues and that its expression was increased in the development of the course of DM. We expect that these results may offer some explanation of the relationship between visfatin and DR, the mechanism of DR and treatment at an earlier stage. The visfatin-specific functional mechanism in DR still requires further study.


