Ratios of specific IgG4 over IgE antibodies do not improve prediction of peanut allergy nor of its severity compared to specific IgE alone
Funding information
This work was partly funded by the European Commission under the 7th Framework Programme through iFAAM (Grant agreement no. 312147) IgE analysis was supported by ThermoFisher Scientific.
Summary
Background
IgG4 antibodies have been suggested to play a protective role in the translation of peanut sensitization into peanut allergy. Whether they have added value as diagnostic read-out has not yet been reported.
Objective
To evaluate whether (a) peanut-specific IgG, IgG4 and/or IgA antibodies are associated with tolerance and/or less severe reactions and (b) they can improve IgE-based diagnostic tests.
Methods
Sera of 137 patients with challenge-proven peanut allergy and of 25 subjects that tolerated peanut, both with known IgE profiles to peanut extract and five individual peanut allergens, were analyzed for specific IgG and IgG4. Antibody levels and ratios thereof were associated with challenge outcome including symptom severity grades. For comparison of the discriminative performance, receiver operating characteristic curve (ROC) analysis was used.
Results
IgE against Ara h 2 was significantly higher in allergic than in tolerant patients and associated with severity of reactions (P < 0.001) with substantial diagnostic capability (AUC 0.91, 95%CI 0.87-0.96 and 0.80, 95%CI 0.73-0.87, respectively). IgG and IgG4 were also positively associated albeit significantly weaker (AUCs from 0.65 to 0.72). On the other hand, ratios of IgG and IgG4 over IgE were greater in patients that were tolerant or had mild symptoms as compared to severe patients but they did not predict challenge outcomes better than IgE alone (AUCs from 0.54 to 0.89).
Conclusion
IgE against Ara h 2 is the best biomarker for predicting peanut challenge outcomes including severity and IgG and IgG4 antibody ratios over IgE do not improve these outcomes.
1 INTRODUCTION
Allergic symptoms to peanut are mediated by IgE antibodies against specific components of peanut, of which Ara h 1, 2, 3 and 6 are generally considered to be the major allergens. Other components are Ara h 8 (Bet v 1 homologue) and Ara h 9 (lipid transfer protein), but sensitization to these molecules is well established to be indirect (cross-reactivity). However, specific IgE against peanut allergens is also found in serum of subjects that tolerate peanuts. Although in tolerant but sensitized subjects IgE levels are usually lower than in peanut allergic patients, they show large overlap between both groups. Why similar IgE levels sometimes translate into tolerance and sometimes into clinical allergy is still not fully understood. In addition, it is also not clear why symptom severity varies between patients.1
Altogether, this limits the prognostic value of serum IgE tests and their contribution to the diagnosis of peanut allergy. Traditionally, serum IgE tests like ImmunoCAP measure IgE against whole peanut extract. With the advent of component-resolved diagnosis (CRD), the potential of serum IgE testing to distinguish between tolerance and allergy, and beyond that, to better assess the risk of severe reactions, has significantly increased. In multiple studies, IgE to Ara h 2 has been reported to perform better than extract in discriminating peanut allergic patients from tolerant sensitized subjects, both in children2-8 and adults.9 More recently, IgE against Ara h 6 has been reported to perform similarly well as Ara h 2 as biomarker for peanut allergy.10-13 This is not surprising knowing that both allergens are closely related 2S albumins sharing (cross-reactive) IgE epitopes.14 An association of IgE against Ara h 2 with symptom severity has also been reported, both in children and adults6, 9, 15, 16 as well as it being a good discriminator between mild and severe symptoms,12, 17 but there are also conflicting reports.2, 7, 18, 19
Not only IgE against peanut extract but also against Ara h 2 can be found in peanut-tolerant subjects. What tips the balance towards tolerance or (severe life-threatening) allergy? One hypothesis is that other antibody isotypes, such as IgG (or more specifically IgG4) and possibly IgA play a protective role by functionally acting as blocking antibodies. Several mechanisms have been proposed for the protective role of blocking antibodies, the most important being the blocking of IgE-facilitated antigen presentation to T cells by CD23-carrying antigen presenting cells (B-cells) and the blocking of allergen-induced mast cell/basophil triggering through mixed IgE/IgG4-receptor cross-linking.20 Whether identical epitopes for IgE, IgG, and IgG4 are a prerequisite for blocking activity is still not fully understood.21, 22 Patients that outgrow a food allergy or successfully undergo immunotherapy have been shown to have increased specific IgG4 levels.23, 24 Early introduction of peanut in children at high risk of developing food allergy showed that a lower ratio of IgG4/IgE against peanut was associated with peanut allergy, suggesting a protective role for blocking antibodies.25 Santos et al26 also reported that the ratio of IgG4/IgE was significantly higher in sensitized but tolerant subjects than in those sensitized with allergic symptoms. Song et al15 found a similar association with the outcome of a food challenge, but ratios did not correlate with symptom severity.
Altogether, these reports suggest that antibody isotypes like IgG, IgG4 and possibly IgA functionally act as blocking antibodies, counteracting the symptom-inducing role of IgE antibodies. However, it has not been evaluated whether measurement of these antibodies may complement serum IgE testing to improve allergy diagnosis, on top of the improvements already achieved by the introduction of CRD.
The aim of this study was therefore to (a) explore associations between peanut extract- and component-specific IgE, IgG, IgG4 and IgA antibodies and the outcome of peanut challenges including symptom severity grades; (b) evaluate the diagnostic accuracy of observed antibody levels and ratios thereof to discriminate between tolerant but sensitized and allergic patients as well as between patients with a mild peanut allergy and a more severe phenotype. To this end, sera of peanut sensitized tolerant and allergic subjects (n = 162) were analyzed by ImmunoCAP for different isotype antibody reactivities against peanut extract, Ara h 1, Ara h 2, Ara h 3, Ara h 8 and Ara h 9.
2 METHODS
2.1 Patient selection, peanut challenges and classification of severity (reference standard)
Data and serum from children and adults with a history of peanut allergy visiting the Allergy Center at Odense University Hospital, Denmark were consecutively collected between March 2003 and March 2009 and stored for later analyses. All subjects (or their legal representatives) signed an informed consent form. The project was approved by the Danish Data Inspectorate Board, licence no. 2012-58-0018.
We included 162 sensitized subjects that had undergone a food challenge to confirm or exclude peanut allergy, as previously described,5 and of whom a blood sample was available that had been taken and stored within a year from the challenge. Twenty-five of the 162 patients were negative during their first challenges and of the remaining 137 positives, 42 were followed longitudinally with one or multiple re-challenges and matched blood samples. Six of these 42 patients later developed tolerance to peanut verified by a negative challenge. All children younger than 4 years of age and patients with compliance problems underwent OFCs (n = 122). All other patients had a DBPCFC (n = 40). In total, 212 challenges were performed of which 181(85.4%) were positive.
Details of the challenges and threshold doses were published elsewhere.27 Patients were challenged with whole roasted unsalted peanuts under guidance of trained staff following the European Academy of Allergy and Clinical Immunology (EAACI) guidelines.28 Allergic reactions during the challenge were graded according to Sampson et al29 as follows: oral symptoms only (I), angioedema, generalized urticaria and/or emesis (II), rhinorrhea and/or repetitive vomiting (III), diarrhoea and asthma (IV). None of the patients showed any loss of bowel control, respiratory arrest or severe bradycardia and/or hypotension (V). Primary outcomes of this study were being tolerant or have a mild positive reaction to the challenge (grade I-II) and having (more) severe symptoms (grade III and IV).
2.2 Sensitization measurements (index tests)
Blood samples were stored at −25°C for later analysis; specific and total IgE was measured by ImmunoCAP at Odense University Hospital, whereas specific IgG, IgG4 and IgA were tested by ImmunoCAP at the Academic Medical Centre, Amsterdam, the Netherlands, according to the manufacturer's instructions (Thermo Fisher Scientific, Uppsala, Sweden). Serum was tested for specific IgE, IgG, IgG4 and IgA antibodies against whole peanut (extract) and peanut components rAra h 1 (7S globulin), rAra h 2 (2S albumin), rAra h 3(11S globulin), rAra h 8(Bet v1 homologue) and rAra h 9 (lipid transfer protein).
2.3 Statistical analysis
Differences in patient characteristics and antibody serum levels were compared between tolerant and allergic subjects and between the severity of the allergic reactions (tolerant, grade I, II, III or IV). We used generalized linear mixed-effect models to adjust for patients with measurements on multiple time-points. Ratios were calculated for IgG/IgE, IgG4/IgE and IgA/IgE. All values were converted from kilo units per litre IgE (kUA/L), micrograms per litre IgG4 (μg/L) and milligram per litre IgG and IgA (mg/L) to nanogram per millilitre (ng/mL). Because correlation analyses were comparable when using random effect models to adjust for multiple testing, Spearman's rank correlation coefficients (rho) are reported for correlations between IgE, IgG, IgG4 and IgA antibodies and the challenge cumulative dose. P-values were adjusted using Bonferroni correction for multiple testing.
For comparison of the discriminative performance of all antibody isotypes and the ratio's receiver operating characteristic curve (ROC) analysis was used. We calculated the area under the ROC curve (AUC) for discriminating between tolerant and allergic patients and for discriminating between patients with mild-to-moderate (tolerant, grade I-II) and patients with severe (grade III and IV) symptoms. We compared AUCs of the different antibodies isotypes/subclasses using DeLong tests. Of the patients with multiple challenges, only the initial challenge was included in the ROC analysis.
Finally, we selected the markers that performed best according to the ROC analysis. Optimal cut-off values corresponding to the best sensitivity and specificity are data-driven and consequently prone to bias.30 Therefore, cut-off values were drawn from both a sensitivity and a specificity of 95%, respectively, or if not attainable closest to 95%. From these cut-offs, the corresponding specificity or sensitivity, and positive predictive values (PPV) and negative predictive values (NPV) were calculated. We used R software version 3.2.4 for all statistical analyses.
3 RESULTS
3.1 Patient characteristics
The age of the 162 patients ranged from 0.6-26.6 years, with a mean age of 6.5 (SD 4.4). The majority was younger than 18 years of age (157/162, 96.9%). Of the 181 positive challenges, the symptoms of 7 patients (3.9%) were classified as grade I, 56 (30.9%) as grade II, 92 (51.8%) as grade III and 26 (14.4%) as grade IV (Table 1). Overall, Ara h 2 was the most frequently recognized peanut allergen (82.1%), mainly in patients with grade II symptoms or higher (84%-100%, see also Table S1 in the online repository). Of the tolerant subjects and grade I patients 35.5% and 28.6%, respectively, had IgE against Ara h 2 but with very low levels, that is, geometric mean of 0.09 and 0.16 kUA/L, respectively.
| Severity | ||||||
|---|---|---|---|---|---|---|
| Tolerant N=31 | Grade I N=7 | Grade II N=56 | Grade III N=92 | Grade IV N=26 | P-value | |
| Sex, males, no (%) | 20 (64.5) | 2 (28.6) | 32 (57.1) | 67 (72.8) | 15 (57.7) | 0.890 |
| Age, mean (sd) | 64.5 (64.5) | 28.6 (28.6) | 57.1 (57.1) | 72.8 (72.8) | 57.7 (57.7) | 0.806 |
|
LOAEL (g) median(IQR) |
- | 0. 1 (0.1-0.1) | 0.1-(0.0-0.5) | 0.4 (0.3-2.2) | 1 (0.3-2.4) | 0.100 |
|
Cumulative dose (g) median (IQR) |
9.90 (9.90-9.90) | 11.6 (6.20-19.90) | 2.0 (0.30-19.90) | 0.37 (0.30-11.92) | 1.01 (0.33-11.1) | 0.005 |
| Peanut-specific IgE (geometric mean and 95%CI, kUA/L) | ||||||
| Peanut | 1.38 (0.97-1.96) | 3.18 (1.66-6.1) | 8.15 (4.87-13.62) | 22.3 (14.7-33.85) | 26.56 (13.06-54.02) | <0.001 |
| Ara h 1 | 0.10 (0.04-0.24) | 0.03 (0.00-0.32) | 0.43 (0.19-0.98) | 1.07 (0.51-2.22) | 1.72 (0.41-7.28) | 0.002 |
| Ara h 2 | 0.09 (0.04-0.19) | 0.16 (0.05-0.54) | 2.90 (1.65-5.08) | 11.28 (7.52-16.92) | 15.28 (8.05-29.01) | <0.001 |
| Ara h 3 | 0.04 (0.02-0.08) | 0.02 (0.00-0.09) | 0.10 (0.05-0.2) | 0.31 (0.18-0.56) | 0.41 (0.13-1.3) | <0.001 |
| Ara h 8 | 0.10 (0.03-0.36) | 0.21 (0.01-5.70) | 0.11 (0.04-0.28) | 0.18 (0.09-0.34) | 0.14 (0.04-0.51) | 0.891 |
| Ara h 9 | 0.02 (0.01-0.06) | 0.01 (0.00-0.07) | 0.02 (0.01-0.04) | 0.03 (0.02-0.04) | 0.02 (0.01-0.04) | 0.985 |
| Total IgE | 281.21 (180.01-439.31) | 224.32 (90.75-554.52) | 347.53 (237.95-507.57) | 508.59 (403.24-641.46) | 411.08 (258.39-653.97) | 0.198 |
- The total number of each group represent the total number of challenges resulting in that symptom grade. All 162 patients had at least on challenge. The 42 patients with more than one challenge can be in more than on group or more than one time in the same group.
- Doses are expressed in gram/peanut protein.
- P-values were calculated by generalized and linear mixed-effect models to account for data from the same patient at different time-points. Significant values are indicated in bold.
- IQR, interquartile range; LOAEL, lowest observed adverse effect level for objective symptoms.
3.2 Associations of antibody isotype levels with tolerance and different severity grades
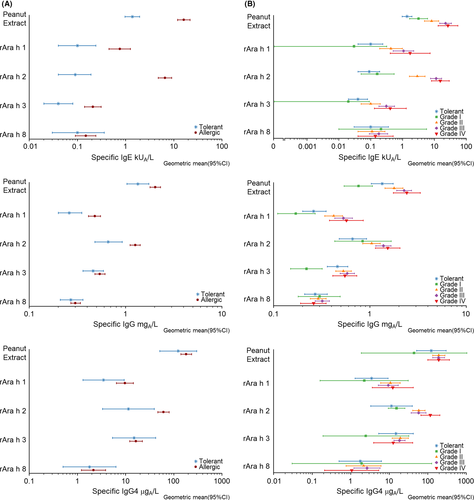
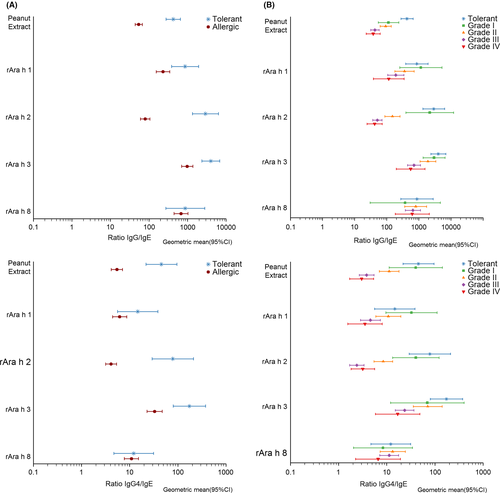
IgE levels to peanut extract were significantly higher in allergic than tolerant subjects (Figure 1A and Table S2) and increased significantly with severity (see Figure 1B and Table S2). The same was observed for IgE against Ara h 1- 3, but not against Ara h 8 and Ara h 9. Overall, IgE responses against Ara h 2 were clearly the highest except in tolerant subjects and grade I patients (Table 1 and Figure 1). IgG antibody levels against peanut extract, Ara h 1 and Ara h 2, and IgG4 against Ara h 2 were also significantly higher in allergic patients than tolerant subjects (Figure 2) and increased with severity (Figure 1 and Table S2). For IgA, no significant associations with tolerance or symptom severity were found (Table S2). Finally, analyses were also performed for ratios of IgG, IgG4, IgA and total IgE over specific IgE (Figures 2 and 3 and Table S3). In all four cases ratios were significantly higher in tolerant than allergic subjects for peanut extract, Ara h 1-3 but not for Ara h 8 and Ara h 9. For the same allergens, all four ratios decreased along with increasing severity of symptoms.
Finally, we analyzed whether thresholds and/or cumulative dose for objective reactions during challenge were associated with severity. Although the threshold dose for objective symptoms was not associated, there was a negative association of severity with the cumulative dose, independent from sIgE levels to peanut Table 1. Only IgE against Ara h 2 showed significant but a weak negative correlation after Bonferroni correction with the cumulative dose (ρ−0.252, P = 0.001).
3.3 Correlations between IgE and non-IgE antibody levels
Significant correlations of non-IgE isotypes with IgE were found for all allergens in case of IgG and IgG4, and for peanut extract, Ara h 1- 3 for IgA (Figure S1 and S2). The highest correlation coefficients (P < 0.002) were found for IgE and IgG4 against Ara h 1 (ρ = 0.728), Ara h 8 (ρ = 0.651) and Ara h 2(ρ = 0.625), and for IgE and IgG against whole peanut (ρ = 0.683), Ara h 1 (ρ = 0.582) and Ara h 2 (ρ = 0.531).
3.4 Identification of peanut allergic patients and severity of peanut allergy
To evaluate the diagnostic potential of the different allergen-specific antibody isotypes and their ratios, ROC analysis was performed. The complete results of all ROC analysis are shown in Table S4 and S5 in the online repository. To distinguish tolerant from allergic subjects, peanut-specific (AUC 0.86, 95% CI 0.79-0.92) and Ara h 2-specific IgE (AUC 0.91, 95% CI 0.87-0.96) performed significantly (P < 0.001) better than IgG, IgG4 and IgA (AUC between 0.52 and 0.72) (Figure 4A; Table S4).
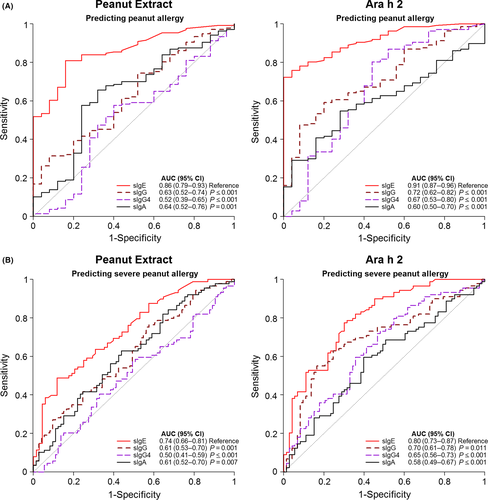
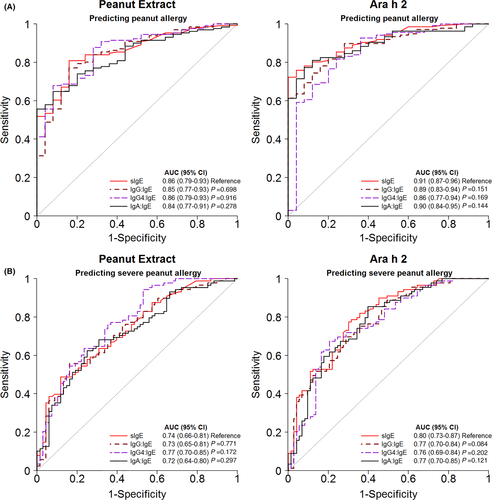
Similar results were found when discriminating patients with a severe peanut allergy (grades III/IV) from those having mild-to-moderate symptoms (Grade I/II) or being tolerant (Figure 4B; Table S4). The AUCs were highest for IgE against Ara h 2 (0.80, CI95% 0.73-0.87) and peanut (0.74, CI95% 0.66-0.81). All other AUCs were ≤0.70. Antibody ratios did not provide a better diagnostic prognostic value compared to IgE alone (Figure 5 and Table S5). AUCs were the same or slightly lower than of IgE alone.
Thresholds for IgE and for the ratios of IgG and IgG4 over IgE to achieve either optimal sensitivity (~95%) or optimal specificity (~95%) are summarized in Table S6 and S7 in the online repository. At a threshold of 0.7 kUA/L for peanut extract and 0.2 kUA/L for Ara h 2, 95% of the allergic patients were correctly identified (sensitivity). However, the specificities at these thresholds were low (24%-52%). When calculating the highest attainable specificity, we found the best result for Ara h 2 using ≥1.3 kUA/L as the threshold. This resulted in a specificity of 92%, sensitivity of 76%, and PPV and NPV of 98% and 41%, respectively. For the classification of severe patients, the specificity remained also low when the sensitivity was ~95%.
4 DISCUSSION
It has been reported earlier15, 26 and now confirmed in the present study that the ratio of peanut-specific, and in particular of Ara h 2-specific IgG4 over IgE antibody levels is higher in subjects that tolerate peanuts than in those that are allergic to peanuts. In several studies, Ara h 2-specific IgE has been demonstrated to be a better diagnostic marker to predict a positive challenge than IgE against peanut extract.2-9, 12
We were interested to know whether ratios of specific IgG4 over IgE could further improve diagnostic performance. By comparing a large group of patients with challenge-proven peanut allergy to tolerant peanut-sensitized subjects, we have now demonstrated that this is not the case. In the present study, the established dominant role of Ara h 2 for peanut allergy31 was confirmed in group of 162 peanut-sensitized allergic and tolerant children and adolescents: by adding Ara h 2-specific IgG4 into the equation and use ratios over Ara h 2-specific IgE, the diagnostic prognostic value compared to specific IgE alone did not improve.
In line with some earlier publications6, 9, 12, 15-17 but opposite to some others,2, 7, 18, 19 our study found clear support for an association between sensitization to Ara h 2 and symptom severity during challenge. Conflicting results in very similarly designed studies such as the study by Blumchen et al18 and the present study may perhaps be explained by differences in stop-criteria during challenge. Here, we extended the present and published observations in support of an association between Ara h2-specific IgE and symptom severity to demonstrate that it is a good diagnostic discriminator between mild and severe symptoms during challenge (AUC 0.80, 95% CI 0.73-0.87).
IgE against peanut allergens is overall higher in patients reacting to peanuts than those tolerating peanuts, especially in patients with more severe symptoms, but a large overlap between groups makes it difficult to accurately discriminate them from each other. The aim of the present study was to investigate whether specific IgG, IgG4 and/or IgA levels are related to challenge outcomes, and whether their measurement may help to improve on the predictive potential of serum IgE testing. Although still a matter of some debate, IgG4 antibodies are generally thought to be (part of) the working mechanism of immunotherapy.20 Also, natural exposure to environmental or dietary allergens induces IgG4 antibodies.32 Recently, the LEAP intervention study25 showed that in young children in the early introduction intervention group exposed to peanut protein, decreased development of peanut allergy was associated with increased IgG4 levels and IgG4/IgE ratios. The classical hypothesis is that specific IgG4 antibodies play a protective role in allergic disease by blocking IgE binding to allergens. This would inhibit IgE-facilitated antigen presentation and activation of effector cells and could thus explain why some sensitized subjects do not have allergic symptoms to peanut.20 We observed that in patients with peanut allergy, similar to IgE, specific IgG and IgG4 levels against peanut Ara h 2 were higher in allergic than tolerant subjects and increased with symptom severity. Although apparently contradicting with a protective role, higher levels of IgG4 against Ara h 2 in allergic patients have been previously described by Glaumann et al.33 Both IgE, IgG and IgG4 are part of a Th2-skewed immune response, and their production is therefore closely intertwined.32 When however expressed as ratio over IgE, a clear inverse association was observed with challenge-proven allergy and severity of symptoms. This supports a protective role of IgG4 as was also proposed earlier in reports by Du Toit et al25 and Santos et al.26
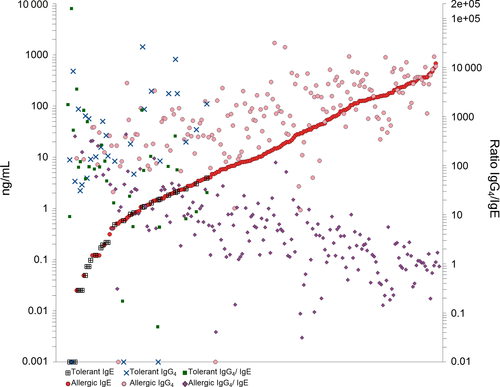
How to explain the apparent discrepancy between a positive association of IgG4 and allergy and symptom severity, and its proposed protective role? Overall, absolute quantities of IgG4 are significantly higher than of IgE, both in tolerant subjects and allergic patients. However, our data show that in patients with IgE levels >100 ng/mL (> ~40kU/L) the IgG4 levels are comparable. The range of IgE levels showed an approximately 50.000-fold difference between highest and lowest, this was around 5000-fold for IgG4. This explains why the ratio of IgG4/IgE decreased with severity while at the same time IgE and IgG4 levels both increased with the severity of allergic reactions. The differences in ratios is greatly affected by the increase of specific IgE, which is much steeper compared to IgG4.
Can differences in IgG4 antibodies improve the predictive accuracy compared to IgE against peanut and in particular Ara h 2? The accuracy of the IgG4/IgE ratio in predicting the outcome of peanut challenges, with an AUC of 0.86 (95% CI 0.77-0.94), was comparable to IgE alone (0.90, 95% CI 0.87-0.96). Also for the severity of symptoms, its predictive accuracy was comparable to that of IgE alone (AUC 0.76, 95% CI 0.69-0.84 vs 0.80, 95% CI 0.73-0.87). Overall, it is clear that, although IgG4/IgE is significantly associated with protection in a peanut challenge, in the equation specific IgE on its own is the decisive risk factor for allergy and severity. Using a cut-off of Ara h 2 > 0.6 kUA/L to identify severe patients, we found a sensitivity of 95% and a NPV of 86.1%, thus ruling out severe peanut allergy with high certainty. On the other hand, a cut-off of 47 kUA/L corresponded to a specificity of 94% and PPV of 90%. High specificity indicates a low false positive rate (rule in severe reactions) but the consequence is that ~50% have a negative test and need additional evaluation.
An important aspect of this study is that these results reflect the situation in a highly specialized hospital with selected patients with high likelihood of having true peanut allergy. This consequently affects the PPV and NPV, since they are highly related to the prevalence of the outcome measure. All patients that are included have positive IgE against peanut extract and this will tend to overestimate the discriminatory accuracy of peanut extract but also of the other markers.
5 CONCLUSION
In conclusion, specific IgG and IgG4 antibody levels are higher in peanut allergic than in sensitized but tolerant subjects and levels increase with the severity of challenge-associated symptoms. Although their ratios over specific IgE are inversely associated with a positive challenge and with symptom severity, these ratios do not translate into a better predictive accuracy than with specific IgE alone. Specific IgE against Ara h 2 is the best biomarker in peanut allergy diagnosis, both to distinguish allergic from tolerant sensitized subjects and to estimate the risk of severe reactions.
ACKNOWLEDGEMENTS
We would like to thank all the patients for their participation in the study.
CONFLICT OF INTERESTS
The authors declare no conflict of interest.


