Identification of clinicopathological-specific driver gene and genetic subtyping of colorectal cancer
Jianjiong Li and Chunnian Wang contributed equally to this work.
Abstract
This study analyzed targeted sequencing data from 6530 tissue samples from patients with metastatic Chinese colorectal cancer (CRC) to identify low mutation frequency and subgroup-specific driver genes, using three algorithms for overall CRC as well as across different clinicopathological subgroups. We analyzed 425 cancer-related genes, identifying 101 potential driver genes, including 36 novel to CRC. Notably, some genes demonstrated subgroup specificity; for instance, ERBB4 was found as a male-specific driver gene and mutations of ERBB4 only influenced the prognosis of male patients with CRC. This sex disparity of ERBB4 was validated in an independent large-scale Memorial Sloan Kettering Cancer Center CRC cohort with 2444 samples. Furthermore, using network-based stratification based on protein–protein interaction, we classified the microsatellite stable (MSS) and unstable (MSI) CRCs into six and three major subtypes, respectively, each showing unique phenotypes and prognoses. In MSS CRC, cluster 5 (APCAMER1–KRAS) and cluster 2 (RNF43–BRAF–PIK3CA) were predominant, and cluster 5 showed a superior overall survival compared with cluster 2. This extensive heterogeneity in driver gene mutations underscores the complexity of CRC and suggests significant implications for treatment and prognostic assessments.
1 INTRODUCTION
Colorectal cancer (CRC) ranks as the third most common cancer by incidence and is the second leading cause of cancer death worldwide.1 In China, the incidence of CRC is on the rise, particularly among individuals under 50, a trend often attributed to increased adoption of Western lifestyles.2 The development and progression of CRC is a consequence of the cooperative function of various driver gene alterations.3 Identification of CRC driver genes is critical for the understanding of the molecular mechanisms of CRC and the development of novel targeted therapies. Recent advancements in next-generation sequencing technologies, such as whole-exome sequencing (WES), whole-genome sequencing (WGS) and targeted sequencing have helped the discovery of numerous CRC driver genes.4-7 Unfortunately, limitations due to small sample size result in the frequent identification of high-frequency driver genes such as APC, BRAF, KRAS, TP53 and PIK3CA,8 while those driver genes which are mutated in a low frequency, or in the “tail” of the mutational frequency curve, but have driving effect on specific tumors or certain subtypes of tumor subtypes, may be overlooked.9 For example, in a recent preprint study that used the largest CRC WGS samples to date (n = 2023), identified 185 driver genes were identified, with 51 previously identified as drivers in cancer types other than CRC and 66 were newly identified as cancer driver genes.10 Moreover, CRC exhibits high heterogeneity, varying significantly based on different pathological features, development locations, ages, and differences between primary lesions and metastatic lesions, each potentially driven by distinct factors.11-13 A typical example is right and left colon cancer; studies have found that KRAS, PIK3CA, BRAF, RNF43, SMAD4, etc. are enriched in right colon cancer, while APC and TP53 are enriched in left colon cancer.4
In this study, we retrospectively analyzed the mutational data of over 6000 metastatic CRC samples undergoing targeted sequencing covering 425 cancer-related genes. We identified novel driver genes and explored the heterogeneity of driver gene mutations in various clinical subgroups. In addition, we classified the CRC samples based on the protein–protein interaction network of the driver genes and investigated the clinical significance and prognosis of different CRC clusters.
2 MATERIALS AND METHODS
This study retrospectively analyzed targeted deep sequencing data from 6530 tissue samples of Chinese patients with advanced CRC utilizing a 425-gene panel (Table S6). Samples failing quality standards or lacking clinical data were excluded. Multiple bioinformatics tools were used to identify driver genes; subsequently, enrichment analysis, clustering analysis and other statistical analysis were performed. (Detailed information can be found in Doc S1.)
3 RESULTS
3.1 Cohort information
In total, 6530 CRC tissue samples obtained from 6530 Chinese metastatic CRC patients spanning three provinces in both southern and northern China were included in the study (see sample detail information in Appendix S1). This cohort consists of 474 microsatellite instability (MSI) samples and 6056 microsatellite stable (MSS) samples. Among 6530 patients, there were 2567 females and 3786 males, with sex information unavailable for 177 patients. The median age of the whole cohort was 59 years old. Patients were categorized into a younger group (n = 820) under 50 years old and an older group (n = 2277) over 50 years old for patients having age information14 (although some patients lacked age information). Moreover, colon cancer samples that had side-specific information were classified into right colon cancer (n = 458) and left colon cancer (n = 580). Based on cancer type information, there were colon cancers (n = 2058) and rectal cancers (n = 1391). Finally, according to sampling sites, the samples were divided into colorectal lesions (n = 4522), including primary tumors and local recurrence, and distant metastatic lesions, which included lesions in distant organs (n = 795). Comprehensive information, such as the distributions of various clinical features in the MSS and MSI group, is provided in Table S1.
3.2 Identification of CRC driver genes
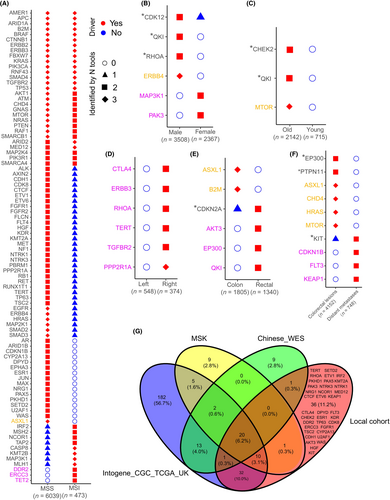
We used three tools implementing three different algorithms (OncodriveFML, OncodriveCLUSTL, and dNdScv) to detect both overall and subgroup-specific CRC driver genes. By virtue of over 6000 samples, not only canonical CRC driver genes such as TP53, APC, KRAS, BRAF, etc., but also driver genes with a low mutation frequency were identified in this study (Figure 1A, Tables S2 and S7). Moreover, a large sample size allows us to find those driver genes that play roles in specific clinicopathological subgroups, such as the MSS group or MSI group. Rigorous criteria were applied to define subgroup-specific driver genes, accounting for sample size effects. For instance, in the comparison of two exclusive subgroups (MSS vs. MSI, male vs. female, etc.), genes are required to be identified by all three tools in the larger subgroup and at the same time not identified by any of the tools in the smaller subgroup. Notably, among 31 driver genes identified by all three tools in the MSS group, only one (ASXL1) was not detected by any of the tools in the MSI group (Figure 1A) and may be a driver gene specifically for MSS CRC. Three genes, DDR2, ERCC3 and TET2 were identified as driver genes specifically for MSI CRC (Figure 1A). ERBB4 was found to be specific for male patients (Figure 1B). Among the 101 driver genes identified, 36 genes had not been reported as CRC driver genes in previous studies,4, 7, 10, 15, 16 (Figure 1G). According to AACR Project GENIE and previous literature, 36 driver genes had been linked to a range of cancer types (Table S3). Notably, genes such as CDK8, PKHD1, IRF2 and CTLA4 are most frequently mutated in colon adenocarcinoma.
3.3 Characterization of the CRC driver genes
The 101 CRC driver genes were mapped onto a protein–protein interaction (PPI) network using the STRING online tool (Figure 2A). In total, six major functional PPI subnets were identified that constituted different pathways including: (1) Wnt/β-catenin (WNT) represented by APC, CTNNB1 and RNF43; (2) RTK–RAS represented by KRAS and BRAF; (3) PI3K represented by PIK3CA and PTEN; (4) TP53/Cell cycle/DDR which consists of pathways involved in cell cycle progression, cell cycle checkpoints and DNA damage repair; (5) TGF-beta represented by Smad genes; and (6) SWI/SNF/Chromatin remodeling, which consists of the SWI/SNF pathway represented by ARID1A and genes participating in chromatin remodeling for example PBRM1. The top 30 most frequently mutated driver genes in the MSS and MSI groups are shown in Figure S1AB. Marked variations were observed between the MSS and MSI groups.

The SWI/SNF/Chromatin remodeling pathway seems to be more frequent in the MSI group, as associated genes, such as KMT2B, ARID1A, KMT2A, CTCF, etc., generally ranked higher in the MSI group than in the MSS group. Distinct members in the same pathway showed preferences between the MSS and MSI group, particularly in the TGF-beta pathway where Smad genes seemed to function predominantly function in the MSS group, while TGFBR2 functioned in the MSI group. Pathway analysis (Figure S1C,D) showed that RTK–RAS, WNT and PI3K pathways ranked highly in both the MSS and MSI groups. In contrast, the TP53 pathway was more frequently mutated in the MSS group, while SWI/SNF and chromatin remodeling pathways were more commonly mutated in the MSI group.
Next, we performed mutually exclusive and co-occurrence analysis on the 101 driver genes to identify genes that frequently mutated together, and genes that rarely mutated together. In the MSS group, significantly mutually exclusive mutations existed that were observed among members of the WNT pathway, such as APC vs. RNF43, APC vs. AXIN2, AMER1 vs. CTNNB1, etc. However, although APC and AMER1 both belong to the WNT pathway, they showed a co-occurrence pattern (Figure 2B, Figure S2A). Similarly, key members in the RTK–RAS pathway, including KRAS, BRAF, NRAS and NF1 were mutually exclusive (Figure 2B, Figure S2B). Additionally, APC also showed mutual exclusivity with the TGF-beta genes, including TGFBR2 and SMAD4 (Figure 2B), and TP53 showed mutual exclusivity with ATM and key members of other pathways, including KRAS, PIK3CA, SMAD2 and SMAD4 (Figure 2B). Finally, there were two co-occurrence gene sets in the MSS group: APC–KRAS–FBXW7–AMER1 (Figure S2C) and RNF43–BRAF (Figure S2D). The two gene sets were mutually exclusive and may represent two different subtypes of MSS CRC. In the MSI group, the majority of mutually exclusive pairs involved TP53 and other key driver genes such as ARID1A, KMT2B, RNF43, etc. (Figure 2C). As a result, TP53 is a mutually exclusive gene from the SWI/SNF/Chromatin remodeling pathway in the MSI group (Figure S2E).
3.4 Sex disparity of ERBB4 as CRC driver gene and subgroup-specific driver genes in MSS CRC
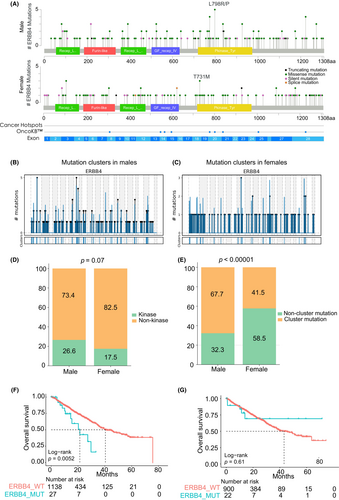
As mentioned earlier, ERBB4 was identified as a driver gene exclusively in the male group but not in the female group. We further explored the characterization of mutations (limited in SNVs) in ERBB4 among male patients and female patients (limited in MSS patients). Although the mutation frequencies of ERBB4 were similar in men and women (5.1% in men and 4.9% in women), the distribution of ERBB4 mutations showed variation between them (Figure 3A). There was a higher density of mutations in the kinase domain in males compared with females. In addition, the L798R/P mutation, a hotspot mutation reported in other gastrointestinal cancers, was only present in male patients. Moreover, the mutations in the ERBB4 mutation showed a more significant clustering distribution in male patients (Figure 3B) than in female patients (Figure 3C), as revealed using OncodriveCLUSTL. Statistical analysis further indicated a higher proportion of mutations in the kinase domain in male patients compared with female patients (p = 0.07, Fisher's exact test; Figure 3D), and a significantly higher proportion of clustered mutations in male patients compared with female patients (p < 0.00001, Fisher's exact test; Figure 3E). Survival analysis based on the Memorial Sloan Kettering Cancer Center (MSK) data showed that in male MSS CRC patients, those with ERBB4 mutations in primary tumors had significantly worse overall survival than those without ERBB4 mutations (Figure 3F). This phenomenon was not observed in the female patients (Figure 3G), supporting the sex disparity of the ERBB4 driving effect. To further elucidate our observations, we analyzed the variations in the ERBB4 mutations across different sexes in an independent validation cohort consisting of 2444 samples. This validation confirmed the original data, showing a slight discrepancy in mutation frequencies between males (6.0%) and females (4.6%). Notably, a greater density of mutations was observed in the kinase domain of ERBB4 in males than in females. Aligning with previous findings, the L798R/P mutation was exclusively present only in male samples (Figure S3), underscoring a possible sex-specific mutation pattern in the ERBB4 gene. In addition, ERBB4's role as a driver gene in males and in all patients was validated using dNdScv and OncodriveFML, which both yielded p-values of less than 0.05 (Table S4). These results demonstrated the significant role of ERBB4 as a driver gene and a subgroup-specific driver gene in MSS CRC.
In addition to ERBB4, several other driver genes were found to be subgroup specific. Although low mutation frequencies of these genes prevented us from deeply investigating their mutational distribution, we could still explore how they affected the prognosis of CRC patients using the MSK cohort. MTOR was identified to be a driver gene specifically for older patients (Figure 1C). Older patients with a MTOR mutation tended to have a worse overall survival than those without the mutation (Figure S4A). However, in younger patients, the MTOR mutation status did not affect survival (Figure S4B). Similarly, ERBB3 was identified as a driver gene specific for right colon cancer (Figure 1D). In the patients with left colon cancer, mutations in ERBB3 were not associated with the overall survival (Figure S4C); while those with right colon cancer and ERBB3 mutations experienced worse overall survival with a borderline significance (p = 0.095) (Figure S4D). Finally, three genes, EP300, AKT3 and QKI, were identified as rectal cancer-specific driver genes, rather than colon cancer (Figure 1E). As a result, the mutation status of the three genes was not associated with the survival of patients with colon cancer (Figure S4E); however, rectal cancer patients carrying mutations in any of these genes had a significantly worse overall survival than those without these mutations (Figure S4F).
3.5 Heterogeneity of driver gene mutations in MSS CRC
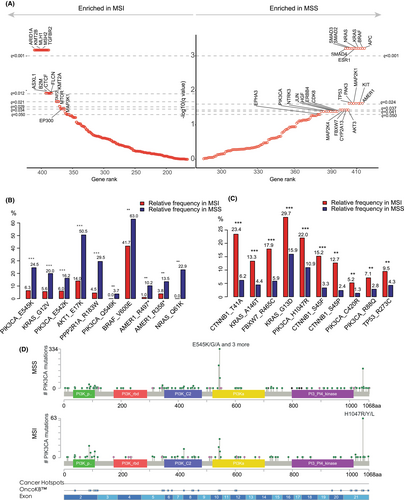
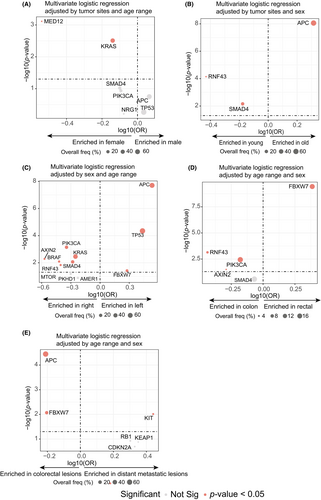
Using a permutation test, we found that most canonical CRC driver genes, including APC, BRAF, KRAS, Smad genes, TP53, PIK3CA, FBXW7, etc., were enriched in the MSS group. Conversely, genes related to SWI/SNF and chromatin remodeling pathways, such as ARID1A, KMT2B, CTCF, KMT2A, etc., were enriched in the MSI group (Figure 4A, Table S5). We conducted univariable logistic regression to study the enrichment of the driver genes in various clinical subgroups of MSS CRC (Figure S5A–E). Enrichment of certain driver genes in a specific clinical subgroup suggested that these driver genes may undergo positive selection under the context of such clinical features. We then included significant genes screened by univariable analyses (q-value < 0.05) into multivariable logistic regression in which features, except for the target feature, were adjusted. For example, APC was found to be enriched in both male patients (Figure S5A) and older patients in the univariable analysis (Figure S5B); however, it only maintained its significance in older patients (Figure 5B) but not in male patients in the multivariable analysis (Figure 5A), probably due to the higher proportion of older males compared with females. Additionally, MED12 and KRAS mutations were found to be enriched in female patients compared with male patients (Figure 5A), with MED12 mutations having a high frequency in estrogen-dependent benign tumors and breast cancer.17 We found that APC mutations were mutually exclusive with RNF43 and SMAD4 mutations (Figure 2B) and were enriched in the older patients, whereas RNF43 and SMAD4 mutations were enriched in the younger patients (Figure 5B), suggesting that early-onset CRCs were driven by distinct mechanisms from late-onset CRCs. Left and right colon cancer showed significant heterogeneity in driver gene mutations. APC, TP53 and FBXW7 were enriched in left colon cancer, while RNF43, PIK3CA, KRAS, BRAF, SMAD4, etc. were enriched in right colon cancer (Figure 5C). Regarding cancer type, one of the most significant differences was that FBXW7 was highly enriched in rectal cancer as opposed to colon cancers. In contrast, PIK3CA, RNF43 and AXIN2 were enriched in colon cancer (Figure 5D). Finally, APC and FBXW7 were enriched in colorectal lesions (primary or local recurrence) rather than distant metastases, suggesting that tumors driven by APC and FBXW7 mutations may have a low risk for metastasis (Figure 5E). Multivariable analyses at the pathway level indicated that female, right colon, and colon cancer were prone to be driven by mutations in the RTK–RAS, PI3K and TGF-beta pathways compared with male, left colon and rectal cancer (Figures S6A, S5C and S6D). Conversely, late-onset CRCs were predominantly driven by mutations in the WNT pathway, in contrast with the TGF-beta pathway in early-onset CRC (Figure S6B). Rectal cancers were characterized by the enrichment of the mutations in the NOTCH pathway represented by FBXW7 (Figure S6D) and mutations in the WNT pathway were more common in colorectal lesions (Figure S6E).
3.6 Classification of CRCs based on the driver gene PPI network
We classified the CRC samples using the network-based stratification algorithm (NBS) based on the previously constructed PPI network. NBS aims to recognize patterns of mutations using the similarity of mutation profiles within the context of a PPI network to identify and stratify patients into a predefined number of clusters. Only samples with mutations in at least three driver genes were considered for classification. As a result, 3730 MSS CRCs were classified into six clusters (Figure S7). Cluster 2 exhibited a notable affinity with cluster 3, and clusters 5 and 6 showed a strong connection, indicating complementary or closely related roles (Figure S7). In contrast, cluster 1 was distinct, displaying the least similarity with the other clusters. Marker genes in the six clusters revealed they were characterized by distinct cancer-driving pathways, including SWI/SNF/Chromatin remodeling (cluster 1), WNT(RNF43)–RTK–RAS(BRAF)–PI3K(PIK3CA) (cluster 2), TGF-beta (cluster 3), APC–FBXW7 (cluster 4), WNT(APC/AMER1/AXIN2)–RTK–RAS(KRAS) (cluster 5) and ATM (cluster 6) (Figure S8A). Among them, cluster 5 accounted for the highest proportion (53.6%), followed by cluster 2 (26.3%), cluster 4 (12.0%) and cluster 3 (6.0%), and only small numbers of samples were classified into cluster 1 (1.6%) and cluster 6 (0.5%) (Figure S8B). Cluster 5 was dominant overall and across all clinical subgroups (Figure S8C–G). logistic regression analysis revealed that cluster 5 was significantly enriched in male, old and left colon cancers compared with female, younger and right colon cancers. In contrast, cluster 2 was significantly enriched in female, young and right cancers (Figure S8C–E, Figure S9A–C). In addition, cluster 2 was also more prevalent in colon cancers and distinct metastases than in rectal cancers and colorectal lesions (Figure S8F–G, Figure S9D,E). Cluster 4 was significantly enriched in left colon cancers and rectal cancers (Figure S8E,F and Figure S9C,D). Clusters 1, 3 and 6 did not show significant variations in the distribution across various clinical subgroups, probably due to limited sample sizes.
We then assigned each sample of the MSK cohort to the existing six clusters by measuring the Jaccard similarity between the MSK samples and local samples. Marker genes in each cluster of the MSK cohort were consistent with the marker genes of the local cohort (Figure 6A); however, the proportion of cluster 5 was higher, while proportions of other clusters were lower, in the MSK cohort compared with the local cohort (Figure 6B). As the MSK cohort contained primary and metastatic tumors, survival analyses were conducted for primary and metastatic tumors separately. For primary tumors, cluster 4 and cluster 5 had significantly better overall survival than cluster 2 (Figure 6C). For metastatic tumors, cluster 4 and cluster 5 showed significantly better overall survival than both cluster 2 and cluster 3 (Figure 6D). Multivariable Cox analyses confirmed that, for both primary and metastatic tumors, cluster 4 and cluster 5 had a better prognosis than cluster 2 after controlling for age, sex and tumor location (Figure 6E,F).
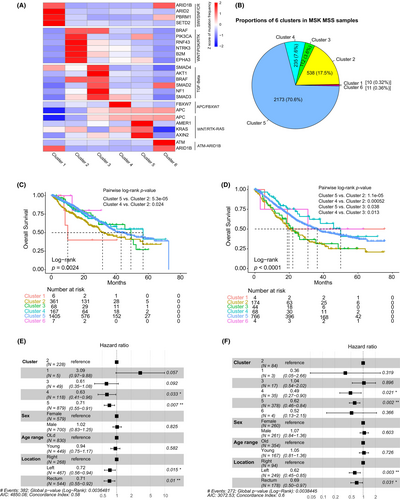
The same NBS procedures were applied to the local MSI samples. Of the 428 samples with mutations in at least three driver genes, they were classified into four clusters (Figure S10A). As cluster 3 contained only one sample, it was merged into the nearest cluster 4 to form a new cluster 3. The three clusters had different cancer-driving pathways: WNT(APC/AMER1/AXIN2)–RAS(KRAS) for cluster 1 which corresponded to cluster 5 in MSS; WNT(RNF43)–PI3K(PIK3CA)–SWI/SNF/Chromatin remodeling for cluster 2; and SWI/SNF/Chromatin remodeling for cluster 3 (Figure S10B). Cluster 2 had the highest proportion, followed by cluster 1, with cluster 3 having the fewest samples. Similarly, the MSK MSI samples were assigned to the three clusters based on the same method used for MSS. The marker genes in the MSK clusters were consistent with the local cohort (Figure S11A), and the proportions of the three clusters were also similar to the local cohort (Figure S11B). MSI patients generally have a favorable prognosis, but survival analysis did not show a significant difference in overall survival among the three clusters based on the primary tumors (Figure S11C). For metastatic tumors, cluster 2 displayed a worse overall survival than cluster 3 with a margin p-value of 0.09 (Figure S11D).
4 DISCUSSION
In this study, we used a large-scale targeted sequencing cohort to explore the heterogeneity of driver gene mutations in Chinese CRC patients. We identified a total of 101 driver genes and, among them, 36 genes had not been reported previously as CRC driver genes. The majority of these genes exhibited a low mutation frequency and may play driving roles in specific clinical subgroups. For example, TET2 was identified as an MSI CCR-specific driver gene in our study, reflecting findings from the study conducted by Cornish et al. in which TET2 was identified as a driver gene from a CRC subgroup with POLE mutations and was enriched in the MSI CRC subgroup.10 It has been known that a certain proportion of MSI colorectal cancers is the consequence of CpG island hypermethylation in the promoters of mismatch repair genes;18 as a DNA methylation regulator,19 the role of TET2 in MSI CRC is worthy of further study. We also discovered sex disparity of the driving effect of ERBB4 mutations, as ERBB4 was only identified as a driver gene in men and the mutational status of ERBB4 only affected male patient overall survival in the survival analysis. The Human Protein Atlas shows that testis cancer has the highest ERBB4 protein positive rate. One previous study also indicated that ERBB4 is involved in testis development,20 implying male-specific functions of ERBB4. Despite that, the mechanisms underlying the male-specific driving effect of ERBB4 are unknown. We did not explore additional confounders beyond gender due to our use of a random sampling strategy, which aimed to minimize sampling bias. Furthermore, we believe genetic mutations are less susceptible to experimental handling variations that could potentially affect analyses and introduce confounding effects.
We compared the mutational landscapes of MSS and MSI CRC using a permutation test. We found that mutations in the SWI/SNF/Chromatin remodeling pathway were significantly enriched in MSI CRC. ARID1A, ranking the most significant gene enriched in the MSI group, has been proven to interact with MSH2, and ARID1A deficiency could impair mismatch repair and promote microsatellite instability.21-23 Our data showed that changes in the SWI/SNF/Chromatin remodeling pathway may be the key driving factor for MSI CRC. This pathway is involved in two out of three MSI CRC clusters. In addition to ARID1A, other members of the pathway, such as SMARCA4 and SMARCB1, the marker genes of cluster 3 of MSI CRC, were confirmed to be strongly associated with microsatellite instability.24
We classified MSS CRCs into six clusters based on the PPI network of the identified driver genes. Four of these clusters, namely clusters 2–5, accounted for the vast majority of cases. Cluster 5, which is characterized by the mutations in the WNT (APC/AMER1/AXIN2) and RTK–RAS (KRAS) pathway, possessed the highest proportion. Moreover, the MSK cohort had a higher proportion of cluster 5 than our local cohort. Previous studies have found that Chinese patients with CRC had a lower mutation frequency in APC than a Western population.25 In fact, the APC mutation frequency was 62.8% in our MSS samples and 77.9% in the MSK MSS samples, leading to a higher proportion of subtype 5 in the MSK cohort. Cluster 5 is expected to overlap the consensus molecular subtype 2 (CMS2) as they share hallmark features including activation of the WNT pathway, enriched in male, old patients and left colon cancer, as well as a better prognosis.26, 27 Cluster 2 is characterized by the activation of the WNT (RNF43), RTK–RAS (BRAF) and PI3K (PIK3CA) pathways. This cluster contrasts with cluster 5, for example, enriched in female, young patients and right colon cancer, as well as having a worse prognosis. Recently, the continuous rising incidence of early-onset CRC has gained considerable attention.28, 29 Our data suggested that mutations in RNF43, a negative regulator of WNT signaling,30 as well as cluster 2 with RNF43 as the most significant marker gene, were significantly enriched in young patients (Figure 5B, Figure S8D, Figure S9B), which is in line with another Chinese cohort study.31 Clusters 2 and 5 were based on the two gene sets, which were co-concurrent internally but mutually exclusive, i.e. APC–KRAS and RNF43–BRAF. The mechanisms that form such patterns, as well as differential distribution in clinical subgroups, are unclear. The co-occurrence of two driver mutations indicated a positive epistatic relationship and possible collaboration.32 Studies have found that CRC patients with RNF43 mutations had a better response to BRAFV600E inhibitor,33, 34 highlighting the close interplay between RNF43 and BRAF. Cluster 4, with APC and FBXW7 as the marker genes, ranked third in the prevalence, and was significantly enriched in rectal cancer compared with colon cancer, as well as left colon cancer, compared with right colon cancer. Cluster 4 had a comparable prognosis with cluster 5 and was better than cluster 2. The other three clusters did not show significant association with clinical features probably due to fewer samples.
In summary, through clinically targeted sequencing of more than 6000 Chinese CRC samples, we identified a set of novel CRC driver genes with low mutational frequencies or function in specific clinical subgroups. Our study revealed the extensive heterogeneity of driver gene mutations in CRC patients and classified CRC based on the driver gene interaction network. These findings supplement the current consensus molecular subtype system and provide new insight into the potential mechanisms driving CRC development.
AUTHOR CONTRIBUTIONS
Jianjiong Li: Conceptualization; formal analysis; writing – original draft. Chunnian Wang: Formal analysis; writing – original draft. Changshun Yang: Formal analysis; writing – review and editing. Hua Bao: Formal analysis; supervision; visualization. Ningyou Li: Formal analysis; visualization. Xianqiang Huang: Data curation. Wei Gong: Data curation. Xinyue Hong: Project administration. Jiani C. Yin: Project administration. Jiaohui Pang: Project administration. Meifu Gan: Conceptualization; supervision. Danping Yuan: Conceptualization; supervision.
ACKNOWLEDGMENTS
Not available.
FUNDING INFORMATION
The study was funded by the Project of Ningbo Leading Medical & Health Discipline (Project Number: 2022F30; Chunnian Wang), Basic Public Welfare Research Project of Zhejiang Province (Grant/Award Number: LGF20H160023; Meifu Gan), Youth Scientific Research Project of Fujian Provincial Health, Family Planning Commission (grant number 2018-2-5; Changshun Yang), the Sail Fund of Fujian Medical University (grant number 2017XQ1151, Changshun Yang), and Foundation of 2020 Fujian Provincial Department of Finance Health and Health Provincial Special Subsidy (Changshun Yang).
CONFLICT OF INTEREST STATEMENT
Hua Bao, Ningyou Li, Xinyue Hong, Jiani Yin and Jiaohui Pang are employees of Nanjing Geneseeq Technology Inc. All other authors declared no conflicts of interest.
ETHICS STATEMENT
Approval of the research protocol by an Institutional Reviewer Board: The procedures and protocol of this study were approved by the Medical Ethics Committee of Nanjing Geneseeq Medical Laboratory (NSJB-MEC-2023-05).
Informed consent: Written informed consent of sample usage for research was obtained from each patient before sample collection.
Registry and the Registration No. of the study/trial: N/A.
Animal Studies. If not applicable: N/A.
Open Research
DATA AVAILABILITY STATEMENT
Due to the consent agreements signed by all participants, the raw genomic sequencing data used in this study will remain confidential and will not be shared. Academic researchers wishing to access the mutation data may contact the corresponding author to complete a study review committee form. Furthermore, a data transfer agreement must be executed by both the requester and their affiliated institution.


