Pan-immune-inflammation value predicts immunotherapy response and reflects local antitumor immune response in rectal cancer
Abstract
The pan-immune-inflammation value reflects the systemic inflammatory response, and tumor-infiltrating lymphocytes indicate a local immune response in rectal cancer. However, the association between systemic inflammatory response, as indicated by the pan-immune-inflammation value, and local immune responses in rectal cancer remains unclear. This study analyzed 915 treatment-naïve rectal cancer patients from the Peking Union Medical College Hospital and PLA General Hospital (PLAGH) cohorts who underwent radical surgery to investigate the relationship between the pan-immune-inflammation value and immune responses. Lower pan-immune-inflammation value was significantly associated with improved disease-free survival and cancer-specific survival. Multivariate Cox regression models identified the pan-immune-inflammation value as an independent prognostic factor. In the PLAGH cohort, patients with low pan-immune-inflammation values had higher immune cell levels, activated immune pathways, and increased expression of immune checkpoint genes according to RNA sequencing. Hematoxylin and eosin staining and immunohistochemical analysis revealed that lower pan-immune-inflammation value was associated with higher tumor-infiltrating lymphocyte density, more mature tertiary lymphoid structures, increased CD8+ T cells, and elevated human lymphocyte antigen class I expression. Conversely, patients with high pan-immune-inflammation values exhibited pathways linked to tumor progression, such as angiogenesis, epithelial–mesenchymal transition, hypoxia, KRAS signaling, and TGF-ß signaling. Among patients receiving anti-PD-1 therapy, responders had low pre- and post-treatment pan-immune-inflammation values. The pan-immune-inflammation value is a reliable marker associated with distinct immune microenvironment characteristics and can effectively predict disease-free survival, cancer-specific survival, and response to immunotherapy.
Abbreviations
-
- Agg
-
- aggregates
-
- CA19-9
-
- carbohydrate antigen 19–9
-
- CCR
-
- cytokine and cytokine receptor
-
- CEA
-
- carcinoembryonic antigen
-
- CRC
-
- colorectal cancer
-
- CSS
-
- cancer-specific survival
-
- DC
-
- dendritic cell
-
- DFS
-
- disease-free survival
-
- EMT
-
- epithelial–mesenchymal transition
-
- FL-1
-
- primary follicles
-
- FL-2
-
- secondary follicles
-
- G1-2
-
- well/moderate
-
- G3
-
- poor
-
- GPAG
-
- good-prognosis angiogenesis genes
-
- H&E
-
- hematoxylin and eosin
-
- HLA
-
- human lymphocyte antigen
-
- ICI
-
- immune checkpoint inhibitor
-
- IFN
-
- interferon
-
- IHC
-
- immunohistochemical
-
- LNR
-
- lymph node ratio
-
- MLR
-
- monocyte-to-lymphocyte ratio
-
- MSI-H
-
- microsatellite instability-high
-
- NLR
-
- neutrophil-to-lymphocyte ratio
-
- non-pCR
-
- incomplete pathological remission
-
- pCR
-
- complete pathological response
-
- PIV
-
- pan-immune-inflammation value
-
- PLR
-
- platelet-to-lymphocyte ratio
-
- PPAG
-
- poor-prognosis angiogenesis genes
-
- RC
-
- rectal cancer
-
- SII
-
- systemic immune-inflammation index
-
- SIR
-
- systemic inflammatory response
-
- TILs
-
- tumor-infiltrating lymphocytes
-
- TIME
-
- tumor immune microenvironment
-
- TLS
-
- tertiary lymphoid structures
-
- TME
-
- tumor microenvironment
-
- TRS
-
- tumor regression score
1 INTRODUCTION
Rectal cancer (RC) remains a major clinical challenge because of its high prevalence and potential for poor prognosis.1 Despite advancements in surgical techniques, chemotherapy, and radiotherapy, the survival rates of RC patients remain poor and highly variable, underscoring the need for identifying reliable prognostic biomarkers to guide treatment decisions.2
The emergence of immunotherapy over the past decade, especially immune checkpoint inhibitors (ICIs), has substantially improved survival outcomes in patients who were non-responsive to multiple treatment options.3 However, only a small proportion of colorectal cancer (CRC) patients benefit from immunotherapy, as primary and acquired resistance to immunotherapy limit its applicability.4 Notably, the composition of tumor-infiltrating lymphocytes (TILs) within the tumor immune microenvironment (TIME), a key component of the local immune response, is associated with prognosis5-7 and sensitivity to immunotherapy in CRC.8 Therefore, further understanding of the patterns of immune cell infiltration and activation within the TIME of RC is crucial for enhancing the prognosis and therapeutic outcomes.
Inflammation plays a crucial role in tumor initiation, progression, and metastasis, including CRC.9, 10 Tumor-associated inflammation manifests both as a local immune response and systemic inflammatory response (SIR). SIR markers, including the neutrophil-to-lymphocyte ratio (NLR), platelet-to-lymphocyte ratio (PLR), monocyte-to-lymphocyte ratio (MLR), and systemic immune-inflammation index (SII), have gained considerable attention for their prognostic value in various cancers.11, 12 Pan-immune-inflammation value (PIV), a novel SIR marker, has emerged as a promising indicator of systemic inflammation and immune status. PIV integrates several immune and inflammatory parameters and can more comprehensively reflect the overall inflammatory milieu of the patient with superior prognostic value than that of other SIR markers such as NLR, PLR, MLR, and SII.13, 14 High PIV levels are associated with poor clinical outcomes in CRC.15-17 Notably, several cytokines and inflammatory cells produced by tumor-associated inflammation can migrate from the bloodstream to local tissues through systemic circulation, thereby affecting the antitumor immune response.18, 19 However, the association between SIR, such as PIV, and local immune responses in RC remains unclear, highlighting the need for further investigation.
Our study explored the relationship between PIV and prognosis of RC patients in two independent cohorts. Additionally, immunohistochemical (IHC) analyses, hematoxylin and eosin (H&E) staining, and RNA sequencing were performed to comprehensively understand the relationship between PIV and immune cell infiltration patterns in RC. Furthermore, we investigated the potential of PIV as a predictive biomarker for response to anti-PD-1 antibody therapy in RC patients, highlighting its clinical utility in personalized treatment strategies.
2 MATERIALS AND METHODS
2.1 Patients and materials
This study included 915 treatment-naïve patients with RC who had undergone curative surgery at two different institutions. Between January 2018 and January 2021, 679 RC patients from Peking Union Medical College Hospital (PUMCH) were included in the discovery cohort (PUMCH cohort). Between January 2015 and January 2017, 236 RC patients from the 7th Medical Center of the PLA General Hospital (PLAGH) were included in the validation cohort (PLAGH cohort). Patients with distant metastasis, non-adenocarcinoma, or those receiving neoadjuvant therapy such as chemotherapy or chemoradiotherapy were excluded. Only the patients with complete data were included, and the follow-up period was calculated from the date of surgery to the last censor.
Furthermore, this study included 16 RC patients from PLAGH who received neoadjuvant chemoradiotherapy combined with an anti-PD-1 antibody (tislelizumab) between October 2023 and May 2024.
2.2 Clinicopathological characteristics
Clinicopathological characteristics included sex, age, T stage, N stage, lymph node ratio (LNR), tumor diameter, tumor grade (G1-2: well/moderate G3: poor), tumor location, tumor deposits, vascular invasion, and perineural invasion. The blood-based PIV was calculated based on preoperative peripheral blood data using the formula: PIV = (neutrophil count [109/L] × platelet count [109/L] × monocyte count [109/L])/lymphocyte count (109/L). Tumor markers, including carbohydrate antigen 19–9 (CA19-9) and carcinoembryonic antigen (CEA), were measured within 1 week before surgery.
The assessed follow-up outcomes were disease-free survival (DFS) and cancer-specific survival (CSS). DFS was defined as the time between radical surgery and recurrence during follow-up. CSS was defined as the time between radical surgery and death due to RC during follow-up.
2.3 Immunohistochemistry
Immunohistochemistry analysis was performed on 4-μm-thick sections following established protocols.20, 21 The procedure involved deparaffinization, rehydration, incubation with 3% H2O2, heat-induced antigen retrieval, incubation with primary and secondary antibodies (CD8 [ab101500, Abcam], CD20 [ab9475, Abcam], CD21 [TA327627, ZSGB-BIO], CD23 [TA801554, ZSGB-BIO], and human lymphocyte antigen (HLA) class I [88274T, CST]), and diaminobenzidine staining. Sections were then stained with hematoxylin, dehydrated, and mounted on neutral resin. Scanning was performed using a Leica CS2 and analyzed using an Aperio ImageScope.
2.4 Assessment of tumor regression score (TRS)
Tumor regression score in the post-neoadjuvant therapy resected specimens was determined according to the AJCC guidelines.21 TRS was classified as follows: 0, no viable cancer cells; 1, single cells or rare small groups of cancer cells; 2, residual cancer outgrown by fibrosis; and 3, extensive residual cancer with no evident tumor regression.21, 22 Patients with TRS 0 and 1 were classified as responders, whereas those with TRS 2 and 3 were considered nonresponders. Specifically, TRS 0 and TRS 1–3 indicate complete pathological response (pCR) and incomplete pathological remission (non-pCR), respectively.
2.5 Assessment of TILs and tertiary lymphoid structures (TLS)
Hematoxylin and eosin-stained tissue sections were examined to assess TIL intensity and TLS maturity. TILs are lymphocytes infiltrating the tumor stroma within the borders of invasive tumors. TIL intensity was evaluated using International TILs Working Group criteria,23 categorizing tumors into three groups: low (TILs <10%), intermediate (10% ≦ TILs <50%), and high (TILs ≧50%) TIL. The classification of TLS maturity is as follows: aggregate (Agg) containing primarily clusters of B cells (CD20) without FDC network (CD21) and GC (CD23); primary follicles (FL-1) containing clusters with an FDC network (CD21) without GC (CD23); and secondary follicles (FL-2) containing clusters with an FDC network (CD21) and GC (CD23).20, 21 Patients were classified into the Agg group when only Agg was present, without FL1 or FL2; FL1 group when FL1 was present without FL2; and FL2 group when FL2 was present. The HLA class I status, determined by EMR8-5, is categorized as either high or low.24 HLA I-High was defined as complete and heterogeneous membrane staining in more than 80% of the tumor cells. HLA I-Low was defined as membrane staining in less than 80% of the tumor cells.
2.6 RNA-seq and analysis
We conducted RNA-seq analysis on fresh-frozen tissues from 59 patients, including 19 PIV-high and 39 PIV-low samples. Total RNA was extracted using TRIzol® Reagent, according to the manufacturer's instructions (Invitrogen), and genomic DNA was removed using DNase I (TaKara). RNA purification, reverse transcription, library construction, and sequencing were performed by Shanghai Majorbio Bio-pharm Biotechnology Co., Ltd. following the manufacturer's instructions (Illumina). The transcriptome library was prepared using the TruSeqTM RNA sample preparation kit (Illumina) with 1 μg of total RNA. mRNA was isolated using oligo(dT) beads, fragmented, and reverse transcribed into double-stranded cDNA using the SuperScript kit (Invitrogen) with random hexamer primers (Illumina). The cDNA underwent end-repair, phosphorylation, and “A” base addition as per the manufacturer's protocol. Libraries were size selected for 300 bp fragments on 2% low-range ultra agarose, followed by PCR amplification with Phusion DNA polymerase (NEB) for 15 cycles. The libraries were quantified using TBS380 and sequenced on the Illumina NovaSeq 6000 (2 × 150 bp read length).
2.7 Bioinformatics analyses
The KEGG Legacy, HALLMARK, and ImmuneSigDB gene sets were downloaded from the Molecular Signatures Database.25 The immune regulatory molecule26 and angiogenesis-related genes27 (poor-prognosis angiogenesis genes [PPAG] and good-prognosis angiogenesis genes [GPAG]) were obtained from previous studies. The ESTIMATEScore, ImmuneScore, StromalScore, and TumorPurity were evaluated using the ESTIMATE method.28 Immunological features, including presence of immune cells and activity of immune-related pathways, were determined using the GSVA package.29 Detailed information on gene enrichment of immune cells, immune-related pathways, TLS, and interferon (IFN) is provided in Table S1. The R package clusterProfiler was used for functional gene annotation.
2.8 Evaluation of prognostic value
Kaplan–Meier survival analysis was performed to evaluate the risk factors for DFS and CSS in RC patients. Univariate and multivariate Cox regression analyses were used to identify significant independent prognostic factors. A nomogram integrating four independent prognostic factors was created to estimate DFS probability in the PUMCH cohort (n = 679). Calibration curves were drawn to compare the predictive and actual survival probabilities at the 3 and 5 years to assess the nomogram's predictive performance. The predictive value of the nomogram was validated in the PLAGH cohort (n = 236).
2.9 Statistical analysis
All statistical analyses were performed using R software (version 4.2.1) and Prism (version 8.0). Categorical variables were assessed using the chi-square test and Fisher's exact test, and continuous variables were analyzed using the Mann–Whitney U test. The threshold for DFS was evaluated,30 and patients were divided into two groups based on whether their PIV, LNR, CEA, and CA19-9 values were above or below the optimal cutoff. All statistical analyses were two sided, with p < 0.05 indicating statistical significance. Figures were generated using R (version 4.2.1), Adobe Illustrator (version 26.0.1), and Prism (version 8.0) software.
3 RESULTS
3.1 Patients' clinicopathological characteristics and PIV
This study included 915 treatment-naïve RC patients who had undergone radical surgery (679 and 236 patients from the PUMCH and PLAGH cohorts, respectively). Overall, 558 (61%) were men, with a median age of 62 years (interquartile range [IQR], 55–69). The median follow-up time was 33.1 months (IQR, 25.6–49.68) and 60 months (IQR, 60–60) for the PUMCH and PLAGH cohorts, respectively. Demographic characteristics such as sex, tumor location, LNR, tumor grade, vascular invasion, perineural invasion, CEA levels, and tumor diameter were comparable between the cohorts (Table 1). However, the proportion of patients with older age (p < 0.001), pT4 (p = 0.018), pN+ (p = 0.009), tumor deposits (p = 0.025), and lower CA19-9 levels (p = 0.045) were higher in the PUMCH cohort (Table 1).
| Patients, no. (%) | ||||
|---|---|---|---|---|
| Variables | ALL (n = 915) | PUMCH (n = 679) | PLAGH (n = 236) | p-Value |
| Sex | 0.929 | |||
| Female | 357 (39) | 266 (39) | 91 (39) | |
| Male | 558 (61) | 413 (61) | 145 (61) | |
| Age, median (IQR), years | 62 (55, 69) | 64 (56, 70) | 60 (53, 65) | <0.001 |
| Tumor location | 0.207 | |||
| Low | 250 (27) | 176 (26) | 74 (31) | |
| Middle | 336 (37) | 250 (37) | 86 (36) | |
| Upper | 329 (36) | 253 (37) | 76 (32) | |
| T stage | 0.018 | |||
| T1-3 | 827 (90) | 604 (89) | 223 (94) | |
| T4 | 88 (10) | 75 (11) | 13 (6) | |
| N stage | 0.009 | |||
| No | 569 (62) | 405 (60) | 164 (69) | |
| Yes | 346 (38) | 274 (40) | 72 (31) | |
| LNR | 0.055 | |||
| High | 292 (32) | 229 (34) | 63 (27) | |
| Low | 623 (68) | 450 (66) | 173 (73) | |
| Tumor deposits | 0.025 | |||
| No | 797 (87) | 581 (86) | 216 (92) | |
| Yes | 118 (13) | 98 (14) | 20 (8) | |
| Stage | 0.032 | |||
| Stage1 | 284 (31) | 210 (31) | 74 (31) | |
| Stage2 | 283 (31) | 196 (29) | 87 (37) | |
| Stage3 | 348 (38) | 273 (40) | 75 (32) | |
| Tumor grade | 0.373 | |||
| G1-2 | 851 (93) | 628 (92) | 223 (94) | |
| G3 | 64 (7) | 51 (8) | 13 (6) | |
| Vascular | 0.124 | |||
| Invasion | 230 (25) | 180 (27) | 50 (21) | |
| No-invasion | 685 (75) | 499 (73) | 186 (79) | |
| Perineural | 0.771 | |||
| Invasion | 147 (16) | 111 (16) | 36 (15) | |
| No-invasion | 768 (84) | 568 (84) | 200 (85) | |
| CEA, median (IQR), ng/mL | 3.2 (1.9, 6.75) | 3.24 (2, 6.7) | 2.85 (1.58, 7.23) | 0.264 |
| CA19-9, median (IQR), U/mL | 11.1 (6.5, 19.85) | 10.8 (6.6, 18.7) | 12.2 (6.5, 23.13) | 0.045 |
| Tumor diameter, median (IQR), cm | 3.5 (2.5, 4.55) | 3.5 (2.5, 4.6) | 3.5 (2.5, 4.5) | 0.306 |
- Abbreviations: CA19-9, carbohydrate antigen 19–9; CEA, carcinoembryonic antigen; G1-2, grade well and moderate; G3, grade poor; IQR, interquartile range; LNR, lymph node ratio; PLAGH, 7th Medical Center of the PLA General Hospital; PUMCH, Peking Union Medical College Hospital; RC, rectal cancer.
3.2 Prognostic value of PIV in RC
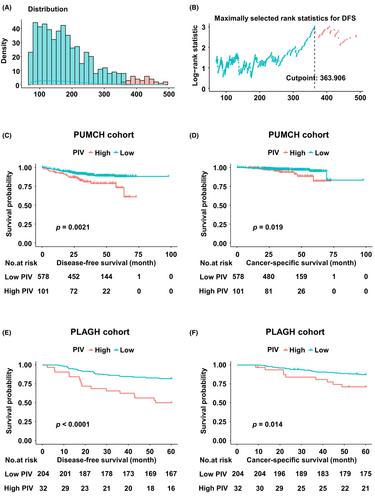
To investigate the prognostic value of PIV, Kaplan–Meier survival analysis was performed to explore its association with DFS and CSS. The distribution of PIV is shown in Figure 1A. The optimal cutoff value of PIV for DFS was 363.906 in the PUMCH cohort (Figure 1B). Patients were then categorized into PIV-high and PIV-low groups based on this cutoff value. Additionally, we evaluated the optimal cutoff values for other indicators (CEA, CA19-9, and LNR) for DFS in the PUMCH cohort, and patients were categorized into high and low groups based on these values in both the PUMCH and PLAGH cohorts (Table S2). In the PUMCH cohort, the PIV-high group exhibited poorer DFS (p = 0.0021; Figure 1C) and CSS (p = 0.019; Figure 1D). Similarly, in the PLAGH cohort, the PIV-high group demonstrated an inverse association with both DFS (p < 0.001; Figure 1E) and CSS (p = 0.014; Figure 1F).
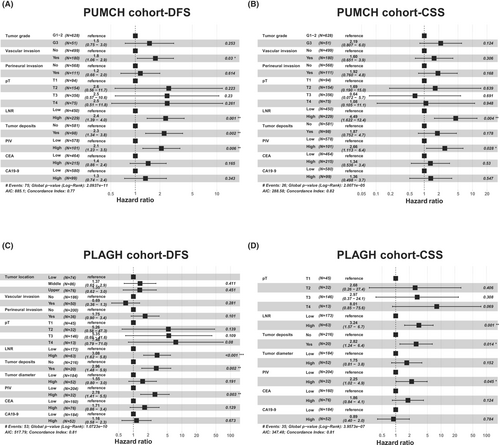
Multivariate Cox regression models were constructed to determine whether PIV was an independent prognostic factor. Specifically, univariate Cox regression analysis identified that PIV, tumor grade, vascular invasion, perineural invasion, pT, LNR, tumor deposits, CEA levels, and CA19-9 levels were associated with both DFS and CSS in the PUMCH cohort (Tables 2 and S3). Furthermore, univariate Cox regression analysis identified that PIV, tumor location, vascular invasion, perineural invasion, pT, LNR, tumor deposits, tumor diameter, CEA level, and CA19-9 levels were associated with DFS, and PIV, pT, LNR, tumor deposits, tumor diameter, CEA level, and CA19-9 level were associated with CSS in the PLAGH cohort (Tables 2 and S3). We constructed DFS- and CSS-based multivariate Cox models for both the PUMCH and PLAGH cohorts. In the PUMCH cohort, significant factors for DFS included PIV, LNR, tumor deposits, and vascular invasion (Figure 2A), and PIV and LNR were significant factors for CSS (Figure 2B). Furthermore, in the PLAGH cohort, PIV, LNR, and tumor deposits were significant predictors in both DFS- (Figure 2C) and CSS-based Cox models (Figure 2D). These results indicate that PIV levels are independent prognostic factors in RC.
| Variables | PUMCH (n = 679) | PLAGH (n = 236) | ||
|---|---|---|---|---|
| Univariable | Univariable | |||
| aHR (95% CI) | p-Value | aHR (95% CI) | p-Value | |
| Sex | ||||
| Female | 1 [Reference] | NA | 1 [Reference] | NA |
| Male | 1.22 (0.76–1.97) | 0.41 | 1.12 (0.64–1.96) | 0.703 |
| Age, years | ||||
| <65 | 1 [Reference] | NA | 1 [Reference] | NA |
| ≥65 | 1.11 (0.70–1.74) | 0.663 | 1.08 (0.58–2.01) | 0.82 |
| Tumor location | ||||
| Low | 1 [Reference] | NA | 1 [Reference] | NA |
| Middle | 0.96 (0.52–1.78) | 0.901 | 1.61 (0.77–3.39) | 0.206 |
| Upper | 1.41 (0.80–2.50) | 0.239 | 2.22 (1.08–4.55) | 0.03 |
| Tumor grade | ||||
| G1-2 | 1 [Reference] | NA | 1 [Reference] | NA |
| G3 | 2.43 (1.28–4.61) | 0.007 | 0.30 (0.04–2.19) | 0.237 |
| Vascular | ||||
| No-invasion | 1 [Reference] | NA | 1 [Reference] | NA |
| Invasion | 3.03 (1.92–4.76) | <0.001 | 2.10 (1.19–3.71) | 0.011 |
| Perineural | ||||
| No-invasion | 1 [Reference] | NA | 1 [Reference] | NA |
| Invasion | 2.65 (1.62–4.34) | <0.001 | 2.33 (1.26–4.29) | 0.007 |
| T stage | ||||
| T1 | 1 [Reference] | NA | 1 [Reference] | NA |
| T2 | 3.49 (0.77–15.73) | 0.104 | 7.40 (0.86–63.34) | 0.068 |
| T3 | 6.42 (1.56–26.47) | 0.01 | 15.62 (2.15–113.44) | 0.007 |
| T4 | 11.37 (2.61–49.44) | 0.001 | 18.09 (2.02–161.87) | 0.01 |
| LNR | ||||
| Low | 1 [Reference] | NA | 1 [Reference] | NA |
| High | 4.05 (2.52–6.52) | <0.001 | 4.11 (2.39–7.06) | <0.001 |
| Tumor deposits | ||||
| No | 1 [Reference] | NA | 1 [Reference] | NA |
| Yes | 3.61 (2.25–5.79) | <0.001 | 0.88 (0.59–1.31) | <0.001 |
| Tumor diameter | ||||
| <5 cm | 1 [Reference] | NA | 1 [Reference] | NA |
| ≥5 cm | 0.80 (0.44–1.42) | 0.44 | 2.76 (1.59–4.79) | <0.001 |
| PIV | ||||
| Low | 1 [Reference] | NA | 1 [Reference] | NA |
| High | 2.19 (1.31–3.65) | 0.003 | 3.38 (1.88–6.07) | <0.001 |
| CEA | ||||
| Low | 1 [Reference] | NA | 1 [Reference] | NA |
| High | 2.41 (1.53–3.79) | <0.001 | 4.59 (2.62–8.06) | <0.001 |
| CA19-9 | ||||
| Low | 1 [Reference] | NA | 1 [Reference] | NA |
| High | 2.20 (1.30–3.70) | 0.003 | 3.13 (1.82–5.40) | <0.001 |
- Abbrevitaions: aHR, adjusted hazard ratio; CA19-9, carbohydrate antigen 19–9; CEA, carcinoembryonic antigen; DFS, disease-free survival; G1-2, grade well and moderate; G3, grade poor; LNR, lymph node ratio; PIV, pan-immune-inflammation value; PLAGH, 7th Medical Center of the PLA General Hospital; PUMCH, Peking Union Medical College Hospital; RC, rectal cancer.
3.3 Pan-immune-inflammation value nomogram predicts RC prognosis
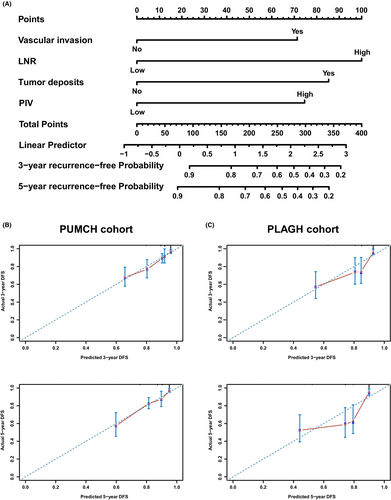
To enhance the prognosis prediction in RC patients, we developed a nomogram to predict DFS at 3 and 5 years based on multivariable Cox regression analysis in the PUMCH cohort. The nomogram included four independent prognostic factors: vascular invasion, tumor deposits, LNR, and PIV (Figure 3A). Calibration curves indicated good consistency between the actual and predicted probabilities of 3- and 5-year DFS in the PUMCH cohort (Figure 3B). To verify the predictive accuracy of the constructed nomogram, 236 RC patients from the PLAGH cohort were included as the external validation cohort. The calibration curve showed that the nomogram maintained good predictive value in the PLAGH cohort (Figure 3C). Collectively, these findings underscore the independent prognostic significance of PIV in RC patients and highlight the utility of the nomogram in identifying patients at high risk for recurrence and poor outcomes.
3.4 Pan-immune-inflammation value levels are associated with distinct clinical characteristics in RC
We further investigated the association between PIV and clinical and pathological factors in RC. In the PUMCH cohort, high PIV was significantly associated with male sex (male: 71 vs. 59%, p = 0.026), upper tumor location (upper: 50 vs. 35%, p = 0.021), elevated CEA levels (median [IQR]: 4.3 [2.2–8.17] vs. 3.12 [1.9–6.54], p = 0.01), and larger tumor diameter (median [IQR]: 4.6 [3–6] vs. 3.5 [2.5–4.5], p < 0.001) (Table 3). In the PLAGH cohort, high PIV was significantly associated with elevated CEA levels (median [IQR]: 10.1 [3.55–20.4] vs. 2.55 [1.5–5.73], p < 0.001), elevated CA19-9 levels (median [IQR]: 20.8 [9.88–61.55] vs. 11.4 [6.5–21.5], p = 0.006), and larger tumor diameter (median [IQR]: 4.75 [3.38–6] vs. 3.3 [2.4–4.5], p < 0.001) (Table S4).
| Patients, no. (%) | ||||
|---|---|---|---|---|
| Variables | ALL (n = 679) | PIV-high (n = 101) | PIV-low (n = 578) | p-Value |
| Sex | 0.026 | |||
| Female | 266 (39) | 29 (29) | 237 (41) | |
| Male | 413 (61) | 72 (71) | 341 (59) | |
| Age, median (IQR), years | 64 (56, 70) | 64 (58, 71) | 63 (56, 70) | 0.362 |
| Tumor location | 0.021 | |||
| Low | 176 (26) | 20 (20) | 156 (27) | |
| Middle | 250 (37) | 31 (31) | 219 (38) | |
| Upper | 253 (37) | 50 (50) | 203 (35) | |
| T stage | 0.125 | |||
| T1 | 94 (14) | 8 (8) | 86 (15) | |
| T2 | 154 (23) | 19 (19) | 135 (23) | |
| T3 | 356 (52) | 60 (59) | 296 (51) | |
| T4 | 75 (11) | 14 (14) | 61 (11) | |
| N stage | 0.53 | |||
| N0 | 405 (60) | 64 (63) | 341 (59) | |
| N1 | 200 (29) | 25 (25) | 175 (30) | |
| N2 | 74 (11) | 12 (12) | 62 (11) | |
| LNR | 0.898 | |||
| High | 229 (34) | 33 (33) | 196 (34) | |
| Low | 450 (66) | 68 (67) | 382 (66) | |
| Tumor deposits | 0.741 | |||
| No | 581 (86) | 88 (87) | 493 (85) | |
| Yes | 98 (14) | 13 (13) | 85 (15) | |
| Stage | 0.006 | |||
| Stage1 | 210 (31) | 22 (22) | 188 (33) | |
| Stage2 | 196 (29) | 42 (42) | 154 (27) | |
| Stage3 | 273 (40) | 37 (37) | 236 (41) | |
| Tumor grade | 0.657 | |||
| G1-2 | 628 (92) | 95 (94) | 533 (92) | |
| G3 | 51 (8) | 6 (6) | 45 (8) | |
| Vascular | 0.363 | |||
| Invasion | 180 (27) | 31 (31) | 149 (26) | |
| No-invasion | 499 (73) | 70 (69) | 429 (74) | |
| Perineural | 0.245 | |||
| Invasion | 111 (16) | 21 (21) | 90 (16) | |
| No-invasion | 568 (84) | 80 (79) | 488 (84) | |
| CEA, median (IQR), ng/mL | 3.24 (2, 6.7) | 4.3 (2.2, 8.17) | 3.12 (1.9, 6.54) | 0.01 |
| CA19-9, median (IQR), U/mL | 10.8 (6.6, 18.7) | 12.5 (7.9, 21.8) | 10.6 (6.43, 18.5) | 0.117 |
| Tumor diameter, median (IQR), cm | 3.5 (2.5, 4.6) | 4.6 (3, 6) | 3.5 (2.5, 4.5) | <0.001 |
- Abbreviations: CA19-9, carbohydrate antigen 19–9; CEA, carcinoembryonic antigen; G1-2, grade well and moderate; G3, grade poor; IQR, interquartile range; LNR, lymph node ratio; PIV, pan-immune-inflammation value; PUMCH, Peking Union Medical College Hospital RC, rectal cancer.
Logistic multivariable analysis provided additional insights. In the PUMCH cohort, high PIV was associated with larger tumor diameter (≥5 cm: adjusted odds ratio [aOR], 3.43; 95% CI, 2.11–5.56; p < 0.001, Table 4). In the PLAGH cohort, logistic multivariable analysis indicated that high PIV was associated with larger tumor diameter (≥5 cm: aOR, 4.05; 95% CI, 1.48–11.07; p = 0.006), upper tumor location (upper: aOR, 3.62; 95% CI, 1.16–11.31; p = 0.027), and elevated CEA levels (high: aOR, 7.06; 95% CI, 2.13–23.42; p = 0.001) (Table 4).
| PUMCH (n = 679) | PLAGH (n = 236) | |||
|---|---|---|---|---|
| Variables | aOR (95% CI) | p-Value | aOR (95% CI) | p-Value |
| Sex | ||||
| Male | 1 [Reference] | NA | 1 [Reference] | NA |
| Female | 1.50 (0.92–2.4) | 0.062 | 0.74 (0.31–1.80) | 0.513 |
| Age | ||||
| <65 | 1 [Reference] | NA | 1 [Reference] | NA |
| ≥65 | 1.17 (0.75–1.83) | 0.49 | 0.90 (0.31–2.57) | 0.842 |
| Location | ||||
| Low | 1 [Reference] | NA | 1 [Reference] | NA |
| Middle | 0.96 (0.51–1.80) | 0.902 | 1.54 (0.47–5.01) | 0.474 |
| Upper | 1.61 (0.88–2.95) | 0.124 | 3.62 (1.16–11.31) | 0.027 |
| Tumor grade | ||||
| G1-2 | 1 [Reference] | NA | 1 [Reference] | NA |
| G3 | 0.57 (0.22–1.47) | 0.244 | 0.74 (0.11–4.80) | 0.751 |
| Tumor diameter | ||||
| <5 cm | 1 [Reference] | NA | 1 [Reference] | NA |
| ≥5 cm | 3.43 (2.11–5.56) | <0.001 | 4.05 (1.48–11.07) | 0.006 |
| Vascular | ||||
| No-invasion | 1 [Reference] | NA | 1 [Reference] | NA |
| Invasion | 1.39 (0.81–2.38) | 0.234 | 1.08 (0.34–3.48) | 0.898 |
| Perineural | ||||
| No-invasion | 1 [Reference] | NA | 1 [Reference] | NA |
| Invasion | 1.18 (0.64–2.18) | 0.6 | 1.13 (0.34–3.73) | 0.844 |
| T stage | ||||
| T1 | 1 [Reference] | NA | 1 [Reference] | NA |
| T2 | 1.31 (0.53–3.24) | 0.56 | 0.29 (0.04–1.87) | 0.192 |
| T3 | 1.21 (0.51–2.86) | 0.665 | 0.27 (0.07–1.02) | 0.054 |
| T4 | 1.65 (0.58–4.76) | 0.35 | 0.48 (0.07–3.39) | 0.464 |
| LNR | ||||
| High | 1 [Reference] | NA | 1 [Reference] | NA |
| Low | 1.20 (0.70–2.04) | 0.509 | 2.59 (0.81–8.34) | 0.11 |
| Tumor deposits | ||||
| No | 1 [Reference] | NA | 1 [Reference] | NA |
| Yes | 0.66 (0.33–1.32) | 0.24 | 0.83 (0.20–3.39) | 0.794 |
| CEA | ||||
| Low | 1 [Reference] | NA | 1 [Reference] | NA |
| High | 1.43 (0.87–2.36) | 0.159 | 7.06 (2.13–23.42) | 0.001 |
| CA19-9 | ||||
| Low | 1 [Reference] | NA | 1 [Reference] | NA |
| High | 0.81 (0.42–1.59) | 0.54 | 1.30 (0.43–3.97) | 0.642 |
- Abbreviations: aHR, adjusted hazard ratio; CA19-9, carbohydrate antigen; 19–9; CEA, carcinoembryonic antigen; G1-2, grade well and moderate; G3, grade poor; LNR, lymph node ratio; PIV, pan-immune-inflammation value; PLAGH, 7th Medical Center of the PLA General Hospital; PUMCH, Peking Union Medical College Hospital; RC, rectal cancer.
3.5 Potential interplay between the antitumor immune responses and PIV in RC
Systemic inflammatory response may influence local immune responses via the peripheral blood.18, 19 We further evaluated the immunogenic signature according to PIV levels using RNA sequencing. KEGG pathway analysis identified several enriched pathways in the PIV-low group, including allograft rejection, antigen processing, and presentation (Figure 4A). Conversely, pathways enriched in the PIV-high group included ECM–receptor interactions, cancer pathways, axon guidance, and focal adhesion (Figure 4A). In the HALLMARK gene set analysis, the PIV-low group was associated with IFN pathways-related gene sets, whereas the PIV-high group was associated with gene sets related to angiogenesis, epithelial–mesenchymal transition (EMT), and hypoxia (Figure 4B). Notably, oncogenic gene sets such as KRAS and TGF-ß were strongly activated in the PIV-high group, while MYC-related gene sets were strongly suppressed in the PIV-low group (Figure 4B, Table S5). Furthermore, immunologic signature gene set analysis indicated that CD8+ T cell activation and regulatory T cell function-related gene sets were enriched in the PIV-low group (Figure 4C). In contrast, the inflammatory response-related gene sets were enriched in the PIV-high group (Figure 4C).
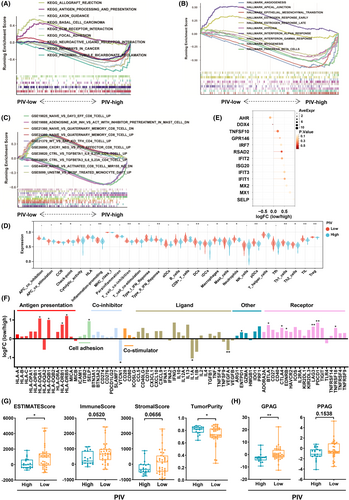
Moreover, we evaluated immune functions and immune cell infiltration according to the PIV status (Figure 4D). Compared with PIV-high patients, PIV-low patients exhibited higher levels of immune cell markers (B cells, dendritic cells [DCs], macrophages, mast cells, neutrophils, pDCs, T helper cells, Th1 cells, Th2 cells, TIL, and regulatory T cells [Tregs]) and increased activation of immune-related pathways (cytokine and cytokine receptor [CCR], checkpoint, inflammation promoting, T cell coinhibition, T cell costimulation, and IFN) (Figure 4D). Furthermore, we evaluated the expression of IFN pathway-related genes between the two groups and found that the PIV-low group had higher expression of IFN pathway-related genes (Figure 4E).
Next, we explored the differences in expression of immunomodulatory genes between the PIV-low and PIV-high groups. The expression of immune regulatory molecule genes was higher in the PIV-low group than in the PIV-high group (Figure 4F). In particular, genes related to antigen presentation (HLA-DQA1, HLA-DQB2, HLA-DRB1, and HLA-DRB5), cell adhesion (SELP), inhibitory immune checkpoint (PDCD1 [PD-1], CTLA4, HAVCR2 [TIM-3], LAG3, EDNRB, and BTLA), and agonistic immune checkpoint (TNFRSF18 [GITR]) were upregulated in the PIV-low group. Conversely, genes related to the inhibitory immune checkpoint (VTCN1) and immunomodulatory ligands (IL-1α and VEGF-ß) were upregulated in the PIV-high group.
To further characterize the TIME between the PIV-low and PIV-high groups, we evaluated the ESTIMATEScore (p < 0.05), ImmuneScore (p = 0.0520), StromalScore (p = 0.0656), and TumorPurity (p < 0.05) using the ESTIMATE method (Figure 4G). Additionally, we assessed the angiogenesis-related genes between the PIV-low and PIV-high groups by evaluating GPAG and PPAG. Compared with the PIV-high group, the expression of GPAG-related genes was upregulated in the PIV-low group, whereas the expression of PPAG-related genes was not significantly different between the two groups (Figure 4H).
3.6 Degree of immune cell infiltration patterns correlated with PIV levels in RC
RNA sequencing analysis revealed that low PIV was associated with an increased antitumor immune response; therefore, we evaluated the intensity of TILs, maturity of TLS, density of CD8+ cells, and density of HLA-I using H&E and IHC staining in the PLAGH cohort (n = 236), and the representative microscopic images are shown in Figure 5A–D.
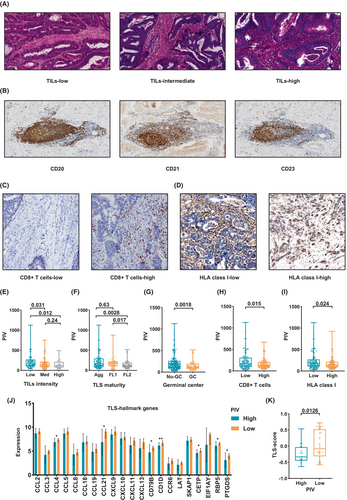
Among them, 31 (13%), 106 (45%), and 99 (42%) patients had high, intermediate, and low TILs, respectively. Notably, the TIL-low group exhibited a statistically significant increase in PIV compared with the TIL-intermediate (p = 0.031, Figure 5E) and TILs-high groups (p = 0.012, Figure 5E). However, no significant difference in PIV was observed between the TIL-high and TIL-intermediate groups (Figure 5E).
Regarding TLS maturity, 111 (47%), 57 (24%), and 68 (29%) patients had Agg, FL1, and FL2 TLS, respectively. Our findings revealed that PIV was significantly lower in the FL-2 TLS group than in the Agg TLS (p = 0.01) and FL-1 TLS (p = 0.019) groups (Figure 5F). However, no statistically significant differences in PIV were observed between the FL-1 and Agg TLS groups (Figure 5F). Additionally, the PIV was significantly lower in the GC TLS than in the non-GC TLS (p = 0.0018) groups (Figure 5G).
Subsequently, we quantified the density of CD8+ T cells in the patients, with a median CD8+ T cell density of 135.54 (IQR, 84.4–204.19). Patients were categorized into CD8-high and -low groups based on the median CD8+ T cell density. PIV was significantly lower in the CD8-high than in the CD8-low group (p = 0.015) (Figure 5H). Similarly, PIV was significantly lower in the HLA I-high group than in the HLA I-low group (p = 0.024) (Figure 5I).
Subsequently, we assessed the prognostic impact of tumor microenvironment indicators, TLS, TILs, CD8, and HLA-I, and found that all were associated with prognosis (Table S6).
Transcriptome sequencing was performed to evaluate the relationship between PIV and TLS hallmark gene sets, which revealed that compared with the PIV-high group, the expression levels of CCL4, CCL21, CD79B, CD1D, CETP, RBP5, and PTGDS were significantly increased in the PIV-low group (Figure 5J). Enrichment analysis further indicated a significantly increased TLS score expression level in the PIV-low compared with the PIV-high group (Figure 5K).
3.7 Association between PIV levels and sensitivity to immunotherapy in RC patients
We evaluated the predictive value of PIV in 16 RC patients treated with anti-PD-1 antibody at PLAGH. The baseline characteristics of the patients are summarized in Table S7. The pCR rate was 31.25% (5/16), with 6 (37.5%), 5 (31.25%), and 0 (0.0%) patients achieving a TRS of 1, 2, and 3, respectively. Notably, pre-ICI PIV levels were significantly associated with response to immunotherapy, such as responders versus nonresponders (141.0 vs. 302.5, p = 0.0192) and pCR versus non-pCR (115.6 vs. 171.3, p = 0.0380) (Figure 6A). Furthermore, post-ICI PIV levels were significantly associated with response to immunotherapy (responders: 134.3 vs. 372.5, p = 0.0133), although there was no significant difference between pCR and non-pCR (130.8 vs. 180.3, p = 0.0897) (Figure 6B).
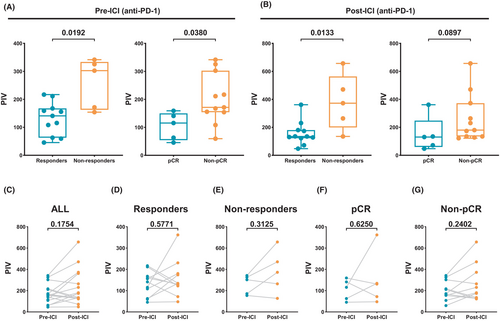
We further evaluated the patterns of ICI-induced changes in PIV. No significant difference was observed between pre- and post-ICI PIV in the ICI-treated group (p = 0.1754, Figure 6C), responders (p = 0.5771, Figure 6D), nonresponders (p = 0.3125, Figure 6E), pCR (p = 0.6250, Figure 6F), and non-pCR groups (p = 0.2402, Figure 6G).
4 DISCUSSION
Our findings underscore the prognostic significance of PIV in RC, highlighting its association with local immune responses. Through a comprehensive analysis of clinical outcomes, antitumor immune response, and the predictive potential of immunotherapy, our findings provide new insights that can enhance prognostic assessments and guide strategies for personalized treatment, especially for immunotherapy in RC patients.
The association between PIV and prognosis in resected CRC has been previously reported.15-17 In contrast, our study revealed that incorporating PIV level into prognostic models for RC substantially improves their predictive performance. Specifically, univariate Cox models identified that PIV level was significantly associated with both DFS and CSS in both cohorts. Furthermore, multivariate Cox regression analyses validated PIV as an independent predictor of both DFS and CSS, along with traditional factors such as LNR, tumor deposits, and vascular invasion. This highlights the potential of incorporating PIV into existing prognostic models to enhance their predictive accuracy. The development of a nomogram integrating PIV and other prognostic factors further validated its utility, demonstrating excellent calibration and discrimination in predicting 3-year and 5-year DFS.
A key finding of our study was the inverse association between PIV levels and markers of robust local immune response. The PIV-low group exhibited significant enrichment in pathways related to antigen processing and presentation and IFN, suggesting a more active antitumor immune response. We then specifically evaluated immune functions and immune cell infiltration based on the PIV status and found that the PIV-low group had elevated levels of immune cell markers and increased activation of immune-related pathways compared with the PIV-high group. Subsequently, we explored the differences in genes encoding immune regulatory molecules between the PIV-low and PIV-high groups and found that genes related to antigen presentation, cell adhesion, and immune checkpoints were upregulated in the PIV-low group. These data further support the hypothesis that PIV-low patients exhibit robust immune responses.
We further evaluated PIV and immune infiltration patterns in 236 RC patients from the PLAGH cohort using IHC and H&E staining. TILs, particularly CD8+ T cells, play key roles in antitumor immune responses.5 Our findings suggest that the PIV-low group included patients with high TIL intensity and high CD8+ T cell density. Moreover, we examined the relationship between PIV and TLS maturity. TLS are ectopic lymphoid formations that develop in chronic inflammatory conditions and are associated with improved clinical outcomes in various cancers.31 Our findings indicated that patients with mature TLS, particularly those with GC, had significantly lower PIV levels. GCs within the TLS are crucial for generating high-affinity antibodies and maintaining immunological memory, which enhances the antitumor immune response.32, 33 This finding suggests that the formation and maturation of TLS, particularly the development of GCs, plays a key role in the improved prognosis observed in PIV-low patients.
In general, tumor vessel normalization enhances immune infiltration and promotes T cell activation.27, 34 Bioinformatic analysis indicated that low PIV was associated with higher GAPA gene enrichment, suggesting that the PIV-low group exhibits characteristics of tumor vessel normalization. This also supports the notion of an association between SIR and local antitumor immune responses.
Conversely, patients in the PIV-high group were predominantly men, with an upper tumor location, elevated CEA levels, and a larger tumor diameter. Logistic multivariable analysis further confirmed the association between larger tumor diameter and elevated PIV. These findings are consistent with those of previous studies on CRC16, 35 and underscore the potential of PIV as a biomarker of tumor burden. Additionally, the PIV-high group exhibited enrichment in pathways associated with tumor progression and metastasis, such as ECM–receptor interaction, focal adhesion, EMT, angiogenesis, and hypoxia. The enrichment of oncogenic pathways such as KRAS and TGF-ß in the PIV-high group underscores the complexity of the tumor–immune interaction and suggests the potential of these pathways to drive both tumorigenesis and inflammation. These results suggest that a high PIV level is a hallmark of cancer cells.
Recently, SIR status, such as the NLR and PIV, can predict sensitivity to ICI in microsatellite instability-high (MSI-H) CRC.36, 37 Our study was the first to demonstrate that the expression of immune checkpoints was higher in the PIV-low group than in the PIV-high group. Therefore, we speculated that PIV may affect the response to immunotherapy. Our findings showed that lower pre-ICI or post-ICI PIV levels were associated with better responses to anti-PD-1 therapy in RC. This suggests that SIR, such as PIV, may influence the effectiveness of immunotherapy, with lower SIR statuses associated with improved treatment outcomes.
Our study had several limitations. First, it focused on resectable RC; therefore, its relevance to advanced or metastatic diseases remains unclear. Future research should evaluate the prognostic or predictive value of PIV in more advanced RC stages. Additionally, despite including a large cohort from two centers, the retrospective design limited causality assessment and introduced potential bias. However, further prospective studies are required to validate these findings.
In summary, our study identified PIV as a valuable prognostic biomarker for RC, reflecting local immune responses and predicting immunotherapy outcomes. Incorporating PIV into clinical practice can improve the prognostic accuracy and guide therapy, especially immunotherapy. Future research should explore the mechanisms linking PIV, TLS maturation, and antitumor immunity to optimize treatment strategies for RC patients.
AUTHOR CONTRIBUTIONS
Qianyu Wang: Conceptualization; data curation; formal analysis; project administration; resources; validation; writing – original draft. Wentao Zhong: Software; visualization; writing – review and editing. Yi Xiao: Resources; writing – review and editing. Guole Lin: Resources; writing – review and editing. Junyang Lu: Writing – review and editing. Lai Xu: Writing – review and editing. Guannan Zhang: Writing – review and editing. Aijun Liu: Methodology; resources; writing – review and editing. Junfeng Du: Funding acquisition; investigation; methodology; resources; software; supervision; visualization; writing – review and editing. Bin Wu: Conceptualization; funding acquisition; project administration; resources; supervision; writing – review and editing.
ACKNOWLEDGMENTS
We would like to extend our gratitude to the High-Performance Computing Platform of Peking Union Medical College Hospital for their support.
FUNDING INFORMATION
This work was supported by the National High-Level Hospital Clinical Research Funding (2022-PUMCH-B-003) and the Natural Science Foundation of Beijing (7242034).
CONFLICT OF INTEREST STATEMENT
The authors declare no conflicts of interest.
ETHICS STATEMENT
Approval of the research protocol by an Institutional Review Board: The ethics committees of PUMCH (I-24PJ0966) and PLAGH (S2024-050-01) approved this study.
Informed Consent: Written informed consent was obtained from all participants prior to the study.
Registry and the Registration No. of the study/trial: N/a.
Animal studies: N/a.


