Tumor-derived immunoglobulin like transcript 5 induces suppressive immunocyte infiltration in colorectal cancer
Abstract
Infiltration of immunosuppressive cells in the tumor microenvironment (TME) induced colorectal cancer (CRC) progression and its resistance to immunotherapy. Identification of tumor-specific factors to modulate inhibitory immunocyte infiltration would provide alternative and novel targets for CRC immunotherapy. Immunoglobulin-like transcript (ILT) 5 is a negative regulator of myeloid cell activation. However, its expression and functional role in solid tumors is still unknown. Using human CRC tissues and cell lines, we found that ILT5 was highly expressed in CRC cells compared with normal colorectal epithelial cells. Enriched ILT5 in tumor cells was correlated with advanced tumor stages and poor patient survival. Our subsequent in vitro and in vivo studies revealed that tumor-derived ILT5 inhibited the infiltration of T cells, especially that of CD8+ T cells in the TME, creating suppressive T-cell contexture. Furthermore, ILT5 directed M2-like polarization of tumor-associated macrophages (TAMs). Inhibition of tumor-derived ILT5 restored the immunosuppressive T-cell and TAM contexture, and restricted CRC progression. Our findings identified ILT5 expression in solid tumor cells for the first time and raised ILT5 as a potential immunotarget and prognostic predictor in CRC.
1 INTRODUCTION
Colorectal cancer (CRC) is the third most common and the second most deadly cancer worldwide, accounting for 1/10 of cancer-related deaths.1 Since most CRC patients are diagnosed as advanced and incurable disease stages, systemic therapy, including chemotherapy, radiotherapy, and targeted therapy, represents the dominant strategies for CRC treatment.2 Immunotherapy targeting programmed cell death protein 1 (PD-1)/programmd cell death 1 ligand 1(PD-L1) signaling has changed the paradigm of solid tumor treatment in the last decade.3 However, little clinical benefit has been observed in CRC patients because of the unique and suppressive immune microenvironment.4 Hence, there is an urgent need to explore the tumor-regulated immune environment and develop novel and alternative immunotargets.
Immunoglobulin-like transcript (ILT) 5, also known as LILRB3/LIR3/CD85a, is an inhibitory member of the activating and inhibitory immunoglobulin-like transcripts (ILTs) which modulate activation of immune cells.5, 6 ILT5 is mainly expressed in myeloid cells, including monocytes, macrophages, dendritic cells (DC), granulocytes, basophils, and eosinophils.7, 8 The ortholog of ILT5 in mouse is paired immunoglobulin-like receptor B (PIR-B).9 Ligation of ILT5 can recruit tyrosine phosphatase (SHP-1 or SHIP) containing an Src homology 2 (SH2) domain,5, 6, 10 subsequently suppress neutrophil and basophil activation,11, 12 inhibit Th1 cell proliferation and differentiation,13 induce M2 polarization of monocytes,14-16 and promote the antigen presentation of DCs.17 Therefore, ILT5 functions as a negative immune regulator in autoimmune diseases, sepsis, allotransplant tolerance, and HIV infection.12, 13, 17, 18 However, ILT5 expression in tumor cells and its function in antitumor immunity is still unknown.
T cells and tumor-associated macrophages (TAMs) are the most frequent and important immune cell components harnessing antitumor immune response in the tumor microenvironment (TME).19, 20 T cells are the major contributors and effectors in antitumor immune response. Among the myriad receptors expressed by T cells, CD3 is a unique molecule that is able to convert the presence of specific antigens into the intracellular signals necessary to trigger an immune response to tumors.21, 22 As effector T cells, CD8+ T cells recognize antigen CD3 molecules and eliminate tumors mainly by inducing cell death through perforin granzyme and Fas/Fas ligand pathways.23, 24 In addition to T cells, TAMs are another dominant immune cell component in the TME. They often exhibit the M2-like phenotype,25, 26 and have been reported to affect virtually almost every step of tumor cell metastasis, including invasion, vascularization, intravasation, extravasation, establishment of pre-metastatic niches, and maintenance of the circulating tumor cell survival.27 Therefore, we focused on ILT5-regulated T-cell and macrophage infiltration and phenotypes in the current study.
In our efforts to explore the expression and immunomodulatory function of ILT5 in CRC, we found that ILT5 was highly expressed in CRC cells and was an adverse prognostic biomarker. Tumor-derived ILT5 inhibited the infiltration of T cells, especially that of CD8+ T cells, and directed the M2-like polarization of TAMs, creating a suppressive tumor-immune microenvironment (TIME). Inhibition of tumor-derived ILT5 restored the immunosuppressive TME and restricted CRC progression. Our findings identified ILT5 expression in solid tumor cells for the first time and raised ILT5 as a potential immunotarget and prognostic predictor in CRC.
2 MATERIALS AND METHODS
2.1 Patients and tissue samples
With the approval of the review committee and the ethics committee, we collected paraffin-embedded tumors and normal tissues from 129 consecutive CRC patients between January 2013 and December 2015. All patients underwent primary surgeries without chemotherapy, radiotherapy or targeted therapy. The demographic and clinicopathological characteristics of patients are shown in Table 1.
| Clinicopathological parameters | ILT5 expression | χ 2 | p | |
|---|---|---|---|---|
| Low (n = 61) | High (n = 68) | |||
| T stage | ||||
| pT1-2 (n = 10) | 8 (80%) | 2 (20%) | 4.654 | <.05 |
| pT3-4 (n = 119) | 53 (44.5%) | 66 (55.5%) | ||
| Lymph node metastasis | ||||
| pN0 (n = 73) | 39 (53.4%) | 34 (46.6%) | 6.669 | <.05 |
| pN1 (n = 30) | 8 (26.7%) | 22 (73.3%) | ||
| pN2 (n = 26) | 14 (53.8%) | 12 (46.2%) | ||
| Metastasis (pM) | ||||
| pM0 (n = 123) | 61 (49.6%) | 62 (50.4%) | 5.645 | <.05 |
| pM1 (n = 6) | 0 (0.0%) | 6 (100.0%) | ||
| TNM stage | ||||
| Stage I (n = 8) | 7 (87.5%) | 1 (12.5%) | 10.02 | <.05 |
| Stage II (n = 63) | 32 (50.8%) | 31 (49.2%) | ||
| Stage III (n = 54) | 22 (40.7%) | 32 (59.3%) | ||
| Stage IV (n = 4) | 0 (0.0%) | 4 (100.0%) | ||
| Differentiation degree | ||||
| G1-2 (n = 127) | 60 (47.2%) | 67 (52.8%) | 0.005999 | .9383 |
| G3 (n = 2) | 1 (50.0%) | 1 (50.0%) | ||
| Age (media n = 69) | ||||
| ≤69 (n = 65) | 32 (49.2%) | 33 (50.8%) | 0.1986 | .6558 |
| >69 (n = 64) | 29 (45.3%) | 35 (54.7%) | ||
| Pathological type | ||||
| Mucous adenocarcinoma (n = 14) | 7 (50.0%) | 7 (50.0%) | 0.04638 | .8295 |
| No mucous adenocarcinoma (n = 115) | 54 (47.0%) | 61 (53.0%) | ||
| Tumor size (median = 5 cm) | ||||
| ≤5 (n = 65) | 33 (50.8%) | 32 (49.2%) | 0.7743 | .3789 |
| >5 (n = 64) | 28 (43.8%) | 36 (56.2%) | ||
| Gender | ||||
| Male (n = 86) | 40 (46.5%) | 46 (53.5%) | 0.0622 | .8031 |
| Female (n = 43) | 21 (48.8%) | 22 (51.2%) | ||
| Lymph-vascular space invasion | ||||
| Yes (n = 74) | 38 (51.4%) | 36 (48.6%) | 1.150 | .2835 |
| No (n = 55) | 23 (41.8%) | 32 (58.2%) | ||
- Abbreviations: CRC, colorectal cancer; ILT5, immunoglobulin-like transcript 5; M stage, distant metastasis; N stage, lymph node metastasis; pTNM, pathological TNM; T stage, invasion depth.
- The Significance of bold values was set at P<0.05 Statistical significant.
2.2 Immunohistochemical analysis
Immunohistochemical staining was used to detect the expression of ILT5, the infiltration of T-cell and macrophage subsets in paraffin-embedded human and mouse CRC tissues using immunohistochemical staining kit (zsbio; Cat No. SP-9000), as we previously described.28 The primary and secondary antibodies are listed in Table S1.
2.3 Evaluation of ILT5 expression and immune cell infiltration by immunohistochemical staining
Each slide was randomly intercepted to five visual fields under a 400× magnification microscope and evaluated by two independent researchers. ILT5 was determined according to the staining intensity and the percentage of positive cells. The staining intensity was defined as 0 = none, 1 = weak, 2 = intermediate, and 3 = strong. The percentage scores of positive cells were 1 (≤25%), 2 (26%–50%), 3 (51%–75%), and 4 (≥76%). The final score of the slide was determined by the product of the two scores. The cut-off scores for low and high ILT5 expression were <5 and ≥5, respectively. The number of cell infiltrations was calculated under a unified 400× microscope. The infiltration proportion of T cells was measured by the frequency of CD3+ T cells in total immune cells, and the frequency of different T-cell subsets was calculated by the fraction of CD4+/CD8+/FOXP3+/IFN-γ+ T cells in CD3+ T cells. The proportion of M2-like macrophages was calculated by the frequency of CD163+ cells in CD68. The average of T-cell count and the average percentage of M2-like TAMs were selected as the cut-off values of immune cell infiltration.
2.4 Immunofluorescence staining of ILT5 in CRC tissues
The expression of ILT5 in human CRC tissues was detected by immunofluorescence staining, as previously described.29 The antibodies used are shown in Table S1. The expression level of ILT5 was scored as 0 to 3 according to different fluorescence intensities, which were defined as 0 = none, 1 = weak, 2 = intermediate, and 3 = strong.
2.5 Bioinformatics analysis
Data series GSE33113 and GSE87211 from Gene Expression Omnibus (GEO) datasets were used to analysis the expression of ILT5 in colorectal cancers and corresponding normal tissues. Patient clinical data from GSE33113 was used for progression-free survival (PFS) analysis based on ILT5 expression. The Tumor Immune Estimation Resource (TIMER2.0) online tool and GEPIA2 online tool were used to analyze the correlation of ILT5 with the infiltration level of M2-like macrophage.30
2.6 Tumor cell lines and PIR-B overexpression/knockdown
The human CRC cell lines DLD-1, SW620, SW480, HT29, HCT116, and LOVO and mouse CRC cell line MC38 were purchased from the cell resource center of the Chinese Academy of Sciences. Human colon epithelial cell line CCD-18Co and NCM460 were purchased from Procell Life Science & Technology Company and the American Type Culture Collection, respectively. All the cell lines were cultured in RPMI-1640 or Dulbecco’ s modified Eagle’s medium supplemented with 10% fetal bovine serum. Lentiviruses for paired immunoglobulin-like receptor B (PIR-B) overexpression or knockdown were purchased from Genecopoeia. MC38 was seeded in a six-well plate at an initial concentration of 1 × 10⁵ cells/well. After 24 h, 1 ml of fresh medium containing PIR-B overexpression/knockdown or control lentiviruses (MOI: 5–10) was added to each well. Forty-eight hours after transfection, 2 μg/ml puromycin was added for 5 days to purify PIR-B overexpression/knockdown MC38 cells.
2.7 RNA extraction and real-time quantitative PCR
RNA extraction and real-time PCR were performed to analyze ILT5 and PIR-B mRNA expression using our previous protocol.29 Their expression levels were normalized to that of glyceraldehyde-3-phosphate dehydrogenase (GAPDH). The used primers are listed in Table S1.
2.8 Western blot analysis
Western blot analysis of ILT5 expression in CRC and colonic epithelial cell lines was performed following our previous protocol.29 The antibodies used are listed in Table S1.
2.9 Flow cytometric analysis
The markers of mouse monocytes and T cells were determined by flow cytometry after surface staining with specific antibodies conjugated with different fluorescence. The antibodies are listed in Table S1. The stained cells were analyzed on a FACS Calibur flow cytometer (BD Bioscience) and data were analyzed using FlowJo10 software (Tree Star, Inc.).
2.10 In vivo study
With the approval of the animal welfare ethics committee of Jinan Central Hospital, female C57BL/6 mice (6–8 weeks old) were purchased from Beijing Viewsolid Biotechnology Company and raised under specific pathogen free (SPF) conditions. Mice were randomly divided into four groups (n = 5 mice/group). MC38 cells infected with control lentiviruses or PIR-B overexpression/knockdown lentiviruses were subcutaneously injected into the flanks of mice (1 × 10⁶ cells/mouse). The tumor size was measured every 3 or 4 days, and the tumor volume was calculated as 0.5 × length × width2.
When the tumors grew to the size limit (20 mm), the mice were euthanized, and the tumors were separated and weighed. Peripheral blood was isolated to analyze the frequency of immune cell infiltration by flow cytometry. Immunohistochemical (IHC) staining was used to determine the immune cell infiltration in tumor tissues.
2.11 Survival follow-up and statistical analysis
All patients were followed up to obtain survival data. The last follow-up date was August 20, 2021. Statistical analysis was performed using GraphPad Prism 8.0 software (GraphPad Software Inc.). The correlation of ILT5 expression with clinicopathological features was analyzed using Fisher's exact test, and the intergroup differences were assessed by unpaired Student's t-test. Kaplan–Meier and log-rank tests were used to plot the survival curves. Statistical significance was set at p < 0.05.
3 RESULT
3.1 ILT5 is highly expressed in colorectal cancer
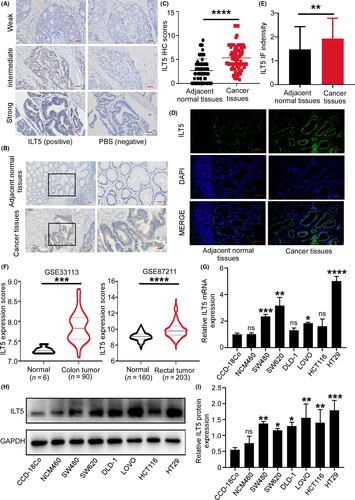
We collected 129 paraffin-embedded tumor tissues and 70 corresponding adjacent normal tissues from CRC patients, and evaluated ILT5 expression by IHC staining. We found that ILT5 was mainly expressed in the cytoplasm of CRC cells at different levels (Figure 1A). We next compared the difference of ILT5 levels in tumor cells and adjacent normal epithelial cells. As shown in Figure 1B,C, tumor cells displayed significantly higher ILT5 expression than normal epithelial cells. To further confirm specific ILT5 expression in CRC cells, we used a different ILT5 antibody clone and performed immunofluorescence staining of CRC tissues. As expected, ILT5 expression was markedly higher in CRC cells than in normal epithelial cells (Figure 1D,E). We also determined ILT5 expression in a colon cancer and a rectal cancer dataset of the GEO database. As shown in Figure 1F, both colon and rectal cancer tissues showed significantly improved ILT5 expression compared with corresponding normal tissues. To further verify tumor-specific ILT5 expression, we examined ILT5 in six CRC cell lines and two colorectal epithelial cell lines (CCD-18Co and NCM460) at mRNA and protein levels. We found that the mRNA expression of ILT5 was much higher in most CRC cell lines compared with that in CCD-18Co and NCM460 (Figure 1G). Meanwhile, almost all tumor cell lines showed significantly increased ILT5 protein expression relevant to CCD-18Co and NCM460 by western blot analysis (Figure 1H,I). Collectively, ILT5 is highly expressed in CRC cells.
3.2 Tumor-derived ILT5 predicts advanced diseases and poor patient survival
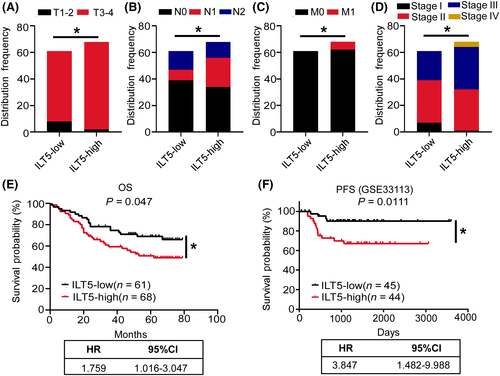
To determine the significance of ILT5 expression, we analyzed the clinicopathological characteristics and survival of 129 CRC patients based on ILT5 levels (Table 1). We found that compared with patients in ILT5-low group, those in the ILT5-high group displayed deeper tumor invasion (Figure 2A), more regional lymph node involvement (Figure 2B), more frequent distant metastasis (Figure 2C), and advanced TNM stages (Figure 2D). The survival analysis revealed that patients in the ILT5-low group had superior overall survival (OS) compared with those in ILT5-high group (Figure 2E). We also analyzed the predictive value of ILT5 on PFS using the GEO database. As expected, low ILT5 expression was correlated with prolonged PFS (Figure 2F). Taken together, enriched ILT5 in CRC predicts advanced diseases and poor patient survival.
3.3 ILT5 expression is negatively correlated with T-cell infiltration
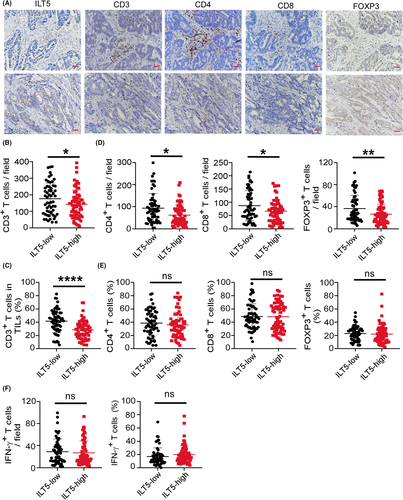
Since T cells are the most important regulator and effectors for tumor eradication, we investigated the correlation of ILT5 expression with T-cell density and subset distribution by IHC. We found that in CRC tissues, high ILT5 expression was correlated with decreased CD3+ T-cell infiltration in the TME (Figure 3A–C). Then we explored ILT5-directed T cell subset distribution by detecting CD4+, CD8+, and FOXP3+ T-cell population. As shown in Figure 3D, the enrichment of ILT5 was negatively correlated with the number of CD4+ T cells, CD8+ T cells, and FOXP3+ T cells in the TME. However, the proportion of these T-cell subsets in total T cells was not significantly different (Figure 3E), suggesting that tumor-derived ILT5 might reduce T-cell recruitment rather than regulate its differentiation. To explore whether ILT5 impacted the killing ability of T cells, we analyzed IFN-γ levels in T cells based on ILT5 levels. Unfortunately, we did not observe a difference in T-cell-derived IFN-γ between the two groups (Figure 3F), suggesting that T-cell function was not markedly altered by ILT5. These findings suggest that ILT5 prevents T-cell infiltration in the TME of CRC, but does not affect T-cell subset distribution and killing ability.
3.4 High ILT5 expression in combination with decreased CD3+/CD8+ T cells is a stronger indicator for poor patient outcomes
To address the clinical significance of ILT5-orchestrated T-cell infiltration, we determined patient OS and clinicopathological features depending on the infiltration number of different T-cell subsets. We found that patients with high CD3+ T-cell infiltration (CD3-high group) showed beneficial OS compared with their CD3-low counterparts (Figure 4A). We also observed deeper tumor invasion, more lymph node metastasis, and advanced TNM stage in CD3-low patients compared with the CD3-high group, although without statistical significance (Figure S1A–C). it is likely that low CD8+ T-cell infiltration in the TME is correlated with poor patient OS (Figure 4B), as well as deeper tumor invasion (Figure 4C), advanced lymph node metastasis, and TNM stage (Figure S1D,E). However, we did not observe a significant survival difference based on CD4+ T-cell and FOXP3+ T-cell density (data not shown), suggesting their negligible clinical value.
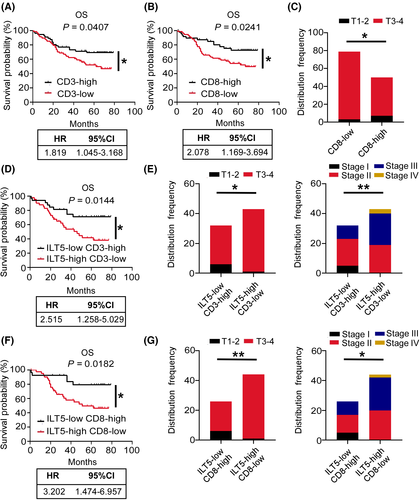
Next, we analyzed patient survival based on combined ILT5 expression and CD3+ T/CD8+ T-cell infiltration. The patients were classified into four subgroups based on the level of ILT5 expression and infiltrating CD3+ T cells: ILT5-high CD3-high (n = 25), ILT5-high CD3-low (n = 43), ILT5-low CD3-high (n = 32), and ILT5-low CD3-low (n = 29). The results showed that patients in the ILT5-low CD3-high group had significant longer OS than those in ILT5-high CD3-low group, with a larger hazard ratio (HR) of OS compared with ILT5 expression or CD3+ T-cell density alone, suggesting that the combined biomarkers are stronger indicators of patient survival (Figure 4D). In addition, the combination of ILT5-high and CD3-low predicted advanced invasive depth and TNM stages (Figure 4E). Similarly, four subgroups were generated based on ILT5 expression and CD8+ T-cell infiltration: ILT5-high CD8-high (n = 24), ILT5-high CD8-low (n = 44), ILT5-low CD8-high (n = 26), and ILT5-low CD8-low (n = 35). Patient survival based on ILT5 expression and CD8+ T-cell infiltration showed a similar trend to that of ILT5 and CD3+ T cells (Figure 4F). The ILT5-high CD8-low group also showed advanced invasive depth and TNM stages (Figure 4G). Altogether, ILT5 overexpression in CRC cancer leads to the reduction of CD3+ and CD8+ T-cell infiltration, which are independent predictors of poor patient survival. The combination of CD3+/CD8+ T and ILT5 could better predict the prognosis and pathological stage of patients.
3.5 ILT5 overexpression predicts M2-like polarization of TAMs
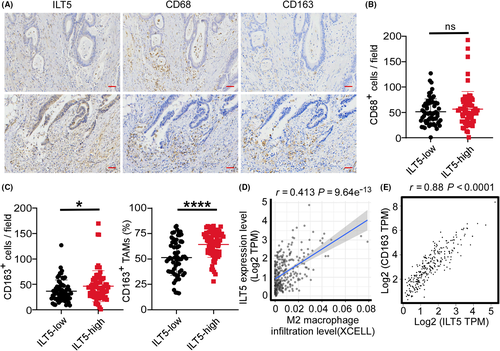
TAMs, usually polarized to M2-like phenotype by TME, are the most frequent and crucial pro-tumoral immune cells in CRC. To probe into ILT5-directed TAM infiltration and subset distribution, we performed IHC staining of CD68 and CD163 in 129 cases of CRC. Although we did not find an obvious association between ILT5 expression and CD68+ macrophage density (Figure 5A,B), we observed remarkably increased density and proportion of M2-like TAMs (CD163+) in the TME of ILT5-high patients compared with the ILT5-low counterpart (Figure 5A,C). Analysis of the TIMER2.0 and GEPIA2 databases yielded similar results showing that ILT5 expression was positively correlated with the infiltration of M2-like TAMs (Figure 5D,E). Altogether, our results indicate that ILT5 expression is positively correlated with the density of M2-like TAMs.
3.6 ILT5-directed M2-like polarization of TAMs indicates poor patient outcomes
To further explore the significance of ILT5-regulated TAM polarization, we analyzed the clinicopathological parameters and OS in CRC patients depending on M2-like macrophages. The results showed that patients in the M2-high group had poorer OS, more advanced invasion depth, regional lymph node metastasis, and TNM stages (Figure 6A,B), indicating M2-like macrophage as a predictor of poor outcome. In addition, we compared the divergence of clinical characteristics and patient survival based on combined ILT5 expression and M2-like TAM density. As expected, patients with high ILT5 expression as well as enriched M2-like TAMs displayed a poorer OS and a higher probability for advanced invasion depth, regional lymph node metastasis and TNM stages than their ILT5-low M2-low counterparts (Figure 6C,D). These results suggest that high ILT5 expression predicted the M2-like polarization of TAMs, which is an unfavorable indicator for patient outcomes.

3.7 PIR-B induces immunosuppressive T cell/TAM contexture and tumor growth.
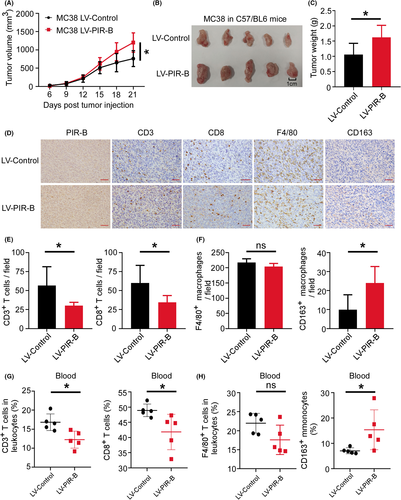
To verify ILT5-regulated TIME in vivo, we established a CRC transplantation model in C57BL/6 mice using MC38 cells. First, 1 × 10⁶ MC38 cells transfected with PIR-B overexpression or control lentiviruses were subcutaneously injected into the right flank of C57BL/6 mice. The efficiency of the PIR-B overexpression was determined by real-time PCR and western blot analyses (Figure S2A–C). When the tumors grew to the size limit (length 20 mm), the mice were euthanized, then the tumor and peripheral blood were isolated for subsequent experimentation. We found that PIR-B overexpression accelerated tumor growth relative to the control group (Figure 7A,B). The final tumor weight in each group revealed similar results (Figure 7C). Mouse tumors were wrapped in wax blocks and sectioned for immunohistochemical staining. As shown in Figure 7D–F, tumor tissues with PIR-B overexpression showed significantly decreased CD3+ and CD8+ T-cell infiltration, but increased M2-like TAM densities. We also determined the immunocyte subsets in peripheral blood by flow cytometry analysis. As shown in Figure 7G, PIR-B overexpression decreased the proportion of CD3+ and CD8+ T cells in leukocytes from peripheral blood, but increased CD163+ monocyte frequencies (Figure 7H). These results suggest that ILT5 prevents the infiltration of CD3+ and CD8+ T cells, and induces the M2-like polarization of TAMs, contributing to immunosuppressive TME and CRC growth.
3.8 PIR-B inhibition prevented immunosuppressive TME and restricted CRC progression
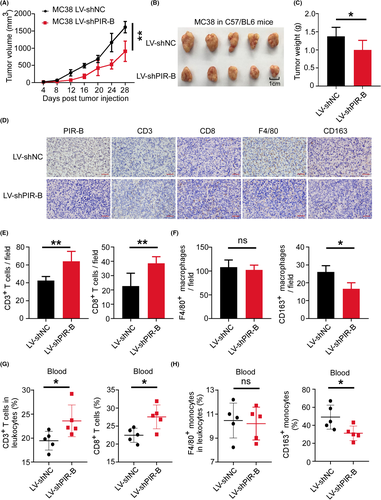
To further clarify the antitumor effect of ILT5 inhibition, we established tumor treatment models in C57BL/6 mice using PIR-B knockdown or control MC38 cells. The efficiency of PIR-B knockdown was determined by real-time PCR and western blot analyses (Figure S2D–F). We found that PIR-B knockdown slowed down the tumor growth compared with that in the control group (Figure 8A–C). The immunohistochemical analysis of final tumor tissues in the two groups showed that PIR-B inhibition increased the infiltration of CD3+ and CD8+ T cells, but decreased M2-like TAM densities (Figure 8D–F). Our flow cytometric analysis of peripheral blood revealed similar results. ILT5 inhibition augmented the frequency of CD3+ and CD8+ T cells, but diminished the fraction of M2-like monocytes in peripheral blood (Figure 8G,H). These results suggest that ILT5 inhibition prevents immunosuppressive TME and potentially represses CRC progression. ILT5 might function as a promising target for CRC immunotherapy.
4 DISCUSSION
Current immunotherapy targeting PD-1 and PD-L1 pathways has largely changed the paradigm of treatments for most solid tumors. However, only 4%–5% of advanced CRC patients who have deficient mismatch repair (dMMR) or high microsatellite instability (MSI-H) may benefit from immunotherapy due to immunosuppressive TME and insufficient T-cell infiltration.4, 31 Therefore, exploring novel immunotargets to reverse suppressive TME and enhance T-cell infiltration is a potential strategy to develop alternative immunotherapeutics in CRC. Here, we innovatively identified ILT5 expression in CRC cells, delineated its role in manipulating immunosuppressive T-cell and TAM contexture, and proposed ILT5 as a potential immunotarget for CRC therapy. In addition, our in vivo studies indicated that blockage of ILT5 can significantly reverse pro-tumoral TIME and prevent CRC progression.
ILT5 is an immunosuppressive molecule highly expressed in myeloid cells, including monocytes, macrophages, DCs, and granulocytes.7, 8 Previous studies have widely reported its function in sepsis, HIV infection, and rheumatoid arthritis.13, 17, 32 Patients with sepsis or HIV infection showed increased ILT5+ immune cells, indicating its immunosuppressive effect.13, 17 However, whether ILT5 is expressed in cancer cells is unknown. Its functional role in modulating antitumor immune response is also unclear. Here, we are the first to report ILT5 expression in solid tumors. In our efforts to address its clinical significance in CRC progression, we found that enriched ILT5 predicted unfavorable survival and advanced tumor stages, raising ILT5 as an adverse prognostic indicator. As a canonical immunosuppressor, we speculated that ILT5 might orchestrate an antitumor immune environment. We focused on the most important immune cell components in the TME, T cells and TAMs, to explore ILT5-regulated TIME. As expected, ILT5 inhibited T-cell infiltration but promoted M2-like TAM accumulation, suggesting the crucial role of ILT5 in creating an inhibitory TIME.
T cells contain heterogeneous subsets either activating or inhibiting immune response, which mainly include CD4+ T cells, CD8+ T cells, and FOXP3+ Treg cells.33-35 Tumor infiltrates with CD3+ and CD8+ T cells are the immune parameters most consistently and strongly associated with good clinical outcome in CRC.36 Based on these findings, different scoring systems evaluating lymphocyte infiltrates have been used as useful tools in the prediction of disease progression and efficacy of immunotherapy.37, 38 Consistently, we found the density of CD3+ and CD8+ T cells in CRC indicated favorable patient survival. Meanwhile, we observed that tumor-derived ILT5 restricted CD3+ and CD8+ T-cell infiltration in the TME, partially explaining the mechanism for ILT5-regulated immunosuppression. We also identified decreased CD4+ and FOXP3+ T-cell infiltrates in patients with high ILT5 expression. Unexpectedly, no connection was built between CD4+/FOXP3+ T-cell density and patient outcome based on our data. In recent years, the diversity of CD4+ T-cell form and function has been discovered.39, 40 CD4+ T cells might compose totally opposing subsets with lineage diversity and functional heterogeneity,41 so the prognostic value of CD4+ T-cell density might depend on the dynamic equilibrium among these different subsets, which is difficult to delineate. Similarly, the prognostic impact of Treg cell infiltration in CRC is also controversial owing to the heterogeneous subgroups which contribute either to progression or to the inhibition of CRC.42-44 These findings partially support our results. Collectively, our results indicate tumor cell-derived ILT5 is a suppressor of T-cell immunity and mediates the immune escape of CRC.
TAMs are critical immune infiltrates in CRC. In general, they can be classified into two pools, namely, M1- and M2-like TAMs.45 While M1-like TAMs promote antitumor immune responses by regulating antigen presentation and secreting proinflammatory cytokines,46 M2-like TAMs promote tumor progression by inducing tumor growth, invasion, vascularization, and immune escape.47-51 The infiltration of M2-like TAMs in CRC tissue is an adverse prognostic factor for CRC patients.47, 52, 53 Our current study also identified the causative links between ILT5 expression and M2-like TAM infiltration, as illustrated by in vitro and in vivo studies. Since the total CD68+ TAMs was not altered by ILT5 modulation, we proposed that ILT5 might harness the polarization of TAMs towards M2-like phenotype, as revealed by high-resolution transcriptome sequencing of human macrophages.15, 16 These results provide another potential mechanism for ILT5-regulated tumor progression.
In summary, ILT5 is enriched in CRC cells, functioning as a negative prognostic biomarker. ILT5 inhibits the infiltration of CD3+ and CD8+ T cells and induces M2-like polarization of TAMs, creating immunosuppressive TME for CRC progression. ILT5 is a potential and novel immunotarget for CRC immunotherapy.
ACKNOWLEDGEMENTS
This work was supported by the 70th China Postdoctoral Science Foundation (2021M700054), the Shandong Provincial Natural Science Foundation (ZR202103040716, ZR2019MH042), the National Natural Science Foundation of China (82103340, 81902919), and the Jinan Science and Technology Development Program (201907110).
DISCLOSURE
The authors have no conflict of interest to declare. All authors have read the journal's authorship agreement. The manuscript has been reviewed by and approved by all named authors.


