HIV and prior exposure to antiretroviral therapy alter tumour composition and tumour: T-cell associations in diffuse large B-cell lymphoma
Summary
Diffuse large B-cell lymphoma (DLBCL) is the most common subtype of lymphoma worldwide, accounting for up to 40% of new non-Hodgkin Lymphoma (NHL) globally. People living with HIV are up to 17 times more likely to develop NHL, and as such, DLBCL is the leading cause of cancer death in this high-risk population. While histologically indistinguishable, HIV-associated (HIV+) and HIV-negative (HIV−) DLBCL are molecularly distinct, and biological differences may have implications for the development of future therapeutic interventions. Further, the impact of immunologic differences in people with HIV, including preceding ART, remains largely unknown. Here, we investigate the impact of HIV infection and ART exposure on the clinical features of DLBCL and T-cell immune response by performing imaging mass cytometry on our unique patient cohort in Malawi. In this cohort, HIV infection is positively prognostic, and HIV+/ART-naïve patients have the best outcomes. No established biomarkers other than Ki67 are associated with HIV or ART status, and the only tumour-intrinsic biomarkers that remain prognostic are MYC and MYC/BCL2 protein co-expression. Finally, TCR clonality is associated with distinct tumour-T cell interactions by HIV/ART status, indicating differential anti-tumour immune responses. We demonstrate previously undescribed HIV and ART-related differences in the DLBCL tumour microenvironment.
Graphical Abstract
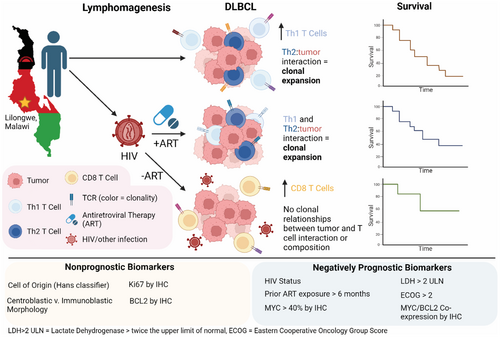
Diffuse large B-cell lymphoma (DLBCL) is the most common subtype of lymphoma in both HIV+ and HIV− patients. Data from a cohort of patients in Malawi, where HIV is endemic, revealed that both HIV and exposure to antiretroviral therapy (ART) prior to DLBCL diagnosis significantly alter the tumour microenvironment and T-cell–tumour associations. While HIV-tumours in our cohort are characterized by Th2-driven T cell expansions, HIV+/ART-experienced tumours also reflect a Th1 response. Further, HIV+/ART-naïve patients had the highest overall survival, and while these tumours exhibit increased CD8+ T-cell presence, they lack tumour-driven clonal expansions. Finally, cell of origin and morphological classifications failed to associate with or predict outcome, while HIV and ART exposure, MYC expression and MYC/BCL2 co-expression by IHC remained negatively prognostic.
INTRODUCTION
Human immunodeficiency virus (HIV) affected nearly 40 million people globally in 2022,1 and prevalence is predicted to increase, with the greatest burden occurring in Africa and the US.2 While the implementation of antiretroviral therapy (ART) has allowed a greater life expectancy for people with HIV (PWH), cancer has become a leading cause of death in PWH.3-5 HIV infection leads to impaired systemic immunity, genetic alterations, susceptibility to oncogenic viral infections and chronic B-cell activation, all of which contribute to increased risk of malignancy.6 PWH have an 11–17-fold increased risk of developing non-Hodgkin lymphoma compared to HIV-uninfected (HIV−) individuals of which diffuse large B-cell lymphoma (DLBCL) is the most common lymphoma subtype.6-8
Over the past two decades, extensive molecular characterization of HIV− DLBCL has identified biologically and therapeutically relevant genomic subtypes of HIV− DLBCL with clinically meaningful biomarkers.9-11 Yet, while histologically indistinguishable and treated similarly, DLBCL arising in PWH (HIV+ DLBCL) exhibits distinct genetic and transcriptomic profiles compared to HIV− DLBCL, suggesting an impact of HIV on tumourigenesis and immune response.12, 13 Additionally, increased HIV viraemia load at 6 months post DLBCL diagnosis has been linked to higher mortality rates at 5 years, implicating a role for ART in shaping tumour response.14 Though the high incidence of DLBCL in HIV+ populations is well established, the specific impact of HIV and ART on the tumour itself, as well as biomarker applicability, remains poorly understood.
Despite significant progress in understanding tumour–host interactions in HIV− DLBCL, the impacts of HIV and ART on the DLBCL tumour microenvironment (TME) remain understudied.15 Previous work has identified differences in HIV+ compared to HIV− DLBCLs, with the former being more proliferative, demonstrating increased angiogenic markers, decreased CD4+ T cells and enrichment of CD8+ T cells.16-18 Yet, the functionality and clinical impact of these cells and tumour phenotypes remain unknown. Both HIV and cancer have been shown to independently induce a chronic immune response, resulting in a dysfunctional T cell state known as T cell exhaustion.19 Modern immunotherapies utilize this response by targeting co-inhibitory ‘checkpoint’ receptors, such as PD-1, TIM3 and LAG3, thereby preventing or reversing T-cell exhaustion.20 Further, ART has been shown to partially reduce T-cell exhaustion, though this has yet to be studied in the concomitant context of HIV and cancer.21 Despite the high incidence of DLBCL in PWH, and the intrinsic link between Tex, HIV and anti-tumour immune response, the impact of HIV and ART on the TME and tumour immune response is poorly understood.
Finally, recent studies have established the clinical relevance of spatially defined tumour architecture, providing new evidence that the potentially targetable heterogeneity of DLBCL is driven by the absence or presence of immune cells within the TME.22, 23 Given the known impacts of HIV on systemic immunity and, thus, the unique pressures under which tumours develop in PWH, it is critically important to characterize tumour–host interactions to improve outcomes for this vulnerable population worldwide.
In this study, we aimed to characterize the TME of HIV−, HIV+/ART-experienced and HIV+/ART-naïve DLBCL. This work is enabled by longstanding clinical research collaboration in Malawi, with extremely limited public sector health care resources and high HIV prevalence, providing insight into lymphomagenesis and tumour–host interactions under varying degrees of immune pressure.13, 14, 24-29 This unique patient cohort allows us to study DLBCL arising in HIV−, HIV+/ART-naïve and HIV+/ART-experienced patients as a comparative model system to investigate the tumour microenvironment and T-cell responses in DLBCL to address critical gaps in tumour immunology.
METHODS
Kamuzu central hospital lymphoma study
The KCH Lymphoma Study has prospectively enrolled all patients with newly diagnosed pathologically confirmed lymphoproliferative disorders at a national teaching hospital in Lilongwe, Malawi since 2013 (NCT02835911).14, 24 All patients provided written informed consent prior to enrolment. All patients were treated with CHOP (cyclophosphamide, doxorubicin, vincristine and prednisone), the current standard of care in Africa, during the study period, and a subset of patients (n = 34) also received rituximab as part of a previously reported clinical trial (NCT02660710).24, 29 Treatment toxicity for patients included in this cohort has been previously reported.28, 29 Consolidative radiotherapy was not available in Malawi during the study period for persistent or bulky disease. Patients with relapsed or refractory disease were treated with salvage chemotherapy regimens including ifosfamide, etoposide and cisplatin or gemcitabine plus oxaliplatin.30 Patients who were able to achieve remission with salvage chemotherapy were referred to the Malawi Ministry of Health for autologous stem cell transplant or alternative therapies outside the country but this was infrequently completed. HIV+ patients continued or initiated ART at the time of lymphoma diagnosis. Patients who had been prescribed ART for at least 6 months prior to lymphoma diagnosis and study enrolment were categorized as ‘ART-experienced’ (ART-exp.), while those who had been prescribed ART for less than 6 months prior to enrolment, or who were newly diagnosed with HIV, with categorized as ‘ART-naïve’. All patients met the following inclusion criteria: enrolled between 2013 and 2021, over 18 years of age at the time of enrolment, histologically confirmed de novo DLBCL and known ART duration. Patients were followed every 3 months for the first 2 years and then either every 6 months in person or every 2 months by phone until 5 years follow-up, as previously described, with censoring occurring on 20 March 2023.28, 29 No patients were lost to follow-up. Standardized clinical and laboratory assessment at enrolment included Ann Arbor Stage, lactate dehydrogenase (LDH) levels, Eastern Cooperative Oncology Group (ECOG) performance status, as well as HIV RNA and CD4+ T-cell counts for HIV+ patients. LDH levels were categorized as greater than twice the upper limit of normal (LDH > 2) and ECOG scores were categorized as greater than or equal to 2 (ECOG≥2). Pretreatment excisional tissue biopsies were collected at diagnosis and stored as formalin-fixed paraffin-embedded (FFPE) tissue blocks. FFPE and frozen blood pellets were shipped to UNC. Overall survival (OS) was calculated as the time between the date of study enrolment and the date of death or censoring, and progression-free survival (PFS) was calculated as the time between the date of study enrolment and date of progression, death or censoring, whichever occurred first. Both OS and PFS were calculated for cell-of-origin (COO), morphology, MYC, MYC/BCL2 protein co-expression, Ki67, LDH > 2 and ECOG≥2, and adjusted for HIV/ART status via multivariate Cox regression. The Kamuzu Central Hospital (KCH) Lymphoma Study was approved by the University of North Carolina Institutional Review Board and the Malawi National Health Sciences Research Committee.
Immnunohistochemistry
Primary diagnoses were determined by conventional histology and immunohistochemistry (IHC) using antibodies as previously described: CD3 (clone PS1), CD20 (clone L26), CD30 (clone 15B3), CD45 (code NCL-L-LCA-RP), CD138 (clone MI15), BCL2 (clone bcl2/100/D5), Ki67 (Clone MM1), TdT (Clone TdT-338) and HHV8 (NCL-HHV8-LNA), all from Leica Biosystems (Buffalo Grove, IL, US).13, 14, 25 BCL2 (clone 124) and MYC (clone y69) expression were assessed using IHC antibodies from Ventana Medical Systems (Tuscon, AZ, USA) on the Ventana Discovery Ultra.13 MYC positivity was defined as staining of >40% of neoplastic cells. While a cut-off of >50% positivity is commonly used for BCL2, we defined it as ≥70%, based on the work of Green et al., due to the frequent strong positive staining in this cohort.13, 31, 32 None of our cases fell between 50% and 70% positivity for BCL2. Ki67 was quantified by light microscopy. In situ hybridization (ISH) for Epstein–Barr Virus small RNAs (EBER) was performed on a Leica Bond platform (Leica Biosystems) according to the manufacturer's instructions. COO was assigned per the algorithm by Hans et al. using CD10 (clone NCL-CD10-270) and BCL6 (PA0204) from Leica Biosystems and MUM1 (M7259m) from Dako (Carpinteria CA, USA).33
Imaging mass cytometry
A total of n = 66 EBV-negative DLBCL FFPE tumours were submitted for tissue microarray (TMA) generation and IMC. For each sample, 2–3 regions of interest (ROIs) representative of the tumour were selected by a pathologist (n = 183). Ablation and imaging mass cytometry were performed at the Spatial Molecular Profiling Shared Resource at Cedars Sinai as previously described.23 Using PhenoGraph, the expression and spatial features of 45 markers were hierarchically clustered to identify cell lineages as previously described (Supporting Information File S1).23 A representative ROI and cellular identification by protein expression data is provided in Figure S1. ROIs with poor tissue quality or those that were damaged or shifted during ablation were excluded from analysis (n = 47), resulting in a final n of 56 tumours available for study. The density of cell type X was calculated as 1—average nearest neighbour distance of each tumour cell to the nearest 5 cells of type X, truncated at 50 μm. The cellular composition of tumours was calculated as either a percentage of total cells in the ROI (cellular percentage) or as a proportion of immune cells in the ROI (immune percentage). Spatial clusters for each cell lineage were generated using k-means clustering (k = 15) to identify the patterns of cellular interactions. Heatmaps were generated by defining these clusters using the aforementioned spatial density metric. To account for the uneven distribution of ROIs among samples, ROI cellular expression and spatial data were averaged by the patient.
TCR sequencing
DNA was extracted from n = 59 pretreatment FFPE DLBCLs (QIAmp DNA FFPE Advanced and Blood Mini kits). Samples below 10 ng/μL were excluded. We performed TCR sequencing on DNA from n = 53 pretreatment DLBCL FFPE tumours, using the immunoSEQ Human TCRB assay (Adaptive Biotechnologies) and running the pooled libraries on a NextSeq 500. Raw sequencing data were processed using the Adaptive Biotechnologies' pipeline and clonality metrics were calculated after random downsampling to 108 productive templates, averaged over 100 iterations (exclusion criteria: failed quality control, <100 productive templates). n = 22 of these samples matched IMC data and were utilized in this study. Productive Simpson clonality is the square root of Simpson's diversity index for the productive rearrangements of a sample. Maximum (max) productive frequency is the frequency of the most expanded clone in a sample. Unique productive rearrangements are the number of unique productive TCR rearrangements in a sample.
Statistical tests
To determine correlations between HIV/ART status and COO, morphology, MYC, MYC /BCL2 co-expression, Ki67, LDH > 2ULN and ECOG ≥2 chi-square analyses were performed. A pairwise Wilcoxon rank-sum test was used to compare clinical/demographic variables, including CD4, HIV RNA and duration on ART, by HIV/ART status. To test the association of clinical/demographic values with outcomes, a median cut-off was used to categorize the data as necessary, and hazard ratios were estimated by Cox regression. To compare cellular and immune percentages by HIV/ART status, pairwise Wilcoxon rank-sum tests were used. To test associations between bulk clonality and immune percentages or B-cell neighbourhood analyses, Spearman's correlation coefficient was used. Analyses were performed in R 4.2.0 using the dplyr, tidyverse, survival, Rphenograph and mclust packages. Figures were generated using the ggplot2, ggpubr, survminer, uwot and corrplot packages.
Data availability
IMC data are available upon request from the corresponding author, YF. TCR sequencing data are available on the ImmuneAccess database (Adaptive Biotechnologies, Seattle, WA, USA).
RESULTS
Patient characteristics
n = 152 adult DLBCL patients with known HIV and ART status were enrolled in the KCH study between 2013 and 2019, of which n = 57 were HIV−. n = 61 were HIV+/ART-Exp. and n = 34 were HIV+/ART-naïve (Table 1). Only n = 15 (10%) tumours were EBV-positive (EBV+) by EBER in situ hybridization. Only four patients had central nervous system involvement, (n = 2 HIV−, n = 2 HIV+/ART-naive); two of which were EBV+ (n = 1 HIV−, n = 1 HIV+/ART-naïve). HIV+ patients were significantly younger than HIV− patients (p = 0.046), and though not significant, HIV+/ART-naive tumours trended towards increased GC cell-of-origin subtyping. The majority of patients were strongly BCL2-positive, regardless of HIV/ART status, warranting the use of a 70%-positivity cutoff. n = 56 of these tumours were utilized for IMC, and of these, n = 22 had available TCRseq data. Additional patient characteristics of each molecular study cohort are presented in Table S1.
| HIV (N = 57) | HIV+/ART-exp. (N = 61) | HIV+/ART-naive (N = 34) | Total (N = 152) | |
|---|---|---|---|---|
| Age (years) | ||||
| Median [Min, Max] | 48.0 [19.0, 80.0] | 46.0 [18.0, 65.0] | 43.0 [22.0, 62.0] | 45.0 [18.0, 80.0] |
| Sex | ||||
| Female | 23 (40.4%) | 21 (34.4%) | 14 (41.2%) | 58 (38.2%) |
| Male | 34 (59.6%) | 40 (65.6%) | 20 (58.8%) | 94 (61.8%) |
| Prior ART (months) | ||||
| Median [Min, Max] | NA | 59.3 [6.18, 178] | 0.838 [0, 4.57] | 30.3 [0, 178] |
| CD4 count | ||||
| Median [Min, Max] | NA | 147 [13.0, 844] | 115 [9.00, 392] | 139 [9.00, 844] |
| HIV RNA | ||||
| Median [Min, Max] | NA | 0 [0, 913 000] | 10 500 [0, 1 890 000] | 40.0 [0, 1 890 000] |
| Cell of origin (COO) | ||||
| GC | 23 (56.1%) | 23 (56.1%) | 22 (73.3%) | 68 (60.7%) |
| Non-GC | 18 (43.9%) | 18 (43.9%) | 8 (26.7%) | 44 (39.3%) |
| EBER | ||||
| Positive | 7 (12.3%) | 6 (10.0%) | 2 (5.9%) | 15 (9.9%) |
| Negative | 50 (87.7%) | 54 (90.0%) | 32 (94.1%) | 136 (90.1%) |
| Ki67 | ||||
| Median [Min, Max] | 0.800 [0.300, 0.950] | 0.800 [0.100, 0.950] | 0.900 [0.500, 0.950] | 0.800 [0.100, 0.950] |
| MYC expression >40% | ||||
| Positive | 10 (24.4%) | 18 (39.1%) | 11 (42.3%) | 39 (34.5%) |
| Negative | 31 (75.6%) | 28 (60.9%) | 15 (57.7%) | 74 (65.5%) |
| BCL2 expression ≥70% | ||||
| Positive | 50 (98.0%) | 51 (89.5%) | 25 (86.2%) | 126 (92.0%) |
| Negative | 1 (2.0%) | 6 (10.5%) | 4 (13.8%) | 11 (8.0%) |
| MYC/BCL2 co-expression | ||||
| Positive | 9 (22.0%) | 14 (30.4%) | 9 (36.0%) | 32 (28.6%) |
| Negative | 32 (78.0%) | 32 (69.6%) | 16 (64.0%) | 80 (71.4%) |
| Stage | ||||
| 1–2 | 33 (57.9%) | 24 (39.3%) | 16 (47.1%) | 73 (48.0%) |
| 3–4 | 24 (42.1%) | 37 (60.7%) | 18 (52.9%) | 79 (52.0%) |
| ECOG score | ||||
| 0–1 | 27 (47.4%) | 37 (60.7%) | 23 (67.6%) | 87 (57.2%) |
| 2–4 | 30 (52.6%) | 24 (39.3%) | 11 (32.4%) | 65 (42.8%) |
| LDH | ||||
| Median [Min, Max] | 443 [168, 1890] | 519 [27.0, 4380] | 537 [144, 4800] | 479 [27.0, 4800] |
| Treatment | ||||
| CHOP | 48 (84.2%) | 44 (72.1%) | 26 (76.5%) | 118 (77.6%) |
| R-CHOP | 9 (15.8%) | 17 (27.9%) | 8 (23.5%) | 34 (22.4%) |
| Survival (months) | ||||
| Median [Min, Max] | 14.9 [0.0657, 60.0] | 12.6 [0, 60.0] | 35.5 [0.329, 60.0] | 14.7 [0, 60.0] |
- Abbreviations: ECOG, eastern cooperative oncology group score; LDH, lactate dehydrogenase.
Exclusion of EBV+ Tumours
Notably, there was a low frequency of EBV+ tumours in our cohort, only comprising 10% of cases (n = 15). Of these, only 4 had available IMC data, and 1 had additional TCR data. While another study has shown that EBV+ HIV+ tumours have altered mutational profiles and clinical features, in our cohort EBV positivity was not associated with HIV/ART status, expression of Ki67, MYC, BCL2, MYC/BCL2 co-expression, or overall survival.34 As such, given the impacts of EBV on lymphomagenesis and the low frequency of EBV positivity in our cohort, EBV+ tumours were excluded for downstream analysis, resulting in a final n of 137 patients (n = 50 HIV−, n = 55 HIV+/ART-exp. and n = 32 HIV+/ART-naïve).
ART stratification results in biologically distinct HIV+ cohorts
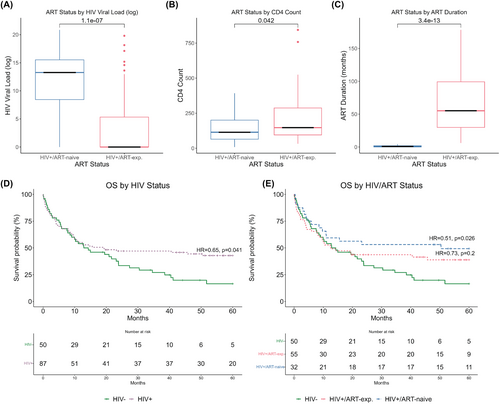
As expected, the HIV+/ART-naïve group had significantly higher HIV RNA (p < 0.001), lower CD4+ T-cell counts (p = 0.042) and shorter duration on ART (p < 0.001) at DLBCL diagnosis and study enrolment compared with HIV+/ART-exp. (Figure 1A–C). Notably, median time on ART in HIV+/ART-naïve patients was 0.9 months and median time on HIV+/ART-exp. patients was 55 months. Additionally, each group experienced differing rates of CD4 reconstitution as measured by peripheral blood CD4 counts. After 5 years on ART, HIV+/ART-naïve patients who survived DLBCL regained peripheral CD4 T cells at an increased rate compared to HIV+/ART-experienced patients (p = 0.005, ANOVA; Figure S2).
HIV+/−naïve patients have improved overall survival in our cohort
HIV status was prognostic for OS (HIV+ HR = 0.65, p = 0.041) and marginally prognostic for PFS (HIV+ HR = 0.70, p = 0.088; Figure 1D, Figure S3A). Further, stratification by ART status revealed prognostically significant differences in outcomes, in which HIV+/ART-naïve patients had increased OS (HR = 0.51, p = 0.026) and PFS (HR = 0.55, p = 0.039) compared to HIV− patients. There was no significant difference in outcome between HIV+/ART-exp. and HIV− cases (Figure 1E, Figure S3B).
COO and morphology are not prognostic in an HIV+ DLBCL inclusive cohort
Of the tumour-intrinsic biomarkers and stratification systems we tested, only Ki67 was associated with HIV or HIV/ART status, with HIV+/ART-naïve tumours having increased Ki67 (p ≤ 0.001).7, 13 When accounting for HIV/ART status, COO, morphology and Ki67 did not significantly impact outcomes in this cohort (Table S2). Co-expression of MYC/BCL2 was significant for OS (HR = 2.51, p < 0.001) and PFS (HR = 2.56, p < 0.001). Notably, when accounting for HIV/ART status expression of MYC alone was prognostic for both OS (HR = 2.07, p = 0.006) and PFS (HR = 2.19, p = 0.002). Further, when separated, expression of MYC was marginally prognostic for OS and PFS in HIV− patients (HR = 2.27, p = 0.06 and HR = 2.22, p = 0.07) and prognostic for PFS in HIV+ patients (HR = 2.14, p = 0.02). LDH > 2 and ECOG ≥2 remained negatively prognostic for both OS and PFS after adjusting for HIV/ART status (Table 2).
| OS | PFS | |||||
|---|---|---|---|---|---|---|
| HR | CI | p-value | HR | CI | p-value | |
| Morphology | ||||||
| Centroblastic | 0.97 | 0.5, 1.89 | >0.9 | 1.01 | 0.52, 1.97 | >0.9 |
| Immunoblastic | 1.03 | 0.53, 2.00 | >0.9 | 0.99 | 0.51, 1.92 | >0.9 |
| COO | ||||||
| GC | 0.91 | 0.57, 1.46 | 0.7 | 0.87 | 0.55, 1.39 | 0.6 |
| non-GC | 1.10 | 0.69, 1.76 | 0.7 | 1.15 | 0.72, 1.83 | 0.6 |
| MYC >40% | 2.07 | 1.23,3.48 | 0.006 | 2.19 | 1.32, 3.62 | 0.002 |
| BCL2 ≥70% | 1.19 | 0.47, 3.02 | 0.7 | 1.12 | 0.44, 2.85 | 0.8 |
| MYC/BCL-2 Co-expression | 2.51 | 1.47,4.28 | <0.001 | 2.56 | 1.52, 4.32 | <0.001 |
| Ki67 ≥ 80% | 1.12 | 0.73. 1.74 | 0.6 | 1.14 | 0.74, 1.75 | 0.5 |
| LDH > 2ULNa | 2.10 | 1.33, 3.32 | 0.001 | 2.08 | 1.33, 3.26 | 0.001 |
| ECOG >2b | 2.78 | 1.79, 4.31 | <0.001 | 2.81 | 0.39, 4.31 | <0.001 |
- a LDH > 2 ULN = lactate dehydrogenase > twice the upper limit of normal.
- b ECOG >2 = Eastern Cooperative Oncology Group score >2.
HIV/ART status impacts immune cell composition and distribution of DLBCL
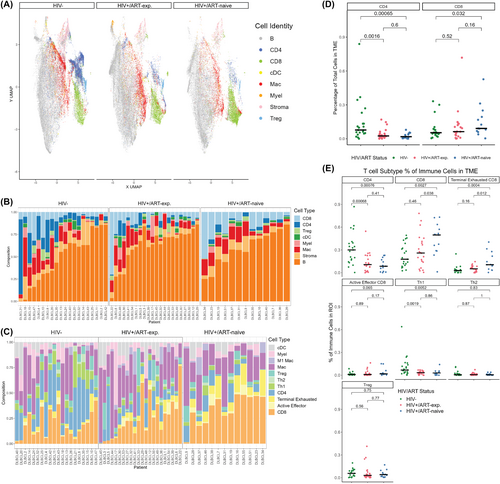
As the differences in outcomes were not captured by traditional tumour-intrinsic biomarkers, we next investigated the TME by IMC of a representative subset of cases. Nine major cell lineages were identified: B cells (considered to overwhelmingly represent tumour in this context), CD4+ T cells, regulatory T cells (Tregs), CD8+ T cells, dendritic cells (cDCs), endothelial cells, macrophages, myeloid cells and stroma. Further subtyping enabled the identification of immune cell subtypes, including M1 macrophages, Th1 CD4+ T cells, Th2 CD4+ T cells, active effector CD8+ T cells and terminally exhausted CD8+ T cells. Uniform manifold approximation and projection (UMAP)s depicting the major cell populations, subpopulations and marker distribution were generated, reflecting the loss of CD4+ T cells and myeloid cell lineages from HIV− to HIV+/ART-exp. and HIV+/ART-naïve cases (Figure 2A, Figure S4). Immune cells make up a greater percentage of the TME in HIV− tumours (median = 33%) compared to HIV+/ART-exp. and HIV+/ART-naïve ones (median = 25% and 27%, respectively; Figure 2B). Of the immune component, HIV+ tumours had decreased CD4+ T cell proportions, including Tregs, Th1 and Th2 cells (HIV− median = 45%, HIV+ mean = 20%; Figure 2C). Further, HIV+/ART-naïve patients had increased proportions of CD8+ T cells (HIV+/ART-naive median = 9%, HIV− median = 5%) and terminally exhausted CD8+ T cells, defined by co-expression of PD-1, TIM-3 and LAG-3, compared to HIV− tumours (HIV+/ART-naive median = 3%, HIV− median = 1%; Figure 2C).
HIV/ART status shifts T cell subtype populations in DLBCL
HIV− tumours had increased CD4+ T-cell presence, both by cellular percentage (p < 0.001 vs. HIV+/ART-exp., p < 0.001 vs. HIV+/ART-naive) and immune percentage (p < 0.001 vs. HIV+/ART-exp., p < 0.001 vs. HIV+/ART-naïve; Figure 2D). HIV+/ART-naïve tumours, however, had increased CD8+ T-cell presence compared to HIV− cases by cellular percentage (p = 0.032) and compared to both HIV− and HIV+/ART-naïve cases by immune percentage (p < 0.001 and p = 0.038, respectively; Figure 2E). HIV+/ART-naïve tumours were also enriched for terminally exhausted CD8+ T cells compared to HIV− and HIV+/ART-exp. tumours (p < 0.001 and p = 0.012, respectively; Figure 2E). HIV− tumours had an increased proportion of Th1 T cells compared to HIV+/ART-exp. and HIV+/ART-naïve patients (p < 0.001 and p < 0.001 respectively), with no difference in Th2 or Treg cells between the three groups (Figure 2E).
Differential T-cell and B-cell spatial association by HIV/ART status
Fifteen tumour cell spatial clusters were identified by the density of nearest neighbours using k-means clustering separately by HIV/ART status. It is important to note that these neighbourhoods are not mutually exclusive and contain overlap. For example, tumour-rich neighbourhoods may also contain a subset of CD4 neighbourhoods. In all three groups, tumour cells were most densely surrounded by other tumour cells. In HIV− tumours, 31% of tumour cells were found in CD4+ T-cell rich neighbourhoods (clusters 7–9, 11–12, 14), 15% CD8+ T-cell rich neighbourhoods (clusters 2, 7, 13–15) and to a lesser extent, Th1 (6%, clusters 7, 14), Treg (3%, cluster 14) and terminally exhausted CD8+ T-cell rich neighbourhoods (6%, clusters 14–15; Figure 3A). In HIV+/ART-exp. tumours, tumour cells formed some CD4+ T-cell rich neighbourhoods (9%, clusters 1, 13, 14), but lost Th1 neighbourhoods and had an increased percentage of CD8+ T-cell rich neighbourhoods (24%, 8–11, 13, 15; Figure 3B). While fewer than HIV− tumours, HIV+/ART-naïve tumours also maintained CD4+ T-cell rich neighbourhoods (6%, clusters 1–2). Additionally, HIV+/ART-naïve tumours reflected a drastically increased number CD8+ T-cell rich neighbourhoods (48%, clusters 1, 4, 8–14) and terminally exhausted CD8+ T-cell (13%, clusters 8, 10) neighbourhoods, indicating increased tumour cell:CD8+ T-cell interactions (Figure 3C). Most notably, HIV− tumours exhibited an increased association between tumour and CD4+ rather than CD8+ T cells, whereas HIV+/ART-naïve tumours exhibited increased CD8+ T cell: tumour clustering.
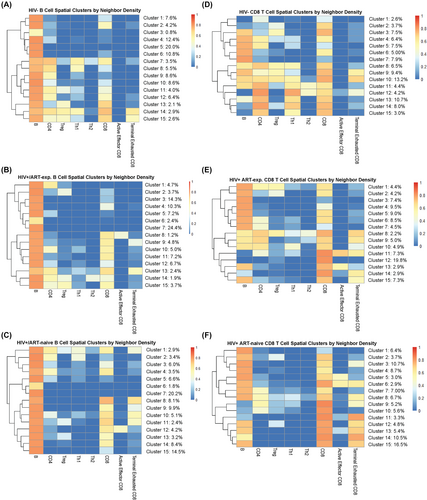
To further characterize CD8+ T-cell interactions in the TME, we considered CD8+ T-cell spatial clusters by the density of nearest neighbours. By HIV/ART status, 68% of HIV− CD8+ T cells were found in tumour cell rich neighbourhoods (clusters 3–11), 64% in CD4+ T-cell rich neighbourhoods (clusters 4–5, 8, 10–15), 50% in Th1 rich neighbourhoods (clusters 8, 10–15) and 23% in terminally exhausted CD8+ T-cell rich neighbourhoods (clusters 9–10; Figure 3D). HIV+/ART-exp. cases had a similar proportion of CD8+ T-cells in tumour cell rich neighbourhoods (70%, clusters 1–10, 13, 15), fewer clusters in CD4+ T-cell rich neighbourhoods (17%, clusters 1, 8–10), and similar clusters in terminally exhausted CD8+ T-cell rich neighbours (25%, clusters 8–9, 11, 14–15; Figure 3E). Finally, HIV+/ART-naïve CD8+ T cells had the most tumour cell rich neighbourhoods (86%, clusters 1–8, 12–15), the fewest CD4+ T-cell rich neighbourhoods (12%, clusters 8–9), and the most terminally exhausted CD8+ T-cell rich neighbourhoods (50%, clusters 6,8,11–15; Figure 3F). As such, HIV+/ART-naïve tumours reflected an increased spatial association between tumour cells and CD8+ T cells, and a greater presence of terminally exhausted CD8+ T cells, with a loss of CD4+ spatial association with tumour cells. In contrast, HIV− tumours had increased CD4+, Th1 and Treg spatial associations with tumour cells, and HIV+/ART-exp. tumours reflected an intermediary phenotype.
Tumour TCR clonality is associated with terminally exhausted T-cell presence in the tumour
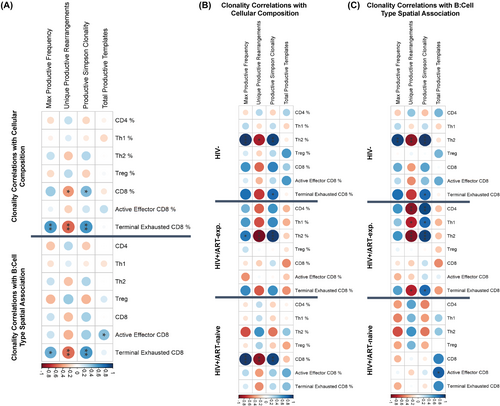
For the n = 22 tumours with IMC data with corresponding TCRseq clonality data, we tested for associations between clonality metrics, immune cell composition (cellular percentage) and spatial association with B cells (neighbour density). In the combined cohort, productive Simpson clonality positively correlated with CD8+ T cell percentage (p = 0.039, R = 0.47) and terminally exhausted CD8+ T cell percentage (p = 0.004, R = 0.57), which also positively correlated with max productive frequency (p = 0.006, R = 0.55; Figure 4A). Productive Simpson clonality and max productive frequency positively correlated with terminally exhausted CD8+ T-cell neighbour density (p = 0.005, R = 0.57 and p = 0.018, R = 0.5), indicating that the clonally expanded TCRs are derived from CD8+ T cells that interact with the tumour and enter a terminally exhausted state (Figure 4A). When separated into the three HIV/ART groups, clonality was differentially associated with immune cell and tumour cell neighbour density. In HIV− tumours, productive Simpson clonality and max productive frequency positively correlated with both Th2% (p = 0.003, R = 0.93 and p < 0.001, R = 0.96) and Th2 neighbour density (p < 0.001, R = 0.96 and 0.003, R = 0.93; Figure 4B,C). In HIV+/ART-exp. tumours, productive Simpson clonality also positively correlated with Th2% (p < 0.001, R = 0.87) and Th2 neighbour density (p < 0.001, R = 0.93), as well as Th1 neighbour density (p = 0.021, R = 0.79), CD4+ T cell neighbour density (p = 0.002, R = 0.9) and terminally exhausted CD8+ T-cell density (p = 0.021, R = 0.79; Figure 4B,C). Finally, in HIV+/ART-naïve tumours, productive Simpson clonality and max productive frequency only correlated with CD8+ T cell % (p = 0.003, R = 0.93 and 0.007, R = 0.96), but not CD8+ T-cell neighbour density, whereas total productive templates positively correlated with active effector CD8+ T-cell neighbour density (p = 0.023, R = 0.82; Figure 4B,C). This implies that T-cell response in HIV− DLBCL is driven largely by Th2 cells. Meanwhile, response in HIV+/ART-exp. is driven by CD4+ T cells (Th1 and Th2), and HIV+/ART-naïve clonal expansions may not be a result of tumour-targeting T cells, despite the increased CD8+ T cell–tumour association. To investigate this, we further investigated TCR epitopes to identify different T-cell targets between the three groups.
DISCUSSION
Herein, we begin to understand the impact of HIV infection and ART exposure on immune composition and T-cell response to DLBCL. To our knowledge, this is the first description of an integrated analysis of tumour immune landscape and TCR repertoires of an HIV-inclusive DLBCL cohort stratified by ART exposure.
There is limited literature on the biological differences between HIV+ and HIV− DLBCL; in part because, in high-income counties, HIV+ DLBCL is relatively uncommon and mainly affects marginalized groups. While other studies have reported positive and negative prognostic implications of HIV status, in our cohort, we observed that HIV+ patients had improved five-year OS and PFS.35, 36 We further observed that HIV+/ART-naïve patients had improved outcomes compared to HIV− patients. A prior study from the Centre for AIDS Research Network of Integrated Clinical Systems similarly identified lymphoma developing on ART versus not on ART as an independent risk factor for mortality among patients with HIV+ lymphoma in a large United States cohort.37 Survival differences among HIV+ DLBCL patients depending on ART exposure may imply distinct tumourigenesis and/or immune response, or a therapeutic benefit of initiating ART alongside chemotherapy.
Additionally, in our cohort, the majority of tumour-intrinsic prognostic classification systems and biomarkers failed to distinguish tumours by HIV/ART status and were not independently prognostic. HIV/ART status alone was most valuable as a predictive biomarker in our cohort, suggesting that biological differences between these tumours remain uncaptured by traditional prognostic techniques, and prompting further investigation of the TME.
We find that HIV/ART status impacts the cellular composition and spatial organization, which may be due to differential anti-tumour responses and/or the setting of lymphomagenesis. Our data suggests that HIV− T-cell clonal expansions are likely driven by Th2 cells, whereas HIV+/ART-exp. expansions may be driven by a more generic CD4+ T cell (Th1 and Th2) response to tumour. Finally, while HIV+/ART-naïve tumours have increased CD8+ T cell presence and tumour cell spatial association, TCR clonality did not associate with CD8+ T-cell (activated effector or terminally exhausted) presence or proximity to tumour. It is possible that the increased CD8+ T-cell presence, activation and exhaustion are at least partly driven by a non-tumour targeting T-cell response. These CD8+ T-cell clonal expansions may instead result from responses to opportunistic infections or HIV itself.
This study may hold implications for immunotherapy application in HIV+ DLBCL. In our cohort, we observed differences in the T cell presence and spatial association with tumour related to systemic immunity. A better understanding of the immune landscape in HIV+ DLBCL, and how it may differ depending on ART exposure, is necessary to developing equitable treatment paradigms for all DLBCL patients. The most promising immunotherapy to date in DLBCL is CAR-T therapy, which is often not feasible for many patients worldwide due to cost and implementation barriers, including manufacturing time and required hospital infrastructure.38-40 The majority of immune checkpoint inhibition (ICI) clinical trials in DLBCL have focused on PD-1 blockade, which has shown suboptimal responses, likely due to the variability of PD-L1 expression in DLBCL.41 We identify CD8+ T cells that express PD-1, LAG-3 and TIM-3 across all three HIV/ART groups. LAG-3 expression in DLBCL has been linked to poor overall survival, and current therapeutics targeting these three markers are in trial.20, 42 Though HIV+ DLBCL patients have historically been excluded from DLBCL clinical trials, small studies have suggested the possible safety and efficacy of ICI in HIV+ non-Hodgkin lymphoma patients.43, 44
While stratifying HIV+ patients using a six-month cut-off for ART duration does not capture the profound heterogeneity of HIV+ DLBCL, it does reveal biological differences related to DLBCL biomarkers and anti-tumour T-cell response. HIV+/ART-exp. DLBCL patients represent a highly heterogeneous group due to variations in HIV infectious course, as well as ART regimen and response.45, 46 Importantly, as the global population continues to grow and age, the incidence of non-Hodgkin lymphoma, including DLBCL, is increasing.47 Further, the proportion of HIV+ DLBCL patients with prior ART exposure will continue to increase as accessibility to ART improves and the life expectancy of PWH increases.48, 49 Despite relatively small sample sizes, we observe distinct patterns that may be valuable to prognostication and treatment decisions in this population.
Thus, in our cohort, we establish an impact of not just HIV, but prior ART exposure on patient outcomes, TME composition and T-cell response. Given the generalized epidemic of HIV in Malawi, paired with successful ART-scale-up efforts, our unique cohort allows for the investigation of HIV− and HIV+ patients with further stratification by ART exposure across various demographics, minimizing potential confounding variables. This clinical and immunological study conducted in one of the lowest-income countries in the world can help provide such insights to potentially benefit HIV+ and HIV− DLBCL patients worldwide. This work contributes to the groundwork for improving cancer care in a high-risk population, and further work elaborating on these tumour–host interactions and functionalities will be necessary to elucidate potential therapeutic avenues.
AUTHOR CONTRIBUTIONS
The study was designed by JC, SMR, AM, AXE, SG and YF. Clinical data were obtained by MP, EK and KP. Pathological data was obtained by TT, MM, MM and YF. AXE and AM provided an IMC panel and performed an IMC. AXE, JC and SMR performed IMC analyses. SMR performed TCR sequencing and clonality analysis. JC, SMR, AXE and YF interpreted the data. JC and SMR drafted the manuscript. YF and AXE revised the manuscript. AB, JG, HG, BD, MP, AK and SG provided intellectual contributions, and all authors contributed edits and final approval of the manuscript.
ACKNOWLEDGEMENTS
We would like to thank the Malawi Ministry of Health and Kamuzu Central Hospital, as well as the University of North Carolina Project-Malawi for their support of this work. We would further like to thank the Pathology Services Core of UNC Chapel Hill for histopathological processing, which is supported by NCI Centre Core Support Grant P30CA016086. This work was supported by funding from the National Institute of Health and internal funding awarded at UNC Chapel Hill. Finally, we thank the patients in our cohort for their invaluable contributions that made this work possible.
FUNDING INFORMATION
UNC-Program in Translational Medicine T32 1T32GM12274 (JC), UNC Robert H Wagner Scholars Program in Pathobiology and Translational Science (JC), 5U54CA254564 (YF, SMR), CA016086-46S3 (YF, AM, JC), UNC Lineberger Comprehensive Cancer Centre Developmental Funding Award (YF, AM, AXE, SMR), UNC-Integrated Translational Oncology Program T32-CA244125 (SMR), NIH D43 CA260641 (YF), NCI R01 CA266544 (AM, AXE). The funding agencies had no role in study design, data analysis, writing of the report or the decision to submit for publication, and the opinions expressed in this article belong solely to the authors and do not reflect the view of any governmental or funding agency.
CONFLICT OF INTEREST STATEMENT
The authors declare no competing financial interests. No commercial support was provided for this study.
ETHICS STATEMENT
The Kamuzu Central Hospital (KCH) Lymphoma Study was approved by the University of North Carolina Institutional Review Board and the Malawi National Health Sciences Research Committee.


