Dynamic relationship between D-dimer and COVID-19 severity
Since December 2019, the severity of the coronavirus disease 2019 (COVID-19) pandemic has been escalating.1 Coagulopathy is common in critically ill patients with COVID-19.2 Systemic microvascular thrombosis may occur in most deaths, and was corroborated by a recent autopsy.3 However, less is known about the coagulation parameter D-dimer in the progression of COVID-19. In this study, we describe 279 COVID-19 patients recruited from three hospitals in Hubei Province, China and investigate the dynamic relationship between D-dimer level and the progression of COVID-19.
According to COVID-19 Diagnosis and Treatment Scheme (Trial Version 7),4 all laboratory-confirmed COVID-19 patients were mild and moderate cases on admission in our study. We further divided them into three groups according to their clinical courses: an ordinary group (disease was mild or subsided, n = 136), an improved group (disease worsened first and improved gradually after treatment, n = 23)m and a poor group (disease worsened and deaths, n = 120). On admission, the epidemiological data, co-morbidities and clinical symptoms of patients were obtained (Table I). Then, we tested the coagulation profile for 10 consecutive days after admission.
| Characteristics | No. (%) | P | |||
|---|---|---|---|---|---|
| Total (n = 279) | Ordinary (n = 136) | Improved (n = 23) | Poor (n = 120) | ||
| Age, median (IQR), years | 55 (39–68) | 49 (36–56) | 58 (41·5–67·5) | 65 (51–72) | <0·001 |
| Sex | |||||
| Male | 149 (53·4) | 66(48·5) | 12(52·2) | 71(59·2) | 0·31 |
| Female | 126 (45·2) | 67(49·3) | 10(43·5) | 49(40·8) | |
| Cardiovascular disease | 77 (27·6) | 25(18·4) | 1(4·3) | 51(42·5) | <0·001 |
| Respiratory disease | 29 (10·4) | 10(7·4) | 1(4·3) | 18(15·0) | 0·08 |
| Immune disease | 7 (2·5) | 3(2·2) | 0(0·0) | 4(3·3) | 0·61 |
| Endocrine disease | 35 (12·5) | 12(8·8) | 1(4·3) | 22(18·3) | 0·03 |
| Tumour | 3 (1·1) | 1(0·7) | 0(0·0) | 2(1·7) | 0·67 |
| Infectious disease | 9 (3·2) | 2(1·5) | 1(4·3) | 6(5·0) | 0·27 |
| Signs and symptoms | |||||
| Fever | 217 (77·8) | 106 (77·9) | 17 (73·9) | 94 (78·3) | 0·53 |
| Cough | 191 (68·5) | 99 (72·8) | 17 (73·9) | 75 (62·5) | 0·54 |
| Chest tightness | 31 (11·1) | 16 (11·8) | 1 (4·3) | 14 (11·7) | 0·15 |
| Shortness of breath | 24 (8·6) | 7 (5·1) | 3 (13·0) | 14 (11·7) | 0·02 |
| Fatigue | 60 (21·5) | 27 (19·9) | 9 (39·1) | 24 (20·0) | 0·13 |
| Heart rate, median (IQR), bpm | 86 (80–98) | 86 (80–98) | 87·5 (72–95) | 88 (80–98) | 0·26 |
| SBP, median (IQR), mm Hg | 125 (119–137) | 125 (118–136·5) | 121 (116–130) | 126 (120–139) | 0·73 |
| DBP, median (IQR), mm Hg | 78 (70–86) | 80 (76–87·5) | 79 (70–85) | 75 (70–80) | <0·001 |
| Respiratory rate, median (IQR) | 20 (19–22) | 20 (18–20) | 20 (20–22) | 20 (20–25) | <0·001 |
| Laboratory indexesm median (IQR) | |||||
| White blood cell count, ×109/l | 5·0 (4·0–7·9) | 4·2 (3·6–5·2) | 4·8 (4·1–8·0) | 6·6 (4·5–8·6) | <0·001 |
| Lymphocyte count, ×109/l | 0·9 (0·6–1·3) | 1·2 (0·9–1·6) | 0·7 (0·7–1·3) | 0·8 (0·5–1·1) | <0·001 |
| Lactate dehydrogenase, u/l | 263·0 (179·0–360·0) | 186·0 (164·0–233·5) | 277·0 (190·0–297·5) | 335·0 (227·0–408·0) | <0·001 |
| Alanine transaminase, u/l | 23·0 (16·8–36·5) | 23·0 (17·8–30·5) | 21·0 (19·0–72·0) | 25·0 (16·0–50·0) | <0·01 |
| Aspartate transaminase, u/l | 27·0 (18·0–45·5) | 22·0 (17·5–33·0) | 27·0 (23·5–48·0) | 33·0 (18·0–49·0) | 0·14 |
| Creatinine, μmol/l | 73·2 (60·5–92·5) | 77·0 (64·4–94·0) | 54·9 (48·0–68·0) | 73·9 (63·5–95·0) | 0·16 |
| Carbamide, mmol/l | 5·3 (4·1, 6·9) | 4·8 (3·9, 6·5) | 4·4 (3·3, 5·0) | 5·9 (4·9, 8·2) | 0·17 |
| D-dimer, μg/ml | 0·3 (0·1-1·3) | 0·2 (0·1, 0·4) | 0·8 (0·6-7·3) | 0·6 (0·2-5·0) | <0·01 |
As shown in Table I, median age of the 279 enrolled patients was 55·0 [interquartile range (IQR) 39·0–68·0]; it was highest in the poor group, followed by the improved group. Cardiovascular disease [n = 77 (27·6%)], respiratory disease [n = 29 (10·4%)], and endocrine disease [n = 35 (12·5%)] were the most common co-morbidities.
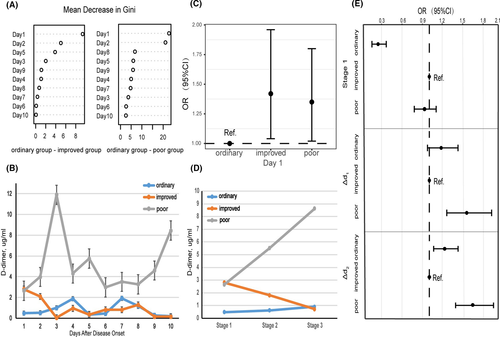
Infection-induced coagulopathy and secondary hyper-fibrinolysis has been identified in severe cases of COVID-19.5 In addition, a higher D-dimer level on admission was related to a worse prognosis of COVID-19.6 Thus, we tracked the variation in D-dimer levels for ten consecutive days. Based on random forests, the Gini index on Day 1 was obviously higher than that on the other days in the three groups Fig 1A. On admission, D-dimer level was higher in the improved and poor groups than that in the ordinary group. The level decreased gradually in the improved group, but remained high in the poor group as the disease deteriorated (Fig 1B). The results were further adjusted and examined with a multinomial logistic regression model. As shown in Fig 1C, on admission, compared with the ordinary group, the improved group and the poor group demonstrated an odds ratio (OR) of 1·42 [95% consistency index (CI): 1·04, 1·96; P = 0·03] and 1·35 (95% CI: 1·02, 1·80;, P = 0·04), respectively (Table SI).

Further, we separated the ten days into three stages: (i) Stage 1: Day 1; (ii) Stage 2: Days 2–5; (iii) Stage 3: Days 6–10. At Stage 1, the OR of the ordinary group [0·25 (95% CI: 0·16, 0·37; P < 0·001)] was obviously different from that of the poor group [0·93 (95% CI: 0·78, 1·10; P = 0·37)] (Fig 1D, E). From Stage 1 to Stage 2, D-dimer level increased with disease progression in the poor group [1·60 (95% CI: 1·28, 2·00; P < 0·001)], but not in the ordinary group [1·19 (95% CI: 0·97, 1·46; P = 0·09)] (Fig 1D, E). The same trend was also observed from Stage 2 to Stage 3, and the OR of the ordinary group and the poor group was 1·25 (95% CI: 1·07, 1·47’ P = 0·07), and 1·71 (95% CI: 1·43, 2·05; P < 0·001) respectively (Fig 1D, E). Information details are given in Table SII.
Pulmonary thrombosis is mostly responsible for the elevation of D-dimer in severe cases.7 Altough more evidence is needed, our finding is meaningful for the establishment of early diagnosis and dynamic intervention.
Moreover, it is well documented that abnormal D-dimer is helpful in indicating deep venous thrombosis in cardiovascular diseases.8 Thus, we analysed the correlation between D-dimer level with clinical prognosis in patients with and without cardiovascular disease. First, there was a difference in D-dimer levels of patients with and without cardiovascular disease in the poor group (P = 0·047; Table SIII). Among patients with cardiovascular disease in the poor group, no difference was observed between non-survivors and survivors (P = 0·83). Last, among patients without cardiovascular disease in the poor group, non-survivors had higher D-dimer levels than survivors (P = 0·02).
As for the current therapeutic regimens for COVID-19, no effective antivirals and vaccines have yet been recommended for patients with COVID-19. A previous report claimed that a D-dimer level >1 μg/ml was associated with a lower mortality after heparin treatment.9 Thus, anticoagulant treatment appears to be beneficial in severe COVID-19 cases. Given that non-survivors had higher D-dimer levels than survivors among the patients without cardiovascular disease in the poor group, timely and effective anticoagulant treatment may be workable.
When administering anticoagulant treatment, proper attention should be paid to diffuse alveolar haemorrhage (DAH), which is a life-threatening complication after warfarin use.10 Thus, international normalized ratio (INR) should be used for early diagnosis and rapid therapeutic intervention.
Overall, dynamical changes of D-dimer level are positively correlated with the prognosis of COVID-19. Anticoagulant treatment may benefit severe COVID-19 patients, especially those without cardiovascular disease.
Acknowledgements
We thank all patients involved in the study.
Author contributions
YL, KZ, HW, WC, ZP, YL and XY had full access to all of the data in the study and take responsibility for the integrity of the data and the accuracy of the data analysis. Concept and design: YL, ZP, YL and XY. Acquisition, analysis, or interpretation of data: all authors. Drafting of the manuscript: YL, ZP, YL and XY. Critical revision of the manuscript for important intellectual content: all authors. Statistical analysis: YL, KZ, HW, WC, ZP, YL and XY. Supervision: YL and XY. Drs YL, KZ, HW, and WC contributed equally to this work.
Conflicts of interest
The authors declare that they have no conflicts of interest.
Funding
This work was supported by grants from the National Key Research & Development plan of the Ministry of Science and Technology of the People's Republic of China (Grant no. 2018YFC1314900, 2018YFC1314901).


