Who is an “older” patient with acute myeloid leukaemia (AML)? An investigation of two NCRI/AML trials
The therapeutic approach for acute myeloid leukaemia (AML), reflected in clinical trial eligibility, traditionally falls into one of three strategies: intensive therapy possibly including stem cell therapy for younger patients, intensive therapy for fit older patients and non-intensive therapy. Although no absolute age criteria have been applied in UK trials, an upper limit of 60 years (previously 55 years) has, in practice, been used since 1994. A reduction in induction death and death in remission has contributed to improved outcomes seen in younger patients. However, this is less apparent in older patients.(Appelbaum et al, 2006; Kantarjian et al, 2006; Burnett et al, 2011a; Burnett, 2012).
Typically, trials for older patients include fewer courses of chemotherapy, reflecting that older patients may be less physically robust. However, it is unclear whether age cut-offs are either clear-cut or correct: should patients aged around 60 pursue protocols for younger patients, or is the associated toxicity too high?
Given the biological imprecision of a chronological age cut-off for trial eligibility, we compared outcomes for similarly aged patients in the UK Medical Research Council (MRC)/National Cancer Research Institute (NCRI) trials of standard chemotherapy aimed at younger or older patients.
A retrospective analysis of contemporaneous patients from the MRC AML15 and NCRI AML16 trials was performed. The trials have been previously described (Burnett et al, 2011b, 2012). Eligibility was restricted to patients aged 55–69 years who did not have acute promyelocytic leukaemia, allocated DA (daunorubicin and cytarabine)-based chemotherapy between August 2006 and January 2009, when both trials were simultaneously open. A total of 832 patients (AML15 n = 383, AML16 n = 449) were identified. AML15 patients received up to 4 courses of treatment (2 courses of DA-based induction plus consolidation with cytarabine or MACE (amsacrine, cytarabine, etoposide)/MidAC [mitoxantrone, cytarabine]), while those on AML16 would receive 2 or 3 courses of DA-based chemotherapy with or without azacytidine maintenance.
Endpoints are those of the revised International Working Group Criteria (Cheson et al, 2003), except that to achieve complete remission, peripheral blood count recovery was not required (in line with the protocol definitions). Cytogenetic group is according to the Grimwade et al (1998) classification. Baseline characteristics of subjects between trials were compared using chi-squared, Mantel Haenszel or Mann–Whitney U tests as appropriate. Analyses of time-to-event outcomes are presented as Kaplan–Meier graphs with trials compared using Cox regression; dichotomous endpoints are compared using logistic regression. Multivariate analyses using forward selection are used to investigate the effect of the trial adjusted for baseline covariates, which include age, sex, performance status, secondary disease, cytogenetics and log[white blood cell count] (log [WBC]), and interactions with trial explored using the likelihood ratio test. Follow up is complete until 1 January 2011. By convention, odds (OR) or hazard ratios (HR) >1 indicated worse outcomes in AML16. All p-values are two sided, with significance set at P < 0·05.
An initial review of the data indicated that outside the range 60–64 years, patients were consistently allocated to one or other clinical trial. Because patients aged over 65 years in AML15 or under 60 years in AML16 would probably be atypical, attention was restricted to the 296 patients aged 60-64 years (AML15, n = 119; AML16, n = 177). Demographic data is shown in Table 1; despite the restricted age range, patients in AML16 tended to be older (P < 0·0001), and have worse risk cytogenetics (P = 0·01), even though this would not be known until after trial entry. In multivariate analyses, age (Adjusted OR 2·24, 95% confidence interval [CI] 1·19–4·22; P = 0·018) and cytogenetic risk group (Adjusted OR 1·44, 95% CI 1·18–1·75; P ≤ 0·0001) were independently associated with choice of trial.
| Number (%) of patients | Effect and P-value | ||
|---|---|---|---|
| AML15 | AML16 | ||
| Number of patients | 119 | 177 | |
| Age group (years) | |||
| Median age | 61 years | 62 years | <0·0001c |
| 60 | 43 (36) | 25 (14) | |
| 61 | 21 (18) | 34 (19) | |
| 62 | 21 (18) | 36 (20) | |
| 63 | 21 (18) | 43 (24) | |
| 64 | 13 (11) | 39 (22) | |
| Sex | |||
| Male | 70 (59) | 95 (54) | 0·4a |
| Female | 49 (41) | 82 (46) | |
| Type of disease | |||
| Primary (De Novo & MDS) | 105 (88) | 145 (82) | 0·14a |
| Secondary | 14 (12) | 32 (18) | |
| Cytogenetics | |||
| Favourable | 6 (5) | 4 (2) | 0·012b |
| Intermediate | 76 (64) | 96 (54) | |
| Adverse | 12 (10) | 34 (19) | |
| Missing values | 25 (21) | 43 (24) | |
| WHO performance status | |||
| Normal | 74 (62) | 113 (64) | 0·7b |
| Restricted | 36 (30) | 50 (28) | |
| Bed <50% | 3 (3) | 9 (5) | |
| Bed >50% | 6 (5) | 5 (3) | |
| White blood cell count (× 109/l) | |||
| Mean ± SD | 29·15 ± 47·87 | 20·78 ± 39·41 |
0·048b 0·3c |
| Median | 5·85 | 4·80 | |
| Range | 0·6–228 | 0·4–285 | |
| 0–9·9 | 66 (56) | 113 (64) | |
| 10–49·9 | 27 (23) | 46 (26) | |
| 50–99·9 | 14 (12) | 11 (6) | |
| 100+ | 9 (8) | 7 (4) | |
| Missing values | 3 (3) | 0 (0) | |
| Blast cell percentage | |||
| Mean ± SD | 56·37 ± 27·75 | 48·07 ± 27·67 |
0·013b 0·014c |
| Median | 55·00 | 44·50 | |
| Range | 0–99 | 5–97 | |
| <20 | 8 (7) | 28 (16) | |
| 20–49·9 | 35 (29) | 61 (35) | |
| 50+ | 66 (56) | 75 (42) | |
| Missing values | 10 (8) | 13 (7) | |
| Platelet count (× 109/l) | |||
| Mean ± SD | 90·54 ± 74·76 | 81·21 ± 64·62 | 0·5c |
| Median | 63·00 | 64·00 | |
| Range | 9–318 | 4–356 | |
| Missing values | 3 (3) | 1 (1) | |
| Complete remission | 76% | 68% |
Unadjusted OR 1·49 (0·88–2·53) P = 0·14 Adjusted OR 1·27 (0·65–2·47) P = 0·5 |
| Resistant disease | 16% | 21% |
Unadjusted OR 1·38 (0·75–2·53) P = 0·3 Adjusted OR 1·14 (0·55–2·33) P = 0·7 |
| Induction death | 8% | 11% |
Unadjusted OR 1·46 (0·64–3·3) P = 0·4 Adjusted OR 1·48 (0·44–4·98) P = 0·5 |
| Percentage incidence of grade 3–4 toxicity during course 1 | |||
| Nausea | 7% | 6% | 0·7a |
| Oral | 6% | 3% | 0·19a |
| Diarrhoea | 17% | 8% | 0·03a |
| Cardiac | 8% | 7% | 0·6a |
| Liver AST | 3% | 11% | 0·11a |
| Liver ALT | 1% | 5% | 0·15a |
| Liver Bilirubin | 11% | 5% | 0·090a |
- AML15, Medical Research Council acute myeloid leukaemia trial 15; AML16, National Cancer Research Institute acute myeloid leukaemia trial 16; MDS, myelodysplastic syndrome; WHO, World Health Organization; SD, standard deviation; OR, odds ratio.
- Percentages may not add to 100% due to rounding.
- a Chi-square.
- b Mantel Haenszel Test.
- c Mann–Whitney U Test.
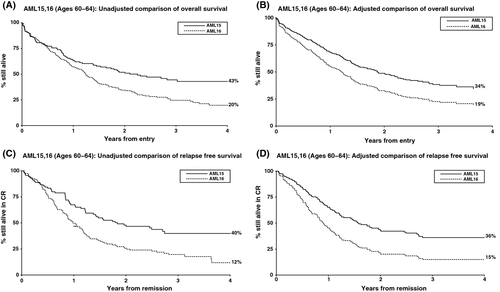
The overall remission rate across the trials was 71% (Table 1). While the outcome estimates were worse in AML16 than AML15, there were no statistically significant differences in remission rates, induction death or resistant disease rates between trials, either in univariate or multivariate analyses. Overall survival was significantly worse in AML16 than AML15 (median survival 16 months vs. 27 months; 3-year overall survival 20% vs. 42%, HR 1·62, 95% CI 1·20–2·17; P = 0·001; Fig 1A). In multivariate analyses adjusted for age, performance status, cytogenetic profile and log [WBC], AML16 retained its poor prognostic value (HR 1·55 (95% CI 1·09, 2·22), P = 0·02, Fig 1B). A similar difference was seen for relapse-free survival (median 12 months vs. 21 months; unadjusted HR 1·87 (95% CI 1·33–2·62), P < 0·0001; adjusted HR 1·86, 95% CI 1·24–2·81, P = 0·003; Fig 1C,D) indicating that although remission rates did not differ, the treatment protocol for younger patients may well give a better quality of remission, although this cannot directly be tested without markers for minimal residual disease. When toxicity was considered, only diarrhoea was significantly different between trials (P = 0·03, Table 1).

Although AML15 patients performed better than those in AML16, it must be noted that some selection will have taken place by the randomizing clinician before trial entry. Indeed, AML16 patients tended to have worse cytogenetics than those in AML15, even though this would not be known until after trial entry. However, importantly, there was no signal of additional toxicity with the more intensive regimen in this age group and no detriment in mortality at any stage. The benefit for AML15 over AML16 remained even after adjusting for possible confounders.
The poor outcome in older patients with AML is well recognized. The definition of what constitutes “older” has been, to some extent, arbitrary and clearly not all 60-year-olds are alike. Previously, Büchner et al (2009) noted that patients older than 60 years do less well than patients under 60 years. However, our results demonstrate that a strict interpretation of age cut-off (over vs. under 60 years) may not serve well patients on either side of the divide if applied indiscriminately. At least some patients over 60 years of age perform well if treated on younger protocols, and this extends the results of Derolf et al (2009) who showed that some older patients at least, do well on intensive treatment regimens. At the very least, trial designs should not be prescriptive on age: indeed, the findings pose the question of whether the definition of “older” should be revised upwards, or even abolished altogether in favour of a uniform trial for patients fit for intensive treatment.
Conflict-of interest disclosure
None Declared.
Author's contribution
Imran Mohamed, Robert K Hills: Analysed the data, Wrote the Paper; Alan K Burnett: Designed the research study, Contributed essential tools, Critically revised the paper.


