Possible links between phenotypic variability, habitats and connectivity in the killifish Aphaniops stoliczkanus in Northeast Oman
Funding information
This work was funded by Geo-Resources Environmental and Earth Science Consultants under SQU consultant project number CR/AGR/FISH/20/03.
Abstract
There is a significant gap in our knowledge of the intraspecific morphological variability in freshwater fish, although such data are crucial for understanding species diversity. Here we use the killifish Aphaniops stoliczkanus (Day, 1872; Aphaniidae: Cyprinodontiformes), which is a widespread but poorly known freshwater species in the Middle East, to investigate variability in morphological traits within and between its populations. As otolith morphology is known to evolve on ecological timescales and can signal the presence of cryptic lineages, a special focus lies on otolith variability. Based on samples from six populations in northern Oman, we found that variation in pigmentation, disparities in body shape and otolith variability can be associated with distinctive environmental conditions. The unique otolith shape of A. stoliczkanus from a hot sulphuric spring (Nakhal) suggests that a cryptic lineage may have emerged there. Our new data can serve as a benchmark for future studies on the diversity of Aphaniops and other Aphaniidae and help to clarify whether cryptic diversity is present in some lineages. Moreover, our data can serve as an actualistic model for studies on fossil fishes, in which morphological characters provide the only accessible data source for taxonomic and phylogenetic interpretations.
1 INTRODUCTION
Knowledge of intraspecific variation is important for understanding the diversity of a species, which in turn, has implications for taxonomy, conservation biology and habitat protection (Mimura et al., 2017). Additionally, data on intraspecific morphological variation are an important source of information for studies on fossil fishes, which depend on morphological characters for taxonomic and phylogenetic interpretations, and where the observed variation is often difficult to interpret. Here we use the killifish Aphaniops stoliczkanus (Day, 1872; family Aphaniidae Hoedeman, 1949, order Cyprinodontiformes) as a model to investigate variability in morphological traits within and between its populations.
Species of Aphaniops and Aphaniidae are known for rapid interspecific diversification in isolation and have been widely used to study genetic and morphological diversification (Buj et al., 2015; Chiozzi et al., 2018; Esmaeili et al., 2020; Ferrito et al., 2013; Gonzalez et al., 2018; Tigano et al., 2006). In contrast, only few studies have investigated their intraspecific variation and the role of environmental parameters in producing such variation (Annabi et al., 2013; Teimori, Jawad, et al., 2012; Teimori, Iranmanesh, et al., 2021). Aphaniops stoliczkanus (Day, 1872) is the most widespread species of the genus Aphaniops Hoedeman, 1951 (Teimori et al., 2018). First described from the Rann of Kutch Peninsula of India, it also occurs in various types of inland aquatic habitats along the Persian Gulf, the Gulf of Oman and the Arabian Sea (Freyhof et al., 2017; Wildekamp, 1993). Like most species of Aphaniops, A. stoliczkanus tolerates a wide variety of temperatures, water chemistry and substrates and is able to thrive in environments that are unsuitable for other fish (Clavero et al., 2007; Haas, 1982). Previous works have focused on the morphological or molecular discrimination of A. stoliczkanus from its congeners (Charmpila et al., 2020; Freyhof et al., 2017; Teimori et al., 2018), but few data are available about the intraspecific variation of this species.
The aim of this study is to explore intra- and inter-population phenotypic variations in A. stoliczkanus and to discuss possible links between variability of traits, types of habitats and connectivity. A particular focus lies on the otoliths as they are known to evolve on ecological time scales (i.e. across a few generations, see Carroll et al., 2007) and can also reflect genetic diversity (Reichenbacher & Sienknecht, 2001; Vignon & Morat, 2010; Volpedo & Echeverría, 2003). In order to confirm the species identification, molecular analysis was also conducted. Our new data can serve as a benchmark for future studies on the diversity of Aphaniops and other Aphaniidae, help to clarify whether cryptic diversity is present in some of their lineages and will also be valuable for future habitat management in the study area (northern Oman). Moreover, our new data can serve as a standard for taxonomic studies and phylogenetic interpretations of fossil fish otoliths and skeletons.
1.1 Otoliths
Otoliths are hard structures in the inner ear of bony fish, which form part of sensory organs that enable the organism to perceive acceleration of motion and are vital for the senses of balance and hearing (Popper et al., 2005). Consisting mainly of aragonite with a small proportion of organic material and some trace elements (Campana, 1999; Carlström, 1963), they come in three pairs, known as saccular, lagenar and utricular otoliths, respectively (Nolf, 1985). As their morphology is species-specific, otoliths can be used to identify fish species and also to identify fish consumed by predators (Disspain et al., 2016; Nolf, 2013; Schwarzhans, 2013). Additionally, otoliths can also be used to differentiate between populations and stocks (Campana & Casselman, 1993; DeVries et al., 2002). A particular interesting aspect is that otolith morphology can evolve on ecological time scales and may indicate presence of cryptic lineages (La Mesa et al., 2020; Reichenbacher et al., 2009; Teimori, Iranmanesh, et al., 2021).
2 MATERIALS AND METHODS
2.1 Fish sampling and sites
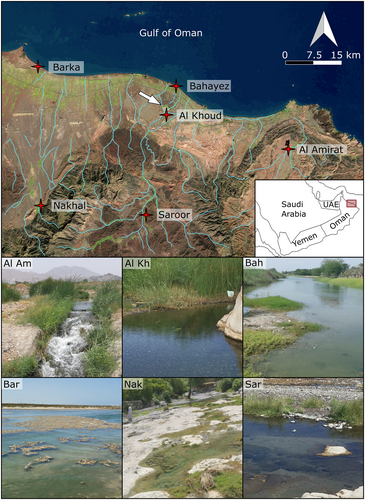
A total of 256 fish specimens were collected using hand nets from two coastal (Barka, Bahayez) and four land-locked sites (Al Khoud, Al Amirat, Nakhal, Saroor) (Figure 1, Table 1). Each sample represented a day's catch. The fish were euthanized with an overdose of benzocaine (100 mg/L, see Barker et al., 2002) and were fixed in 80% ethanol to ensure preservation of the otoliths. The sampling of the animals complied with protocols on animal welfare laws, guidelines and policies as approved by the responsible governmental authorities of Oman (reference number CR/AGR/FISH/20/03). The samples are stored in the Department of Earth and Environmental Sciences at Ludwig-Maximilians University (LMU) in Munich.
| Locality | n (m/f) | SL in mm, Ranges (mean) | np (m/f) | nxo(m/f) | Coordinates of site |
|---|---|---|---|---|---|
| Barka | 35 (13/12) | 26.6–44.8 (33.2 ± 3.4) | 16 (10/6) | 19 (12/7) | 23° 43′ 33” N, 57° 49′ 59″ E |
| Bahayez | 44 (23/21) | 25.4–41.4 (32.1 ± 3.5) | 16 (11/5) | 21 (13/8) | 23° 40′ 47” N, 58° 11′ 36″ E |
| Al Khoud | 35 (19/16) | 24.8–48.8 (36.4 ± 5.6) | 15 (10/5) | 22 (13/9) | 23° 34′ 33” N, 58° 07′ 06″ E |
| Saroor | 68 (41/27) | 25.0–47.1 (33.6 ± 4.9) | 18 (10/8) | 24 (12/12) | 23°21′38″ N, 58°06′25″ E |
| Al Amirat | 47 (24/23) | 22.6–45.6 (31.2 ± 4.4) | 15 (10/5) | 20 (12/8) | 23° 31′ 42″ N, 58° 29′ 00″ E |
| Nakhal | 27 (12/15) | 23.7–45.4 (33.9 ± 5.4) | 12 (8/4) | 16 (8/8) | 23° 22′ 51” N, 57° 49′ 36″ E |
| Total | 256 | 22.6–48.8 (33.2 ± 4.8) | 92 | 122 |
- Abbreviations: n, total number of specimens, number of males (m) and females (f) is given in brackets; np, number of specimens photographed; nxo number of specimens x-rayed and used for otolith study; SL, standard length.
2.1.1 Coastal sites
Barka is an estuary and has a stable connection to the Gulf of Oman. In Bahayez (mentioned as “Sib” in Teimori, Jawad, et al., 2012; Teimori et al., 2018) the connection with the sea is intermittent, with influx of seawater occurring only during heavy rains (L.J., personal observation).
2.1.2 Inland sites
Saroor (upstream) and Al Khoud (downstream) are connected by a narrow stream (Figure 1). They were formerly linked to Bahayez, but the Al Khoud dam, constructed in 1985, now separates both from the lower reaches of the catchment (Al-Ismaily et al., 2013, arrow in Figure 1). Nakhal, at the base of the Hajar Mountains, is a small stream, which is fed by the Al Thowarah hot spring (Sarangadharan & Nallusamy, 2015). The Nakhal stream, together with other small tributaries from the Hajar Mountains, form a branching network, which flows into the estuary at Barka. Al Amirat also rises in the Hajar Mountains, within the Wadi Hatat anticline (Searle, 2019). The drainage network of the anticline (and of Al Amirat) is itself isolated from the western part of the Hajar Mountains (Figure 1).
Ecological information about the sites is available from photographs, satellite imagery and literature review (Abulibdeh et al., 2021; Al-Rawas & Valeo, 2010; Kusky et al., 2005; Sarangadharan & Nallusamy, 2015) and is supplemented by personal observations made by one of us (SA-J). The Barka site lacks vegetation, and the stream flows over pale yellow sand. The sites at Bahayez, Al Khoud, Al Amirat, Nakhal and Saroor all show either algal growth or vegetation along their banks; vegetation is less dense in Al Khoud than at the other sites.
2.2 Molecular analysis
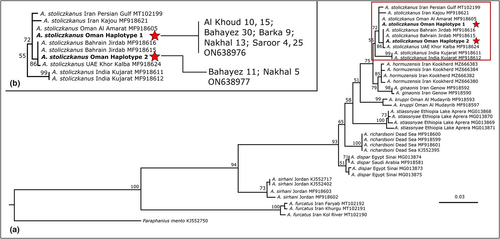
Total genomic DNA was isolated from the fins of one male and one female specimen from each locality using a standard extraction procedure (Geneaid Tissue DNA Kit, Biotech). Attempts to extract DNA from the Al Amirat and amplification of one of the Barka specimens failed, but partial cytochrome b sequences were obtained from both Barka specimens. The GenBank accession number for cytb for the Barka specimens is ON637260. The mitochondrial gene for cytochrome c oxidase subunit 1 (COI) was amplified using primer pairs FishF1 and FishR1 (Ward et al., 2005) and the cytochrome b (cytb) gene was amplified with BarbusCTB-interF (5'-GGCTCYTAYCTBTAYAARGAAAC-3′) (this study) and Thr-R primer pairs (Machordom & Doadrio, 2001). Amplification was performed on a Proflex PCR System (Applied Biosystems), using the following temperature profile: 94°C for 3 min for initial denaturation, 35–40 cycles of 92°C for 45 s, 49–52°C for 90 s and 72°C for 105 s, followed by 72°C for 7 min as the final extension for COI; and for cytb, initial denaturation at 94°C for 3 min, 35 cycles of 94°C for 45 s, 48°C for 90 s and 72°C for 105 s, followed by final extension at 72°C for 7 min. After purification of the PCR products with the ExoASP-IT® (usb) kit, they were sequenced by the Sanger method at the Macrogen Service Centre (Amsterdam, Netherlands), and Geneious Prime 2021.2.2 (Biomatters Ltd.) was used to read and edit the DNA chromatograms in order to generate accurate COI and cytb sequences of A. stoliczkanus. The resulting sequences were aligned with homologues from the nine species of Aphaniops and Paraphanius mento (Heckel, 1843) available in GenBank, using the Clustal W multiple-alignment accessory application implemented in Geneious Prime. Identical sequences for COI were collapsed into unique haplotypes with Fabox 1.5 (Villesen, 2007). Their GenBank accession numbers are ON638976 (haplotype 1) and ON638977 (haplotype 2) (Figure 3). Partition Finder 2.1.1 (Guindon et al., 2010; Lanfear et al., 2012, 2017) was used to select the best-fit partitioning schemes and substitution models for the subsequent phylogenetic analysis. For phylogenetic reconstruction, the maximum-likelihood (ML) method in Randomised Axelerated Maximum Likelihood (RAxML) 8.2.12 (Stamatakis, 2006) through CIPRES Science Gateway (Miller et al., 2010) was used with 1.000 bootstrap replicates based on the GTR + G nucleotide substitution model. The resulting phylogenetic tree was edited in FigTree 1.4.3 (Rambaut & Drummond, 2012) and Adobe Photoshop.
2.3 Body morphometry and meristic counts
All specimens were subjected to body morphometry, while 15–20 specimens from each locality were selected for the study of pigmentation and meristic characters (Table 1). About 15 specimens (usually 10 males/5 females) from each locality were photographed for comparisons of variation in pigmentation, and samples of about 20 of the larger specimens from each locality were X-rayed to obtain meristic data (Table 1). X-ray analysis was conducted with a Faxitron Bioptics instrument at the Bavarian State Collection of Zoology. The choice of larger specimens enabled optimal X-ray images.
Body proportions were measured to the nearest 0.1 mm under a stereo microscope with digital callipers. Measurements included total length (TL), standard length (SL), anal-fin base (Ab), body depth (B), caudal peduncle depth (CP), pre-dorsal length (SN/D) and pre-anal distance (SN/A; Figure S1a). Morphometric variables were calculated based on standardisation of measurements with respect to SL. Meristic counts were performed based on the X-ray images and include: numbers of abdominal vertebrae, caudal vertebrae (including the terminal centrum), dorsal-fin rays (all rays), anal-fin rays (all rays), branched caudal-fin rays and anal-fin pterygiophores (Figure S1b). In addition, the numbers of preural vertebrae and modified caudal vertebrae were counted; the definition of modified caudal vertebrae followed Charmpila et al. (2020).
2.4 Otolith preparation, morphology and morphometry
The samples subjected to X-ray analysis were also used to obtain otolith data (Table 1). Saccular otoliths were extracted through the operculum according to the method of Wakefield et al. (2016). Otoliths were cleaned, mounted on stubs and coated with gold for SEM imaging using a HITACHI SU 5000 Schottky FE-SEM at the Department of Earth and Environmental Sciences (LMU Munich).
Study of otolith variation was analysed based on (i) visual inspection of the otolith morphology using the SEM images, (ii) otolith morphometry following Reichenbacher et al. (2007) (Figure 2a), (iii) otolith shape indices according to Tuset et al. (2003) and Bostanci et al. (2015) and (iv) Elliptical Fourier Analysis (EFA) using Shape 1.3 (Iwata & Ukai, 2002; Figure 2c). Measurements for otolith morphometry and shape indices were done with ImageJ (Schneider et al., 2012). Calculation of otolith variables, otolith shape indices and extraction of Fourier coefficients followed previous works (for details see Appendix S1, Table S1).
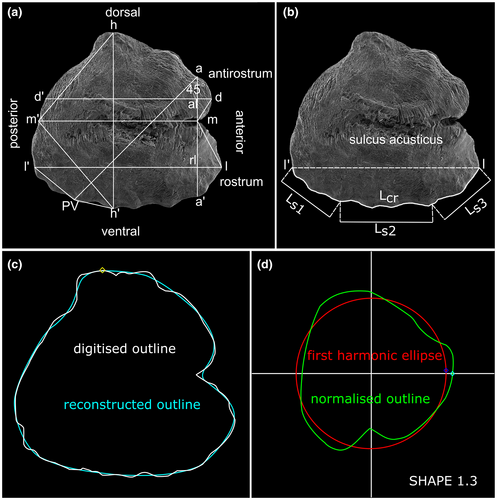
The otolith crenulation index (Ci) is introduced here for the first time to quantify the degree of crenulation along the ventral margin of an otolith (Figure 2b). This parameter is equivalent to the mountain-front sinuosity index used in geomorphology (Fountoulis et al., 2015). Ci is obtained by measuring the length of the crenulated ventral margin (Lcr) along the landmarks l and l' of the otolith, and then dividing Lcr by the total length (Ls) of three straight-line segments that run parallel to the ventral margin (Figure 2b), that is Ci = Lcr/Ls, where Ls = Ls1 + Ls2 + Ls3.
2.5 Statistical analyses
Statistical analyses were performed in Past 4.0 (Hammer et al., 2001). Morphometric data were tested for normal distribution using Shapiro–Wilk's test (p > .05 for normal distribution) and for correlation with standard length using Pearson's test (no correlation if r ≈ 0, p < .05). As almost all morphometric variables were normally distributed and almost no correlation with standard length was detected, ANOVA with Tukey's post-hoc test (p < .05) was used to detect between-group differences (Schmider et al., 2010). For meristic data, which as such are not normally distributed, the non-parametric Kruskal-Wallis test was performed and Dunn's post-hoc test with Bonferroni's correction (p < .05) was applied for pairwise comparisons. Cluster analysis (Ward's method) was carried out based on the mean values of the body morphometric and otolith variables of each group to illustrate the phenetic similarities.
3 RESULTS
In the following text, the terms site, locality and sampling site are used synonymously; and the term population refers to the group of specimens from an individual site.
3.1 Phylogenetic analysis
Partial cytb sequences (~850 nucleotides) were obtained for the samples from Barka. Comparison with sequence data available from GenBank confirmed that these specimens belong to A. stoliczkanus. The specimens that were analysed based on their COI gene sequences cluster with other A. stoliczkanus from the Middle East in our phylogenetic tree (Figure 3). Specimens of A. stoliczkanus from India formed a highly supported clade, which was a sister clade to all other A. stolizckanus from the Middle East, as noted in earlier reports (Esmaeili et al., 2020; Freyhof et al., 2017). Aphaniops ginaonis (Holly, 1929) + A. hormuzensis (Teimori et al., 2018) emerges as sister to the A. stoliczkanus clade. The new specimens bear two haplotypes, which differed in a single nucleotide (indicated by stars in Figure 3).
3.2 Pigmentation
All specimens are predominantly golden yellow in colour, with some dark brown reticulation on the dorsal part (Figure S2). The belly is light yellow to white. Both males and females have a single semi-circular dark grey marking posterior to the operculum. As is the norm for species of Aphaniops, there is clear sexual dimorphism in pigmentation (Figure S2).
3.2.1 Intra-population variation
There is almost no intra-population variation in the pigmentation, apart from the number of vertical bars on the posterior end of the body in males, which can vary from zero to nine.
3.2.2 Between-population variation
Only the specimens from Barka deviate in pigmentation from the other populations as both females and males have slightly lighter colouring, less pronounced dorso-ventral shading and a less pronounced contrast of the flank bars and stripes (Figure S2). The caudal fins of these specimens are also lighter in colour, especially in the females, and the contrast between stripes in the males is less marked.
3.3 Body morphometry
Apart from the pre-dorsal lengths for the Al Amirat and Al Khoud specimens, all morphometric variables are normally distributed and almost no correlation with SL is observed (weak correlation occur in the anal-fin base for Saroor, body depth for Al Khoud, caudal peduncle depth in Nakhal).
3.3.1 Intra-population variation
Intra-population variation was assessed based on the overall dispersion of parameter values, as depicted in the box plots (Figure S3) and quantified by the standard deviations (Table S2). Overall, the coastal population from Barka, followed by the coastal population from Bahayez are more homogeneous than the others. The level of intra-population variation is slightly higher in the inland sites Al Khoud, Al Amirat and Nakhal, whereas the specimens from Saroor are similar homogeneous as those from Bahayez (Figure S3, Table S2).
3.3.2 Between-population variation
The morphometric variables show a quite consistent pattern across the specimens from all localities (Figure S3). However, the specimens from the coastal sites (Barka, Bahayez) exhibit significantly higher body depths and caudal peduncle depths than those from the four inland sites (Table 2). The only other variable that differs between the populations is the pre-anal distance (Table 2).
| n | Barka | Bahayez | Al Khoud | Saroor | Al Amirat | Nakhal | |
|---|---|---|---|---|---|---|---|
| Barka | 35 | x | |||||
| Bahayez | 44 | SN/A | x | ||||
| Al Khoud | 35 | B, CP | B, CP, SN/A | x | |||
| Saroor | 68 | B, CP, SN/A | B, CP | SN/A | x | ||
| Al Amirat | 47 | B, CP, SN/A | B, CP, SN/A | B | B | x | |
| Nakhal | 27 | B, CP | B, CP, SN/A | - | SN/A | - | x |
3.4 Meristic counts
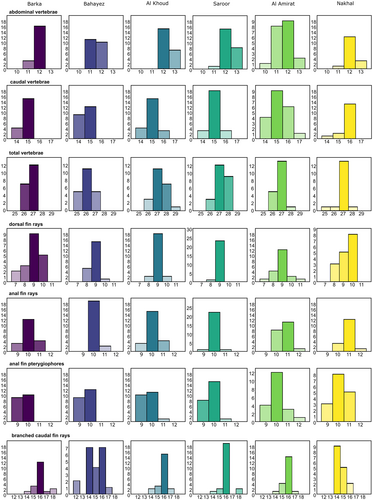
Based on the mean values of all data, the predominant total number of vertebrae in A. stoliczkanus is 27, usually 12 abdominal and 15 caudal vertebrae. The average numbers of dorsal and anal-fin rays are 9 and 10, respectively, and the usual number of branched caudal-fin rays is 16 (Table S3). There are three preural vertebrae and a single modified caudal vertebra in almost all specimens.
3.4.1 Intra-population variation
Each population shows a rather limited degree of intra-population variation, but some trends can be discerned: (i) the range of variation in the numbers of abdominal, caudal and total vertebrae in the specimens from the coastal sites (Barka, Bahayez) is slightly narrower than in the remainder; (ii) few variation is present in the numbers of dorsal and anal-fin rays in Saroor; (iii) the specimens from Al Amirat reveal slightly higher levels of variation in numbers of abdominal and caudal vertebrae, dorsal-fin rays and anal-fin pterygiophores than are seen in the other populations (Figure 4).
3.4.2 Between-population variation
The specimens from Bahayez and Barka tend to have slightly lower numbers of vertebrae than the inland populations, this difference is significant in the case of Bahayez (Figure 4, Table 3). The population from Nakhal differs significantly in the number of branched caudal-fin rays from the remainder (14 versus 16, except Bahayez). Nakhal also tends to show higher maximal numbers for the caudal vertebrae (16 versus 15) and dorsal-fin rays (10 versus 9). Moreover, for the specimens from both Nakhal and Al Amirat, the number of anal-fin rays is significantly different versus the remainder (11 versus 10; Figure 4, Table 3).
| n | Barka | Bahayez | Al Khoud | Saroor | Al Amirat | Nakhal | |
|---|---|---|---|---|---|---|---|
| Barka | 19 | x | |||||
| Bahayez | 21 | CR | x | ||||
| Al Khoud | 22 | - | aV, tV | x | |||
| Saroor | 24 | - | CR, aV, tV | - | x | ||
| Al Amirat | 20 | AR | AR, cV, tV | AR, aV | AR | x | |
| Nakhal | 16 | AR, CR | AR, aV, tV | AR, CR | AR, CR | CR | x |
3.5 Otolith morphology
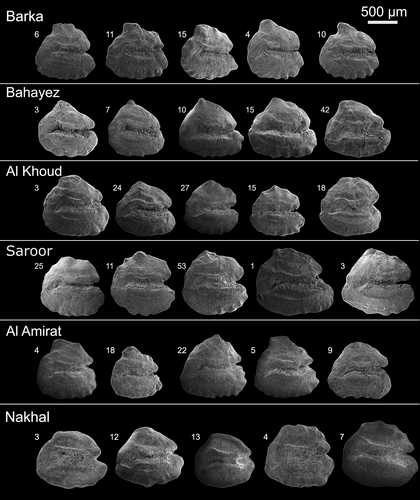
The otoliths of A. stoliczkanus from each site are generally rounded-to-triangular in shape (Figure 5). In most specimens, the dorsal margin has a more or less prominent tip at the middle or slightly behind the middle, which may form a well-defined peak (e.g. in Bahayez) or be slightly bent posteriorly (e.g. in Barka; Figure 5). The ventral margin usually shows crenulations. Crenulations are sometimes present on the posterior and dorsal margins as well. The rostrum is usually longer than the antirostrum, but exceptions occur. The excisura is triangular and weakly to sharply incised. The sulcus is deep, nearly straight and bent at the posterior end.
3.5.1 Intra-population variation in otolith morphology
Evaluation of intra-population variation is based on the SEM images, the scatter of otolith morphometric values (Figure S4), the values of the standard deviations obtained for otolith morphometric variables and shape indices (Tables S4 and S5) and on Principal Component Analysis (PCA) of the Fourier coefficients (Figure S5).
Barka
No major deviations occur, ranges and standard deviations are lower than for all the other populations analysed. Small variations may occur in the lengths and heights of the rostrum and antirostrum (Figure 5; Figures S4 and S5; Tables S4 and S5).
Bahayez
The sharply defined dorsal tip is pointing straight up or bent slightly backwards. The excisura angle varies widely. The quantitative analysis reveals clear variation in medial-, rostrum-, antirostrum length, shape indices, aspect ratio and excisura depth (Figure 5; Figures S4 and S5; Tables S4 and S5).
Al Khoud
The overall contour is varying from nearly rectangular to triangular to circular; the dorsal tip is usually small, crenulation is generally weak (Figure 5). Otolith morphometry, shape indices and Fourier Shape analysis indicate distinct variation, with ranges similar to those seen in the sample from Bahayez (Figures S4 and S5; Tables S4 and S5).
Saroor
There is marked variation in the convexity of the margins, with some otoliths being distinctly triangular, while others are nearly circular in outline and also the dorsal tip varies in shape and prominence (Figure 5). Otolith morphometry and Fourier Shape analysis indices indicate that the range of diversity is generally narrower than in the Bahayez population (with the exception of antirostrum height and length; Figures S4 and S5; Tables S4 and S5).
Al Amirat
The otoliths show a comparatively short dorsal length, which endows them with a distinctly triangular shape; the dorsal tip is often tilted backwards (Figure 5). Otolith morphometry and shape indices indicate ranges for most variables comparable to those seen in Bahayez, except for the antirostrum height and posterior angle (Figures S4 and S5; Tables S4 and S5). Fourier Shape analysis shows variations arising from differences in aspect ratio (PC1 in Figure S5), depth of the excisura and rostrum length (PC2) and relative antirostrum length (PC 3).
Nakhal
The otoliths from this site are typically rounded and longer than tall, the ventral margin is mostly quite smooth, and several specimens lack a dorsal tip (Figure 5). The excisura is highly diverse and can be shallow, triangular or deeply incised. Otolith morphometry and Fourier Shape analysis indicate lower ranges of variation as seen in Bahayez for most variables, except the excisura angle (Figures S4 and S5; Tables S4 and S5).
3.5.2 Between-population variation in otolith morphology
Variation between populations can be readily discerned by visual inspection of the overall otolith contour and its prominent modifications, for example presence or absence of a dorsal tip and crenulation of margins (Figure 5). The mesa-like dorsal projection in the otoliths from Barka is particularly striking, while the specimens from Bahayez have a sharply peaked dorsal tip, unlike the broader dorsal slopes seen on the otoliths from the other sites (Figure 5). The otoliths from Nakhal can be most easily distinguished from the others owing to the lack of a clearly defined dorsal tip and a comparatively shorter rostrum and antirostrum (Figure 5). Statistical tests of otolith morphometry and the mean otolith outlines obtained from the PCA of the Fourier coefficients confirm the presence of clear differences between the populations (Table 4; Figures S4 and S5). The crenulation index is different between Barka and Nakhal. Form factor and circularity separate Saroor from Nakhal and Al Khoud (Table 4).
| n | Barka | Bahayez | Al Khoud | Saroor | Al Amirat | Nakhal | |
|---|---|---|---|---|---|---|---|
| Barka | 19 | x | |||||
| Bahayez | 21 | D, RE | x | ||||
| Al Khoud | 22 | R, AL, RE | M, A, R, AL, RL | x | |||
| Saroor | 24 | M, A, AL, RL, E | M, A, R, AL, RL, E | M, AL, FF, CY, RE | x | ||
| Al Amirat | 20 | - | D, M, R, RE | RE | RL | x | |
| Nakhal | 16 | D, RE, Ci | - | R | D, M, RL, FF, CY | RE | x |
- Note: For data see Tables S4, S5, S6.
- Abbreviation: n, number of specimens used. Abbreviations for otolith morphometry: A, relative antirostrum height; AL, relative antirostrum length; D, relative dorsal length; E, excisura angle; M, relative medial length; R, relative rostrum height; RL, relative rostrum length. Abbreviations for otolith shape indices: Ci, Crenulation index; CY, circularity; FF, form factor; RE, rectangularity.
- The grey font (shading) indicates that the cells are left empty to avoid repetition of information.
3.6 Phenetic similarities between populations based on body morphometry and otoliths
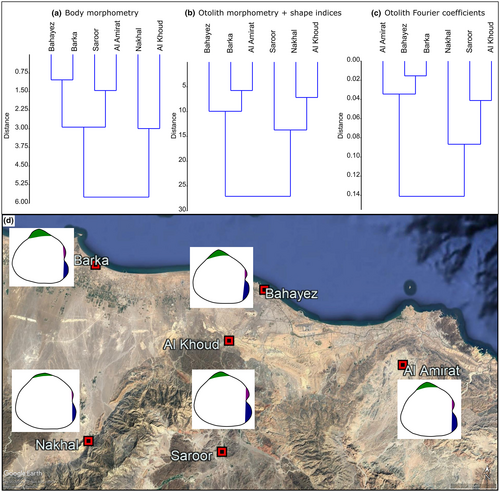
Cluster analysis (Ward's method) based on the body morphometric variables clearly separates the coastal populations into one group and the inland populations into another (Figure 6a). Two main groups are also obtained when the otolith morphometric variables and shape indices are used for a cluster analysis. In this case, Barka and Bahayez group with Al Amirat, while the second cluster contains the inland sites Saroor, Al Khoud and Nakhal (Figure 6b). Almost the same groups are obtained when otolith Fourier coefficients are used (Figure 6c).
4 DISCUSSION
The results presented in this study record distinctive differences within and between the studied populations of A. stoliczkanus, which are discussed below.
4.1 Lighter pigmentation in the specimens from the coastal site Barka
The pigmentation of the studied populations of A. stoliczkanus largely matches those reported in previous works on A. stoliczkanus from other regions in the Middle East (Freyhof et al., 2017; Teimori et al., 2018). This validates the use of pigmentation patterns for species identification in Aphaniops (Freyhof et al., 2017). However, the studied specimens from Barka deviated slightly from the general pattern insofar as their colouration was lighter and countershading was less pronounced (Figure S2). It is known that variation in pigmentation may result from sexual selection and/or ecological factors, such as temperature, salinity, turbidity or algal coverage (Endler, 2006; Kodric-Brown, 1989; Price et al., 2008). Bright colours are an ornamental sexual trait that aids in attracting mates, while countershading (depending on light conditions) and stripes (e.g. camouflage against algal mats) achieve background matching and serve to avoid predators (Cavraro et al., 2021; Kjernsmo & Merilaita, 2012; Phillips et al., 2017). The lighter specimens in Barka are reminiscent of pigmentation differences observed between the Mediterranean species Aphanius fasciatus (Valenciennes, 1821) from natural creeks (lighter colouration) and man-made inlets (darker colouration), as reported by Cavraro et al. (2021), who utilised the observed pigmentation differences as a measure of habitat quality. Ecological differences between Barka and the other sites include stable connection to marine waters and lack of vegetation on the substrate (Figure 1). Although other factors cannot be excluded, the light pigmentation and lack of countershading in the specimens from Barka most probably provide for background matching with the local light sandy substrate.
4.2 Deeper bodies in the specimens from the coastal sites (Barka, Bahayez)
As described above, the specimens from the coastal sites Barka and Bahayez have greater mean body depths and caudal peduncle depths than those from the inland sites. Such variation may represent an adaptation to hydrological differences between the two categories of habitats (Langerhans et al., 2003; Webb, 1975). The more slender body shapes, as present in the inland specimens (originating from streams), would serve to reduce drag and could, therefore, be an adaptation to a high-velocity environment.
4.3 Consistency and differences in meristic counts
Our data reveal that the ranges of meristic counts are relatively stable across the studied populations of A. stoliczkanus and are also consistent with previous reports on the species from other regions in the Middle East. These traits may thus be meaningful for the taxonomy of A. stoliczkanus (Charmpila et al., 2020; Teimori et al., 2018; Teimori, Schulz-Mirbach, et al., 2012). Nonetheless, we noted some interesting deviations in meristic traits, both in frequency of counts (Figure 4) and mean values (Table S3), that can be linked to differing habitat types. Among these, the slightly lower total numbers of vertebrae in the specimens from Barka and Bahayez (up to 27 versus 28–29) can be related to the deeper bodies of the same specimens relative to those from the freshwater sites as increases in vertebral count often correlate with elongation of the body (as present in the specimens from the freshwater sites; Lindsey, 1975; Tibblin et al., 2016).
Another remarkable result was that A. stoliczkanus from Nakhal and Al Amirat differed from the other populations in having a significantly higher number of anal-fin rays, the specimens from Nakhal also had fewer branched caudal-fin rays (Table 3). Both Nakhal and Al Amirat are geographically distant from the other sites (Figure 1). The site Nakhal is fed by a hot spring, and temperatures and water chemistry may differ from those at the other sites (Sarangadharan & Nallusamy, 2015). The observed variation in meristic traits may be caused by specific environmental conditions at Nakhal and Al Amirat; however, in Nakhal, the otolith shape indicates that genetic divergence could also play a role (see below).
4.4 Otolith morphology
Regarding the different techniques used to quantify otolith morphology, otolith shape indices were the least effective in detecting variation, whereas both Elliptic Fourier Analysis and otolith morphometry were efficient and also yielded the most consistent results. The data indicate that otolith morphologies are similar across all populations, which is consistent with good connectivity between the populations, as is indicated by the dense network of streams in the study area (Figure 1). However, with the exception of the specimens from Barka, we recorded considerable intra-population otolith variability.
Previous works have shown that both genetic variation and environmental conditions can influence the overall otolith shape (Teimori, Iranmanesh, et al., 2021; Vasil'eva et al., 2016; Vignon & Morat, 2010). Keeping in mind that there is good connectivity between our inland populations, and that the study area is a mountaineous region, where temperature, flow conditions and other environmental parameters are subject to rapid change, it can be assumed that each of the studied inland populations (with the possible exception of Nakhal, see below) represents a “mixture” of specimens from different habitats in the adjacent mountains, and that this accounts for the high levels of intra-population otolith variability. The site Barka, in which otolith variation was relatively low, differs ecologically from the others insofar as it is connected to the Gulf of Oman. The low otolith variation of A. stoliczkanus from Barka thus most probably reflects the comparatively homogeneous environmental conditions of a marine habitat relative to freshwater sites within a catchment area in a mountainous region.
Considering all populations it is evident that a clear dorsal tip is typical for the otoliths of A. stoliczkanus from the coastal sites (Barka, Bahayez) and the inland sites located near to the coast (Al Khoud, Al Amirat; Figure 5). In contrast, the dorsal tip is indistinct or absent in the otoliths of A. stoliczkanus from the freshwater sites located far inland (Nakhal, Saroor). Such presence or absence of a dorsal tip in otoliths of A. stoliczkanus from populations near to the coast, respectively far inland, have previously been noted by Reichenbacher et al. (2009) and Teimori, Jawad, et al. (2012). This consistent pattern indicates that environmental factors that depend on the geographic distance to the sea (e.g. differences in chemistry, salinity, pH value) are the main causal factors in producing a dorsal tip in the otoliths of A. stoliczkanus, and that genetic determinants, as proposed by Reichenbacher et al. (2009), did not play a major role in shaping this specific trait.
Moreover, each population shows some peculiarities in its specific otolith morphology (Figures 5 and 6d). Otoliths from Al Khoud and Saroor have a similar overall contour, but are distinct from the otoliths of the Bahayez population (Figure 6b,c), although all three localities belong to the same drainage system (Figure 1). These clear differences may be a combined effect of habitat differences and the genetic isolation of the Bahayez specimens, as Bahayez is located near to the coast and isolated from the other two sites by the Al Khoud dam, which was built in 1985 (Al-Ismaily et al., 2013).
The most distinctive otolith morphology is found in A. stoliczkanus from the hot spring at Nakhal. Previous work on A. stoliczkanus from hot springs in southern Iran demonstrated that specimens from geographically separated hot springs clearly differed in otolith morphology, in spite of originating from similar habitats (Teimori, Schulz-Mirbach, et al., 2012). It is thus likely that the specific otolith shape of A. stoliczkanus from Nakhal is not only related to the hot spring conditions, but also results from genetic drift in a comparatively isolated population, as Nakhal is one of the most remote sites in the study region (Figure 1). As stated above, meristic traits are usually not variable in A. stoliczkanus, but significant differences in caudal- and anal-fin rays are found between the specimens from Nakhal and almost all other populations (Table 3). This reinforces the hypothesis of genetic drift and possible emergence of a cryptic lineage at Nakhal, as indicated by the otolith morphology.
That isolated freshwater populations of the genus Aphanius are capable of evolving into new species within short periods of time, undetectable by external phenetic traits, is well known (Esmaeili et al., 2014), but has not yet been proven for Aphaniops. Our otolith data indicate that cryptic species could be present among the populations currently known as A. stoliczkanus and should be further investigated. This is also important in terms of conservation of genetic diversity and habitat management, especially in the still poorly known inland aquatic habitats of the Middle East.
5 CONCLUSIONS
We document a notable range of variation within and between populations of A. stoliczkanus in some morphological traits. Variation in pigmentation appears to be related to substrate colour and light conditions, while disparities in body shape are linked to differing hydrological conditions, for example flow rates. Otolith variation was lowest in the population sampled from an open marine coastal site, where environmental conditions are more stable, but was more pronounced within and between the populations from the freshwater sites, where temperature, flow rates and the nature of the substrate may be subject to rapid changes.
Overall, diversity in counts of anal- and branched caudal-fin rays, as well as otolith variation, can be associated with environmental parameters and differing levels of connectivity between populations from diverse freshwater habitats. Genetic drift is indicated by both otolith shape and meristic traits for A. stoliczkanus from the hot spring site Nakhal. This population could represent a cryptic lineage, currently undetectable by other morphological traits and also not by the COI gene used in this study.
Our new data on the variability of morphological characters within a geographically widespread killifish can serve as a benchmark for future studies on the diversity of Aphaniops and other Aphaniidae and also help to clarify whether cryptic diversity is present. Furthermore, our data can serve as an actualistic model for future studies on fossil fishes, where body morphometry, meristic characters and otolith morphology commonly constitute the only accessible data source for taxonomic and phylogenetic interpretations and biogeographic considerations.
ACKNOWLEDGEMENTS
We are grateful to Mr Saleh Naghmush Al Saadi, Director of Biodiversity, Environment Authority for granting us the permission to collect fish specimens from the inland waters of Oman. We thank Andrea Herbert Mainero (LMU Munich, Germany) for her assistance in X-raying, otolith extraction and tissue preparation for the molecular analysis. Ulrich Schliewen (SNSB-ZSM, Munich) is acknowledged for providing access to the Faxitron X-ray facilities. The project is part of a collaboration between Sultan Qaboos University and Shiraz University and was funded by Geo-Resources Environmental and Earth Science Consultants owned by Mr. Ahmed Al Ghafri whom we thank for support science, under SQU consultant project number CR/AGR/FISH/20/03. Finally, we thank the reviewers for their constructive review of an earlier version of the mansucript. The authors declare no conflict of interest. Open Access funding enabled and organized by Projekt DEAL.


