Synchrotron microtomography-based osteohistology of Gansus yumenensis: new data on the evolution of uninterrupted bone deposition in basal birds
Funding information
This study was supported by the PSI-SLS grant awarded to Martin Kundrát through support provided by the European Union's FP7 research and innovation programme under grant agreement nr.°312284, project CALIPSO awarded to PSI; the Slovak Research and Developmental Agency under the contract No. APVV-18-0251, Scientific Grant Agency of the Slovak Ministry of the Education, Science, Research and Sport of Slovak Academy of Sciences, and JASRI Spring-8-2018B-1543 and 2019B-1381 awarded to Martin Kundrát.
This study was also supported by the Strategic Priority Research Program of Chinese Academy of Sciences (XDB26000000) and the National Natural Science Foundation of China (41688103 and 41872021), both awarded to You Hail-Lu
Abstract
Many studies of the limb bones from birds of the major clades reveal a mosaic evolution in morphological characters. From this, we assume that uninterrupted compact bone evolved independently multiple times outside of the crown group. We hypothesise that there are key intraskeletal changes in the osteohistological features, such as the organisation of the vascular network. To test these hypotheses, we analysed and described the osteohistological features of five different midshaft samples of Gansus yumenensis, a non-ornithurine Euornithes from China, based on virtual models obtained from synchrotron microtomography scans, a less invasive method that the traditional physical cross section. We performed quantitative analyses with volume, surface area and estimated ratios. The osteohistological features of Gansus yumenensis were compared with those of stem and crown birds. From our analyses, we discuss the pros/cons of using synchrotron microtomography scans compared to traditional physical cross section. Our analyses demonstrate that Gansus yumenensis is the fourth described extinct Euornithes to exhibit uninterrupted bone deposition in all bone samples, providing further support for multiple origins of this feature outside of the bird crown group. Finally, our osteohistological investigation of Gansus yumenensis provides future study avenues regarding the evolution and development of bone tissue in fossil birds.
1 INTRODUCTION
For over 20 years, fossils representing all the major clades of non-neornithine groups (Jeholornithiformes, Sapeornithiformes, Confuciusornithiformes, Enantiornithes and Euornithes) have been excavated and described, revealing changes in the osteohistological features (e.g. organisation of the bone cortex, changes in bone tissue types, presence or absence of growth marks) of long bones in the early evolution of birds (Monfroy & Kundrát, 2021). Most of these histological studies are based on a single bone in one individual (Bell et al., 2010) or several individuals from the same species (Wilson & Chin, 2014). However, in some cases, there are some analyses that look at multiple bones from either the same specimen (Kundrát et al., 2019; Wang, Hao, et al., 2019; Wang, Cau, et al., 2020) or from several individuals (Chinsamy et al., 2020).
- Uninterrupted bone deposition typically observed in the majority of extant birds appeared multiple times in various groups of non-ornithurine Euornithes;
- Intraskeletal osteohistological variability is more commonly observed within the long bones of extinct birds, specifically between the fore- and hindlimb as well as between the elements of a same limb;
- Developmental changes in the complexity of the neurovascular network are observed in the birds outside of the crown group.
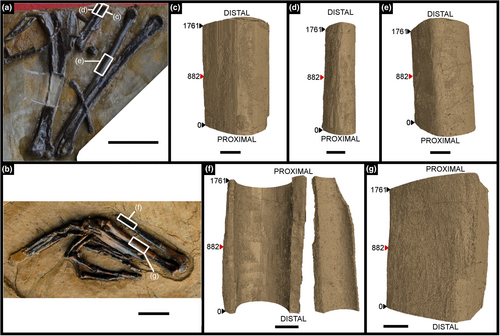
To test these hypotheses, we analysed the osteohistological features of a non-ornithurine euornithians characterised by an almost complete skeleton with several three-dimensional, largely uncrushed and undistorted bones: the tern-sized amphibious bird Gansus yumenensis from the Early Cretaceous (Albian-Aptian) Xiagou Formation of the Changma Basin (Gansu Province, north-western China) (Hou & Liu, 1984; Wang et al., 2015). Recent phylogenetic analyses place Gansus yumenensis just outside the Ornithurae, although its phylogenetic position relative to other Euornithes is still debated (Cau, 2018; Zheng et al., 2018; Wang, Cau, et al., 2020). The three-dimensional preservation of largely uncrushed and undistorted bones (You et al., 2006) makes Gansus yumenensis an excellent candidate for sampling and analysis using advanced high-resolution imaging technology to further test these ideas presented here above. We present here the first osteohistological data of Gansus yumenensis, based on virtual transverse sections and 3D-rendered models of midshaft samples collected from fore- and hindlimb bones obtained through synchrotron microtomography scans of two specimens (Figure 1). We described the osteohistological features throughout the samples and analysed several quantitative traits for the complete samples and the osteohistological features. Finally, we compared our data of Gansus yumenensis with the osteohistological features of previously analysed stem (basal non-pygostylians and pygostylians, non-ornithurine euornithians and ornithurines) and crown birds, so as to test our hypothesis regarding the single or multiple origin of continuous and uninterrupted bone deposition within the long bones.
2 MATERIAL AND METHODS
2.1 Material
2.1.1 Samples of Gansus yumenensis
Numerous specimens of Gansus yumenensis have been excavated to date (You et al., 2006). However, no microstructural analyses have been performed despite the largely three-dimensional preservation of largely uncrushed and undistorted bones, may it be for the analysis of the bone microstructure or the ontogenetic stages. As such, we present here the first osteohistological analysis ever performed on this species.
Five midshaft samples were taken from two specimens of Gansus yumenensis in the IVPP collection: specimens IVPP V21692 and V21693 (Figure 1). Both specimens were excavated from the Changma locality (Suarez et al., 2013) by H-L. You in 2005, and most likely belong to the same individual.
- The proximal end of the humerus exhibits a ventral tubercle, along with a capital incisure and a domed articular condyle;
- The ulna (slightly longer than the humerus) displays a prominent bicipital tubercle and a deep narrow brachial impression;
- The anterior–posterior diameter of the major metacarpal is more than twice that of the minor metacarpal.
- Presence of an emarginated groove on the tibiotarsus that plesiomorphically lacks a supratendinal pons, indicating the presence of a tibiotarsal extensor canal;
- The tarsometatarsal articular surface of the approximately subequal distal condyles extends onto the tibiotarsal caudal surface;
- Elongate pedal digits (digits III and IV are longer than the tarsometatarsus), for which the first phalanges of all pedal digits are longer than any of their respective distal phalanges;
- Ungals are all small, short and unrecurved with large flexor tubercula.
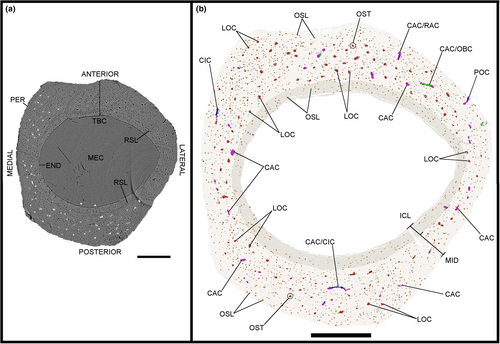
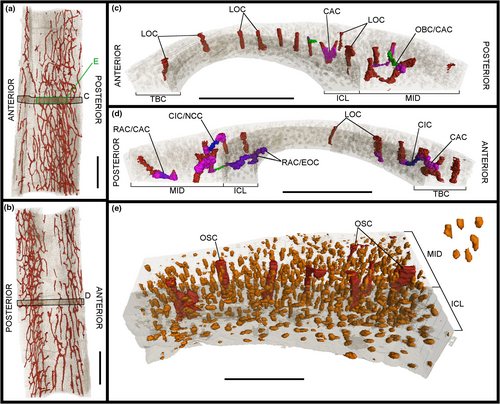
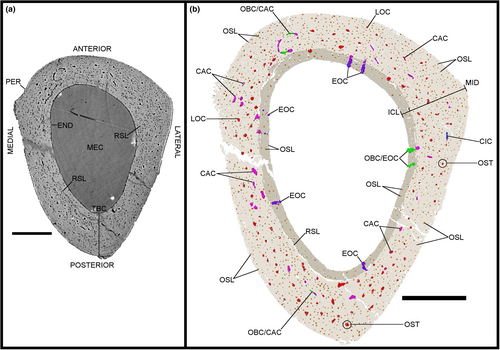
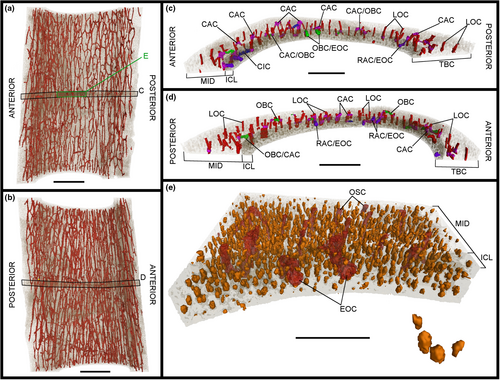
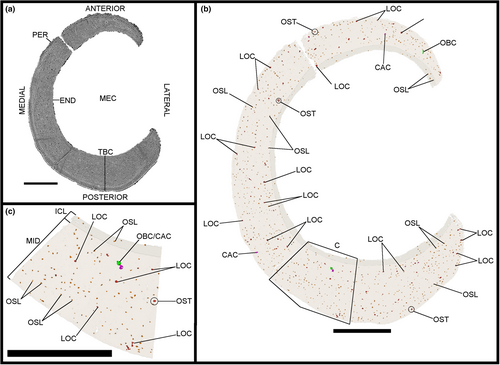
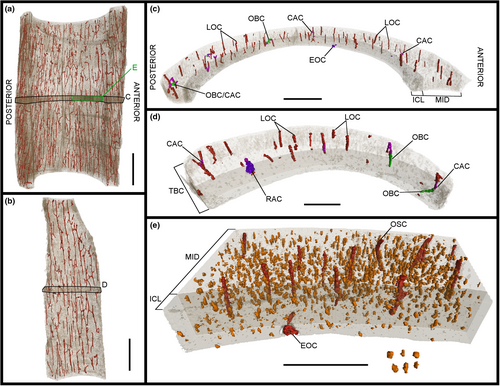
Three midshaft samples from the forelimb elements of the specimen IVPP V21692 were removed: the second metacarpal (Figures 1c, 2 and 3), the third metacarpal (Figures 1d, 4 and 5) and the radius (Figures 1e, 6 and 7). Two midshaft samples were collected from the hindlimb elements of the specimen IVPP V21693: the tibiotarsus (Figures 1f, 8 and 9) and the tarsometatarsus (Figures 1g, 10 and 11). In the case of the tibiotarsus, the sample was fragmented and compressed in situ, and needed to be virtually reconstructed for this study. The overall bone microstructure and osteohistological features of the samples are listed in a table (Table S1).


2.1.2 Samples for comparison
- Four long-tailed avialans Archaeopteryx lithographica BSPG 1999 I 50 (Erickson et al., 2009), Archaeopteryx albersdoerferi SNSB BSPG VN-2010/1 (Kundrát et al., 2019), Jeholornis sp. STM 2–51 (O’Connor et al., 2014) and Kompsornis longicaudus AGB-6997 (Wang, Huang, et al., 2020);
- Two basal pygostylians Confuciusornis sanctus D1874 and CDL-B-07 (Chinsamy, Marugán-Lobón, et al., 2020);
- Two enantiornithines Mirusavis parvus IVPP V18692 (Wang, Hao, et al., 2019) and Mirarce eatoni UCMP 139,500 (Atterholt et al., 2021);
- Six other non-ornithurine euornithians Archaeorhynchus spathula IVPP V20312 (Wang & Zhou, 2017), Patagopteryx deferrariisi MACN-N-03 (Chinsamy et al., 1995; Chiappe, 2002; Chinsamy, 2002; Starck & Chinsamy, 2002), Hollanda luceria MPC-b100/205 (Bell et al., 2010), Iteravis huchzermeyeri IVPP V18958 (O’Connor et al., 2015), Yanornis martini IMMNH-PV00021 (Wang, Hao, et al., 2019) and Khinganornis hulunbuirensis SGM-AVE-2017001 (Wang, Cau, et al., 2020).
- The extinct ornithurine Hesperornis regalis YPM 1,491 (Wilson & Chin, 2014);
- And three extant neornithines with a common kiwi Apteryx australis (Bourdon et al., 2009; Legendre et al., 2014), a mallard Anas platyrhynchos (de Margerie, 2002) and a grebe Podiceps sp. (de Margerie et al., 2005).
These specimens were chosen as their physical transverse sections could be compared with the virtual cross sections obtained for Gansus yumenensis (see Analysis methods for Gansus yumenensis). They were also chosen for their diverse locomotor means and lifestyles, which in turn affects the osteohistological features in the long bones, as well as their phylogenetic position compared to Gansus yumenensis (Monfroy & Kundrát, 2021).
2.2 Methods
2.2.1 Scanning methods for Gansus yumenensis
Synchrotron-based X-ray tomographic scans were performed on the collected midshaft samples on the TOMCAT beamline (TOmographic Microscopy and Coherent rAdiology experiments) of the Swiss Light Source (SLS) at the Paul Scherrer Institute (Villigen, Switzerland) (Stampanoni et al., 2006).
The specimens were fixed with beeswax on 3.15-mm-diameter brass pins. The beam energy was set to 35 keV. The X-rays transmitted and refracted by the samples were converted by a 100-μm-thick Ce doped LuAG scintillator to visible light, magnified by a 4x Olympus microscope objective (UPLAPO4x, 0.16 numerical aperture) and recorded by a sCMOS PCO.edge 5.5 camera (Kelheim, Germany). For each scan, 4001 equiangularly spaced projections over 180 degrees have been acquired, with an exposure time of 400 ms per projection. The sample to detector distance was approximately 50 mm, the effective pixel size 1.625 μm and the covered field-of-view 4.160 x 2.860 mm2.
Phase retrieved (Paganin et al., 2002) dark- and flat-field corrected projections have been reconstructed to tomographic volumes using an optimised pipeline (Marone et al., 2017), based on gridding and a direct Fourier method (Marone & Stampanoni, 2012). The scanning procedures produced for each sample image stack files of 1762 CT images.
2.2.2 Analysis methods for Gansus yumenensis
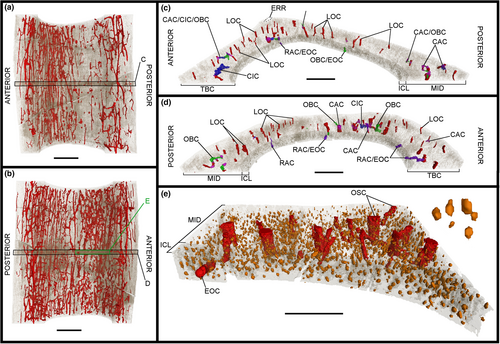
The image stacks obtained from the scans were analysed in the PaleoBioImaging Laboratory at the Center for Interdisciplinary Biosciences (TIP UPJŠ, Košice, Slovakia). We used VGStudio Max 3.0 (Volume Graphics, Heidelberg, Germany) in order to generate and describe the osteohistological features on both the virtual transverse sections and the 3D-rendered models for each sample (Figures 2-11). Some of vascular canals and osteocyte lacunae were filled in during diagenesis with minerals that show up as white inclusions in the scans, or a similar greyscale as the bone cortex. Therefore, with the “region growth” tool of VGStudio Max 3.0, they needed to be carefully processed during manual segmentation. The orientation of the canals was deciphered based on the manual segmentation of 50 virtual slices centred on the middle of the diaphysis in the samples, thereby creating a region of interest (Figures 3c.d, 5c,d, 7c,d, 9c,d and 11c,d). The osteocyte lacunae, due to their high quantity throughout the complete sample, were also analysed based on the manual segmentation of 50 virtual slices from the same region of interest, but in a more restricted fashion in the most significant quadrant of the samples (Figures 3e, 5e, 7e, 9e and 11e).
- Longitudinal for canals that overall run parallel to the long axis of the bone;
- Circumferential for canals that overall run parallel to the circumference of the bone;
- Radial for canals that overall run perpendicular to the circumference of the bone;
- Oblique for canals that have no clearly determined orientation as given here above;
- Canal connections for branching and/or the onset of anastomoses.
The main anatomical and osteohistological features observed in the midshaft of Gansus yumenensis are summarised in Table 1 and detailed in Table S1.
| Specimens | BBT | RSL | PGM | VAN | SEC | |||
|---|---|---|---|---|---|---|---|---|
| ICL | MID | OCL | LAG | ANN | ||||
| Archaeopteryx lithographica | – | PBT? | – | 0 | 0 | 0 | C | – |
| Archaeopteryx albersdoerferi | 0 | WBT/FBC? | 0 | 0 | 0 | 0 | C | 0 |
| Jeholornis sp. | LBT | FBC? | PBT | + | 3 in OCL | 0 | C | + |
| Kompsornis longicaudus | LBT | PBT | PBT? | + | 5 in MID-OCL | 0 | C? | + |
| Confuciusornis sanctus | LBT | FBC | LBT | + | 1 or more in OCL | 0 | C | + |
| Mirusavis parvus | LBT | FBC? | 0 | + | 0 | 0 | Near ICL | 0 |
| Mirarce eatoni | LBT | FBC | PBT | + | 4 in MID-OCL | 3 near ICL | C | 0 |
| Archaeorhynchus spathula | LBT | FBC? | LBT | 0 | 3 in MID-OCL | 0 | C | + |
| Patagopteryx deferrariisi | PBT/LBT? | FBC | PBT? | + | 1 in MID (LAG-ANN associated) | C | + | |
| Hollanda luceria | 0 | FBC? | PBT | 0 | 1 near PER (LAG-ANN associated) | C | 0 | |
| Iteravis huchzermeyeri | PBT | FBC? | 0 | + | 0 | 0 | D | 0 |
| Yanornis martini | LBT | FBC | 0 | + | 0 | 0 | D | + |
| Khinganornis hulunbuirensis | LBT | FBC? | – | + | 0 | 0 | D? | 0 |
| Gansus yumenensis | PBT/LBT? | FBC | 0 | + | 0 | 0 | D | 0 |
| Hesperornis regalis | LBT | FBC | LBT | 0 | 0 | 0 | C | + |
| Apteryx australis | PBT | FBC? | PBT | – | 1 or more in MID-OCL | 0 | D | + |
| Anas platyrhynchos | PBT | FBC | PBT/LBT? | – | 0 | 0 | D | + |
| Podiceps sp. | PBT | FCB | PBT | + | 0 | 0 | D | + |
Note
- 0, absent; +, present; –, uncertain; D, decrease from the endosteal surface to the periosteal surface of the total bone cortex; C, constant distribution throughout the total bone cortex.
2.2.3 Linear measurement methods for Gansus yumenensis
Measurements on the various samples of Gansus yumenensis were performed to complete with the osteohistological description, using the in-built tool and estimations functions of VGStudio Max 3.0 in mm with a two-decimal accuracy. All values were measured in a clockwise manner, going from the anterior axis to the lateral axis, then to the posterior axis, and finally to the medial axis (Figure S1a).
For each sample, we measured the length and width of the total bone sample and the medullary cavity with the “calliper” tool function (Figure S1b) on three virtual transverse sections that are perpendicular to the long axis of the bone sample (Figure 1c–g): at the two extremities and in the middle of the sample (slice 882). Due to the incompleteness and preservation of some samples, some measured values were affected, mainly in the tibiotarsus IVPP V21693 (Figures 8 and 9). Two length and width measurements for the total bone sample and the medullary cavity were made in transverse section for the three analysed slices and the samples in total. These values are presented in Table S2. We also measured the thickness of the total bone cortex, the ICL and the mid-cortex using the “calliper” tool function. The thickness was measured two times in four homologous quadrants (anterior, medial, posterior and lateral) on the three transverse sections of interest (Figure S1b). These values are presented in Table S3.
For each sample, we measured on the transverse sections the dimensions of all the osteonal canals using the “calliper” tool function (Figure S1c) while taking into account their orientation from qualitative identifications on both 2D virtual sections and the 3D-rendered model. For the oblique osteonal canals, we used the “polyline length” tool function as these canals exhibit more branching in transverse section. Mean values for each osteonal canal orientation type were estimated for each analysed slice. The values are presented in Table S3.
2.2.4 Stereometric data for Gansus yumenensis
From the osteohistological features selected for each sample, we used the in-built estimation function of VGStudio Max 3.0 to calculate the volume (mm3) and surface area (mm2) values for each selected feature with a three-decimal accuracy. Due to the intrinsic accuracy of the programme, many values were either too small for the programme to estimate accurately and therefore showed up with a zero value. As such, we present here the volume values for the complete sample (i.e. total sample, total bone cortex, medullary cavity, total vascular network) (Table S5). To simplify the volumetric comparisons, we calculated ratios (i.e. total bone cortex compared to the total bone sample, medullary cavity compared to the total bone sample; total vascular network compared to the total bone sample) in order to have a common denominator. These ratio values are presented in Table S5 and are plotted in bar plots (Figure 12a).
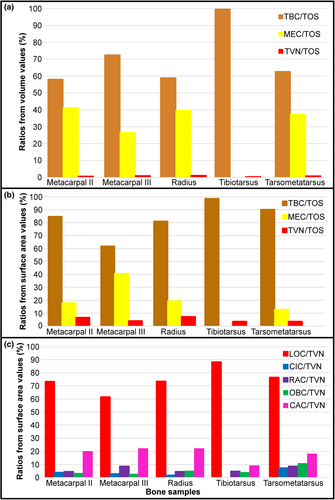
For the osteohistological features (i.e. bone cortex, medullary cavity, vascular network, canal orientations) of the regions of interest and the virtual transverse sections, we used surface area values, as the volume values were too low to estimate with VGStudio despite the three-decimal accuracy. As with the volume values, we calculate ratios (i.e. total bone cortex compared to the total bone sample, medullary cavity compared to the total bone sample; total vascular network compared to the total bone sample, canal orientations compared to the total vascular network) to simplify the comparisons with a common denominator. The surface area and estimated ratios values for the region of interest are presented in Table S6. The estimated ratio values were plotted in bar plots respectively (Figure 12b,c).
2.2.5 Comparisons with other birds
In order to provide new insight regarding the changes in osteohistology from long-tailed avialans to extant Neornithes, we compared the osteohistological features (e.g. bone tissue type, orientation and organisation of the vascular canals) from the transverse sections of the Gansus yumenensis samples (Figures 2b, 4b, 6b, 8b and 10b) with those of the other stem and crown birds presented in Material. These specimens exhibit a variety of bone adaptations, as well as various lifestyles to help refine the comparisons. The main osteohistological features of the compared specimens are summarised in Table 1 and detailed in Table S7.
From our comparisons, we perform a qualitative analysis of the relationships between Gansus yumenensis and the other birds of our study. From these comparisons, we looked at the evolution of osteohistological features, such as continuous and uninterrupted bone deposition, throughout the bird lineage (Figure 14).
Abbreviations: CDL, China Dinosaurland (Changzhou, China); DNHM and/or D, Dalian Natural History Museum (China); IMMNH, Inner Mongolia Museum of Natural History (Hohhot, China); Institutional abbreviations. AGB, Anhui Geological Museum, China; IVPP, Institute of Vertebrate Paleontology and Paleoanthropology (Chinese Academy of Sciences, Beijing); MACN, Sección Paleontología de Vertebrados, Museo Argentino de Ciencias Naturales (Buenos Aires, Argentina); MPC, Mongolian Paleontological Center, Ulaanbaatar; SGM, Hebei GEO University (Shijiazhuang City, China); SLS PSI, Swiss Light Source, Paul Scherrer Institute (Villigen, Switzerland); SNSB BSPG, Staatliche Naturwissenschaftliche Sammlungen Bayerns, Bayerische Staatssammlung für Paläontologie und Geologie (Munich, Germany); STM, Shandong Tianyu Museum of Nature (Pingyi, China); TIP UPJŠ, Technology and Innovation Park, University of Pavol Jozef Šafárik (Košice, Slovakia); UCMP, University of California Museum of Paleontology (Berkeley, USA). YPM, Yale Peabody Museum (New Haven, Connecticut, USA).
Osteohistological abbreviations. BTT, bone tissue type; CAC, canal connection; CCB, coarse cancellous bone; CIC, circumferential osteonal canal; DYO, dynamic osteogenesis; END, endosteal surface; EOC, osteonal canal opening on endosteal layer; ERR, erosional room; FBC, fibrolamellar bone complex; ICL, inner circumferential layer; LAG, line of arrested growth; LBT, lamellar bone tissue; LOC, longitudinal osteonal canals; MEB, medullary bone; MEC, medullary cavity; MID, mid-cortex; OBC, oblique osteonal canal; OCL, outer circumferential layer; OSC, osteonal canal; OSL, osteocyte lacuna; OST, osteon; PBT, non-lamellar parallel-fibred bone tissue; PER, periosteal surface; PFB, parallel-fibred bone; PGM, post-hatching growth marks; POC, osteonal canal opening on periosteal layer; PRC, primary canals; RAC, radial osteonal canal; RSL, resorption line; SEC, secondary canals; STO, static osteogenesis; TBC, total bone cortex; TVN, total vascular network; TTS, total transverse section cortex; VAN, vascular network; WBT, woven bone tissue; WPC, woven-parallel complex.
3 RESULTS
3.1 Osteohistological features of Gansus yumenensis
3.1.1 Bone cortex
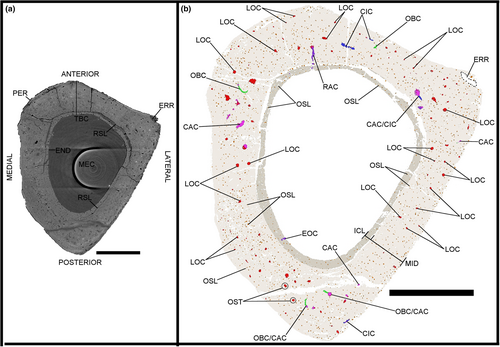
The outline shape of the cut out samples of Gansus yumenensis IVPP V21692 and V21693 varies considerably, as well as that of the medullary cavity (Table S1). Small openings formed from old canals link the medullary cavity to the outer surface, or erosional rooms, are present in four of the five samples (Table S1). The tibiotarsus is the exception, as the bone was crushed, the lateral quadrant is absent and the total bone cortex affected by its state of preservation (Figures 8 and 9; Table S1). In general, these erosional rooms are observed either exclusively towards the proximal extremity (e.g. metacarpal II and radius) or the distal extremity (e.g. metacarpal III) (Table S1). The tarsometatarsus exhibits a small oval-shaped erosional room (Figures 10b and 11c) that runs practically along the full length of the sample (Table S1), although it is sometimes eroded due to preservation.
When looking at the ratios of the medullary cavity and the total bone cortex compared to the total sample estimated from the measurements (Tables S2 and S3), the total bone cortex represents the majority of the sample. In the case of the volume values for the complete sample, the medullary cavity ranges from 27% to 41% compared to the 58 to 100% of the total bone cortex (Figure 12a; Table S4). In the case of the surface area values of the total region of interest, the medullary cavity ranges from 13% to 41% compared to the 62 to 99% of the total bone cortex (Figure 12b; Table S6). The remaining percentages for the volume and surface area ratios belong to the total vascular network (Figure 12a,b; Tables S5 and S6).
Two layers are observed at various degrees throughout the total bone cortex of the samples of Gansus yumenensis: an ICL and a mid-cortex (Figures 2a, 4a, 6a, 8a and 10a). Both layers are generally separated by a line of resorption, whose visibility varies from sample to sample (Table S1). In most cases, the line of resorption is accentuated by cracks in which the sediments found in the medullary cavity have also infiltrated (Figures 2a, 4a, 6a, 8a and 10a). No OCL is observed throughout the samples. However, along the outer margin of the total bone cortex in the radius and tarsometatarsus samples, some osteohistological features (i.e. vascular network, organisation of the osteocyte lacunae) seem to indicate the onset of this outermost bone layer. As such, this shows that both Gansus specimens had not reached full ontogenetic maturity at their time of death, as observed in other non-ornithurine Euornithes (O’Connor et al., 2015; Wang, Hao, et al., 2019; Wang, Cau, et al., 2020), and most likely were late subadults. The mid-cortex generally makes up around 2/3 of the total bone cortex (Tables S3, S5 and S6). The ICL observed in the various samples is generally avascular, yet some radial- and oblique-oriented canals (generally under 20 total per sample) traverse and open on the endosteal surface (Figures 2b, 3c,d, 4b, 5c,d, 6b, 7c,d, 8b, 9c,d, 10c and 11c,d).
In general, the total bone cortex is relatively thin in the samples, never exceeding 2.00 mm as observed in several extant birds exhibiting a similar lifestyle (e.g. mallards, grebes, terns; Table S7) (de Margerie et al., 2002; de Margerie, 2002; de Margerie et al., 2005; Habib & Ruff, 2008). The total bone cortex is thickest in the anterior quadrant (between 0.73 and 1.99 mm) and/or the posterior quadrant (and between 1.27 and 2.66 mm) throughout the samples (Table S3). Regarding the mediolateral axis, the thickness of the total bone cortex varies between 0.59 and 2.23 mm in the lateral quadrant, and between 0.54 and 1.72 mm in the medial quadrant (Table S3). The tibiotarsus is an exception due to its incomplete and distorted preservation (Figures 1f and 8). The ICL and mid-cortex exhibit the same trend (Table S3). When comparing the zeugopodium and autopodium elements between IVPP V21692 and V21693, we observe that there is a contrast in the thickness of the sampled midshafts. The total bone cortex of the radius (between 1.34 and 1.59 mm) is thicker than that of the tibiotarsus (between 1.27 and 1.60 mm; Table S3). The opposite is observed for the autopodial elements. For the metacarpals, the thickness varies between 1.29 and 1.34 mm for the second metacarpal and between 0.84 and 0.90 mm for the third metacarpal (Table S3). In the case of the tarsometatarsus, the thickness varies between 2.00 and 2.04 mm (Table S3).
Throughout the total bone cortex of the samples, no post-hatching growth marks are observed, may they be LAGs or annuli (Figures 2, 4, 6, 8 and 10). However, this could be due to the fact that the specimens IVPP V21692 and V21693 are immature, having not reached full ontogenetic maturity at their time of death despite exhibiting a potential onset of an OCL in the radius and tarsometatarsus sample (Figures 6 and 10; Table S1).
3.1.2 Vascular network
The total vascular network, although appearing abundant in the samples (Figures 2-11), represents a small part of the total sample of each bone (Figure 12a,b; Tables S5 and S6). However, in the case of the samples of IVPP V21693, the conservation of the total vascular network was affected by the preservation of the bone, either partially in some quadrants (e.g. tarsometatarsus on medial–posterior limit and middle of the lateral quadrant) (Figures 10 and 11) or almost completely (tibiotarsus) (Figures 8 and 9). Because of this, despite the resolution of the scans, the canals were very hardly visible or altogether absent (Table S6). The canals are mainly observed within the mid-cortex (Figures 2b, 3c,d, 4b, 5c,d, 6b, 7c,d, 8b, 9c,d, 10b and 11c,d), with some that open on the inner surface (generally under 20 in total) and the outer surface (generally under 10 in total). Regarding the surface area ratios (Table S6), the total vascular network varies between 4% and 7% in the region of interest.
The main orientation of the vascular network in the bone cortex of the samples of Gansus yumenensis IVPP V21692 and V21963 is longitudinal (Figures 2-11; Tables S1 and S4). The dimensions (i.e. length and width) of these longitudinal canals in transverse sections vary considerably, from 0.02 × 0.02 mm to 0.30 × 0.10 mm (Table S4). The highest number of canals, as well as the largest ones, are observed and measured in the tarsometatarsus (Table S4). Longitudinal canals, the length of which exceeds 20 mm in cross section, are few in number. Regarding the ratios based on the surface area values of the longitudinal canals compared to the total vascular network in the region of interest, the highest ratio value estimated with certainty is found in the tarsometatarsus, for a value of 77% (Figure 12c; Table S6). The tibiotarsus is an exception, with an estimated ratio value of 88%. However, this value is affected by the preservation of the bone as well as the number of canals measured with certainty (Figure 12c; Table S6).
Regarding the canal connections and other non-longitudinal canals, the most abundant connections throughout the samples have oblique-oriented, followed by circumferential-oriented canals (Tables S1 and S4). Radial canals are generally few in number, never exceeding more than eight throughout the analysed slices, and generally serve as connections between the total vascular network and the medullary cavity (Tables S1 and S4). When we look at the surface area values (Table S6), we observe that the oblique canals have the highest values throughout the total bone cortex (between 0.585 and 1.605 mm2), while the circumferential canals exhibit the lowest values (between 0.112 and 1.096 mm2). The ratio values for the non-longitudinal canals compared to the total vascular network follow the same trend (Table S6). When we look at the distribution of the canal connections and other non-longitudinal canals in the regions of interest (Figure 12c), clear differences between the fore- and hindlimbs are observed. In the metacarpals, radial canals exhibit the highest ratio value compared to the total vascular network. This trend is not observed in the tarsometatarsus, where oblique-oriented canals exhibit the highest ratio value. Overall, we observe higher values for the estimated ratios of the vascular canals in the tarsometatarsus than in the metacarpals. The ratio values of the tarsometatarsus exhibit a similar distribution to what is observed for the radius (Figure 12c). Even if little to no circumferential canals are observed in the tibiotarsus (Figures 8 and 9; Table S4), the distribution of the ratio values for the non-longitudinal canals compared to the total vascular network is more reminiscent of the distribution observed for the canals of the second metacarpal than that of the third metacarpal (Figure 12c).
The highest surface values of canal connections are observed in the bones of the forelimb samples of IVPP V21692 compared to those in the hindlimb samples of IVPP V21693 (Figure 12c; Table S6). The radius sample exhibits the highest values for both the surface area and the ratio of the canal connections compared to the total vascular network, with 4.650 mm2 for a ratio of 22% (Figure 12c; Table S6). The lowest values are found in the tibiotarsus (Table S6). However, these values can be explained by the effects of preservation on both the bone and the total vascular network. As the total vascular network is mainly located within the mid-cortex of the bone samples, there are little to no canal connections observed within or bordering the ICL (Figures 3c,d, 5c,d, 7c,d, 9c,d and 11c,d; Table S6).
3.1.3 Osteocyte lacunae
Regarding the osteocyte lacunae throughout the samples of Gansus yumenensis IVPP V21692 and V21693, more similarities than differences are observed (Table S1). The lacunae in the ICL are in general circular to ovoid in transverse section (Figures 2b, 4b, 6b, 8b and 10b). In the 3D-rendered models (Figures 3e, 5e, 7e, 9e and 11e), their overall shapes are elongated oval along the proximodistal axis. The osteocyte lacunae in the ICL exhibit a parallel organisation to the circumference of the total bone cortex, with highly variable distance between each lacuna (Figures 2b, 3e, 4b, 5e, 6b, 7e, 8b, 9e, 10b and 11e).
In the mid-cortex, the shapes of the osteocyte lacunae are generally more circular than ovoid in transverse section compared to the ICL (Figures 2b, 4b, 6b, 8b and 10b). The main shape of the lacunae in 3D is also elongated oval along the proximodistal axis, with some small globular lacunae (Figures 3e, 5e, 7e, 9e and 11e). In some bone samples, some of the lacunae are more elongated along the proximodistal axis than others, as well as more flattened along the inner to the outer margin of the total bone cortex. In the metacarpals, some of the osteocyte lacunae in the mid-cortex are elongated along the circumference of the bone in transverse section (Figures 3e and 5e), an orientation which is rarely or not observed in the other samples. Compared to the ICL, the lacunae of the mid-cortex exhibit two types of organisation. The first is generally parallel organisation along the circumference of the total bone cortex, as observed in the ICL. However, the distribution of the lacunae becomes more random when they surround the canals. For some of the longitudinal canals, they form a circle that is centred on the canal itself, a clear indication of an osteon (Figures 2b, 4b, 6b, 8b and 10b). Although no OCL is formed throughout the analysed samples of Gansus yumenensis, we observe along the periosteal surface of the radius and tarsometatarsus samples that the osteocyte lacunae start to exhibit a less random organisation than what is observed throughout the mid-cortex (Figures 6 and 10). As such, it could suggest the onset of an OCL. If so, this would indicate that the two Gansus specimens had not reached full somatic maturity, but were in the late subadult stage at their time of death.
Regarding their general distribution throughout the mid-cortex, the osteocyte lacunae exhibit a more or less even distribution through the total bone cortex, with little to no decrease in density from the inner to the outer margin (Figures 3e, 5e, 7e, 9e and 11e). The tibiotarsus is an exception (Figure 9e), but the apparent decrease can be explained by the state of preservation of the sampled midshaft (Figures 8 and 9).
3.1.4 Bone tissue type
From our analysis of the osteohistological features (Table 1; Table S1), we determine the bone tissue type in the ICL and mid-cortex layers of the samples of Gansus yumenensis based on the nomenclature and determination methods established in previous studies, using the formation principles of the total bone cortex to determine the bone tissue type (Marotti, 2010; Prondvai et al., 2014; Stein & Prondvai, 2014). We cannot use the birefringence of collagen fibres and apatite crystallites as typically done in other studies that use ground sections and polarised light microscopy (Prondvai et al., 2014).
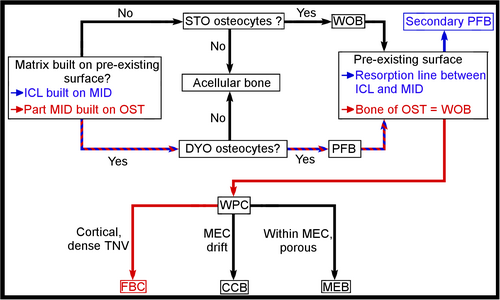
Throughout the samples, the ICL is built on the mid-cortex, which served as a pre-existing firm surface (Figure 13). This layer is also characterised by little to no observed vascular canals. The osteocyte lacunae of the nearly avascular ICL exhibit a parallel organisation along the circumference of the samples, as well as uniform orientation along the long axis of the samples (Figures 3e, 5e, 7e, 9e and 11e). This organisation is indicative of dynamic osteogenesis (sensu Marotti, 2010; Prondvai et al., 2014; Stein & Prondvai, 2014) (Figure 13). From these elements, we can define the bone tissue type of the ICL as most likely being non-lamellar parallel-fibred, exhibiting some slight erosion due to medullary resorption (Figures 2-11). However, we cannot overlook the possibility that the ICL may exhibit lamellar bone tissue, a specific form of parallel-fibred bone tissue (Prondvai et al., 2014; Stein & Prondvai, 2014), which would require further description of the collagen fibres and the orientation of the lamellae through other means than synchrotron analysis and virtual models (i.e. physical cross sections, see Notes on synchrotron analysis).
For the mid-cortex, similar observations can be made as in the ICL, yet associated with other characteristics that indicate a different bone tissue type. Part of the matrix is built on a pre-existing surface surrounding the osteons (Figure 13). The osteocyte lacunae surrounding the osteonal canals exhibit a mainly parallel organisation along the circumference of the total bone cortex, with a uniform orientation along the long axis of the samples (Figures 3e, 5e, 7e, 9e and 11e), both characteristic of dynamic osteogenesis (Marotti, 2010; Prondvai et al., 2014; Stein & Prondvai, 2014) (Figure 13). Therefore, part of the bone tissue in the mid-cortex is parallel-fibred. In between the osteonal canals, the organisation of the osteocyte lacunae becomes more random both along the circumference and the long axis of the samples (Figures 2b, 3e, 4b, 5e, 6b, 7e, 8b, 9e, 10b and 11e), indicative of static osteogenesis and therefore of woven bone tissue (sensu Marotti, 2010; Prondvai et al., 2014; Stein & Prondvai, 2014) (Figure 13). The presence of the two types of bone tissue in the mid-cortex form a woven-parallel complex associated with a dense total vascular network of primary osteons, which can therefore be characterised as a fibrolamellar complex (sensu Prondvai et al., 2014) (Figure 13). The slow decrease in osteocyte lacunae density towards the outer surface of the bone cortex, more explicit in the radius and tarsometatarsus samples, could be indicative of a decrease in bone deposition prior to ontogenetic maturity, and the onset of the formation of an OCL as observed in other non-ornithurine euornithians (O’Connor et al., 2015; Wang, Hao, et al., 2019).
3.2 Comparisons of the osteohistological features in Gansus yumenensis and other birds
3.2.1 Bone tissue type
When comparing the bone tissue type of the extinct and extant specimens used in this study, several similarities are observed in Gansus yumenensis with the crownward bird species (Wilson & Chin, 2014; Brusatte et al., 2015; O’Connor et al., 2015; Bailleul et al., 2019; Wang, Hao, et al., 2019; Wang, Cau, et al., 2020), as well as with the stem birds found as of the basal pygostylians (de Ricqlès et al., 2003; Chinsamy, Marugán-Lobón, et al., 2020), potentially the Jeholornithiformes (O’Connor et al., 2014; Wang, Huang, et al., 2020). The bone tissue type observed in the mid-cortex of the crownward bird species as well as the Enantiornithes is a fibrolamellar complex, which is surrounded by a nearly to completely avascular and generally thin ICL and OCL (when present) of non-lamellar parallel-fibred or lamellar bone tissue (Figure 14; Table 1; Table S7). These various bone tissue types are characterised by the shape (e.g. globular, ovoid, long oval along the proximal-distal axis) and orientation (e.g. parallel organisation in parallel-fibred bone, random organisation in woven bone) of the osteocyte lacunae, as well as the density of the total vascular network (i.e. nearly avascular in parallel-fibred/lamellar bone tissue, dense neurovascular network in woven bone tissue/fibrolamellar complex) and the long-range fibre orientation (Table 1; Figures 13 and 14c; Table S7) (Prondvai et al., 2014).
Only a few comparative specimens are questionable on the bone tissue type, such as Archaeopteryx lithographica BSPG 1999 I 50 (Erickson et al., 2009), Archaeopteryx albersdoerferi SNSB BSPG VN-2010/1 (Kundrát et al., 2019) and Archaeorhynchus spathula IVPP V20312 (Wang & Zhou, 2017). In the case of the stem long-tailed avialan, either the conclusions made from the analysis are questionable due to the sample used (i.e. minute fragments for Archaeopteryx lithographica BSPG 1999 I 50), or no true conclusions can be made because of the ontogenetic stage of the studied specimen (i.e. juvenile, so unclear if we are observing only woven bone in transverse section or the onset of a fibrolamellar complex). In several specimens, such as the long-tailed avialan Jeholornis sp. STM 2–51 (O’Connor et al., 2014), the enantiornithines Mirusavis parvus IVPP V18692 (Wang, Hao, et al., 2019) and Mirarce eatoni UCMP 139500 (Atterholt et al., 2021), and the non-ornithurine euornithians Archaeorhynchus spathula IVPP V20312 (Wang & Zhou, 2017) and Hollanda luceria MPC-b100/205 (Bell et al., 2010), the mid-cortex exhibits a mixture of both parallel-fibred and woven bone tissue (Table 1; Table S7), forming a structure reminiscent of a woven-parallel complex (Figure 13) (Prondvai et al., 2014). As this structure is located only in the mid-cortex (not within or drifting from the medullary cavity), yet no true dense vascular network is observed in the cross sections of the samples (Figure 13), we suggest that these species potentially exhibited the onset or a form of a fibrolamellar bone complex prior to the Neornithes, which is characterised by a generally dense and well-vascularised fibrolamellar bone complex in the mid-cortex (Table 1; Table S7).
The changes in bone tissue types in the various extinct and extant specimens of this study could be indicative of a mosaic pattern in the evolution of the bird lineage (Figure 14; Table 1; Table S7). This mosaic pattern is most likely associated with the body size and the ontogenetic stage (generally woven bone tissue in juvenile, parallel-fibred to fibrolamellar bone tissue in subadults and adults) (Figure 14; Table 1; Table S7), as well as physiological (i.e. metabolic activity) and biomechanical adaptations (i.e. muscle insertions in relation to locomotion, overall organisation of the neurovascular network in the bone to relieve stress on the bone). All of these factors are associated with increased flight capabilities from the stem long-tailed avialans to the basal pygostylians before reaching more active flapping flight reminiscent of extant Neornithes as of the extinct Ornithothoraces (Figure 14c) (Tobalske, 2016; Kundrát et al., 2019; Schwarz et al., 2019; Monfroy & Kundrát, 2021), as well as lifestyles of these extinct stem birds (i.e. terrestrial, aerial and/or aquatic) (Habib & Ruff, 2008; Lee & Simons, 2015; McGuire et al., 2020).
3.2.2 Post-hatching growth marks
No post-hatching growth marks are observed throughout the total bone cortex of the samples of Gansus yumenensis. As such, this species is the fourth recorded non-ornithurine euornithian to exhibit uninterrupted bone deposition (Figure 14), along with Iteravis huchzermeyeri (O’Connor et al., 2015), Yanornis martini (Wang, Hao, et al., 2019) and Khinganornis hulunbuirensis (Wang, Cau, et al., 2020). Uninterrupted bone deposition pattern is also observed in almost all extant Neornithes (Figure 14). Some exceptions are observed, such as LAGs in the long bones of the kiwi and moa of New Zealand (Bourdon et al., 2009; Legendre et al., 2014), the recently extinct elephant bird of Madagascar (Hansford & Turvey, 2018; Chinsamy, Angst, et al., 2020), the recently extinct dodo (Angst et al., 2017) and the psittacid Amazona amazonica (de Ricqlès et al., 2001). Uninterrupted growth is also observed in the extinct ornithurines such as Hesperornis regalis (Chinsamy et al., 1998; Wilson & Chin, 2014) and Ichthyornis dispar (Chinsamy et al., 1998) (Figure 14). Post-hatching growth marks (LAGs, annuli or a combination of both) are observed in non-avian dinosaurs such as troodontids (Weishampel et al., 2004; Gao et al., 2012; Shen et al., 2017), as well as in most extinct bird specimens (Figure 14; Table 1; Table S7) such as Jeholornithiformes (O’Connor et al., 2014; Wang, Huang, et al., 2020), basal pygostylians (Chinsamy, Marugán-Lobón, et al., 2020) and Enantiornithes (O’Connor et al., 2014; Wang et al., 2017; Atterholt et al., 2018; Wang, Hao, et al., 2019; Wang, O’Connor, et al., 2019). They are also observed in some non-ornithurine euornithians, such as Archaeorhynchus spathula (Wang & Zhou, 2017), Hollanda luceria (Bell et al., 2010) and Patagopteryx deferrariisi (Chiappe, 2002) (Figure 14).
In the case of the long-tailed avialan Archaeopteryx, may it be A. lithographica BSPG 1999 I 50 (Erickson et al., 2009) and A. albersdoerferi SNSB BSPG VN-2010/1 (Kundrát et al., 2019), no post-hatching growth marks are observed. In the case of A. lithographica BSPG 1999 I 50, the absence of post-natal growth marks is highly questionable, as the analysed samples were minute fragments and therefore are not fully reliable. In the case of A. albersdoerferi SNSB BSPG VN-2010/1, the absence of post-natal growth marks is most likely as the specimen died in its early ontogenetic stage (Kundrát et al., 2019) (Figure 14c; Table S7). Growth marks are observed in the Jeholornithiformes, mainly from the outer margin of the mid-cortex to the OCL (Figure 14c; Table S7). Their high concentrations and distribution (i.e. little space between each line) are reminiscent of an external fundamental system (EFS) (Ponton et al., 2004), which is also observed in the adult samples of Confuciusornis sanctus (Figure 14c; Table 1; Table S7). In the case of the Enantiornithes, post-natal growth marks are also observed, mainly from the outer half of the mid-cortex to the OCL (when present) (Figure 14; Table 1; Table S7). However, compared to the long-tailed avialans and the basal pygostylians, the number of LAGs and/or annuli observed decreases, in many case never exceeding three–four. The spatial distribution between these post-natal growth marks is also greater, so no EFS is observed (Figure 14c; Table 1; Table S7).
From our analyses of the samples of Gansus yumenensis V21692 and V21693, we provide further evidence for the widespread presence of uninterrupted bone deposition in non-ornithurine euornithians during the Early Cretaceous (Figure 14), as well as a progressive loss of post-natal growth marks from the long-tailed avialans to the Euornithes.
4 DISCUSSION
4.1 Notes on synchrotron analysis
The use of synchrotron microtomography-based 3D models offers numerous advantages regarding the analysis of the microstructure and osteohistological features of long bones of extinct organisms, yet there are still drawbacks in using this method.
Synchrotron microtomography allows for a much less destructive analyses of the samples compared to the usual physical sections, using either a fresh break or cut out sample that can be set back with the original bone without further destruction compared to 2D physical sections set in epoxy or polyester (Wang, Hao, et al., 2019; Heck et al., 2020; Williams et al., 2021). The image stacks obtained from such analysis allow for the creation of virtual sections (Figures 2, 4, 6, 8 and 10) as well as 3D reconstructions of the anatomical and osteohistological features of bones (Figures 3, 5, 7, 9 and 11) that are continuous compared to physical sections (100-micron thick ground sections) in which gaps exists between the obtained slices due to the preparation processes (Heck et al., 2020). The analysis of 3D reconstructions alongside the virtual sections offer volume depths and more accurate quantification of the analysed osteohistological features, as shown in previous studies (Pratt & Cooper, 2018; Pratt et al., 2018; Williams et al., 2021). The combinations of both models, along with the development-based classification (Prondvai et al., 2014), allows for a different characterisation of diagnostic features that aid in the determination of the bone tissue type in the layers of the total bone cortex, the orientation and organisation of the total vascular network, and the orientation and organisation of the osteocyte lacunae. In addition, the analysis of 3D-rendered models allows us to estimate more accurate surface area and volume values of the osteohistological features.
However, some osteohistological features are not observable with synchrotron microtomography scans. The analysis of the birefringence of apatite crystallites and collagen fibres (when they have not decayed) with cross-polarised light microscopy is typically used in the determination of bone tissue types (Prondvai et al., 2014). Currently, attempts are being made to reach the requirements for crystallite imaging using synchrotron microtomography (pers. com. M.K.). Consequently, in order to refine the diagnostics of osteohistological features from long bone samples of extinct specimens, we recommend the use of physical and virtual sections along with 3D-rendered models to complete one another, as done for Yanornis martini (Wang, Hao, et al., 2019) and Archaeopteryx albersdoerferi (Kundrát et al., 2019) in previous studies.
4.2 Osteohistological variability in Gansus yumenensis
4.2.1 Notes on the osteohistological features
In the radius and tarsometatarsus samples of Gansus yumenensis, the high values for the total bone cortex to total sample ratio along with the total vascular network to total sample ratio could indicate adaptations to mechanical stresses during locomotion (Figure 12s; Table S3). The organisation and distribution of the vascular network in the radius are probably associated with mechanical stresses related to flight, while in the tarsometatarsus it could be associated with mechanical stresses related to swimming and foot-propelled diving (Ji et al., 2006; You et al., 2006; Habib & Ruff, 2008). Differences in the total vascular network along the anteroposterior axis are observed between the various samples of Gansus yumenensis, offering further evidence for adaptations to mechanical stresses related to locomotion (aerial, terrestrial and aquatic).
Similar observations are made in the long bones of extant semi-aquatic birds with similar lifestyles to that of Gansus yumenensis, such as mallards (de Margerie et al., 2002; de Margerie, 2002; de Margerie et al., 2005) and grebes (de Margerie et al., 2005) (Table 1; Table S7). Both are characterised as bimodal species with drag-based hindlimb diving as well as flight for locomotion (Habib & Ruff, 2008). Most of the fossil species are compressed during preservation along the mediolateral or anteroposterior axis, rendering comparisons difficult to make. The organisation of the total vascular network appears to be more or less uniformly distributed within the samples of the Ornithurae specimens, specifically within Hesperornis regalis YPM 1491 (Wilson & Chin, 2014) and the mallard Anas platyrhynchos (de Margerie, 2002; de Margerie et al., 2005). This type of vascular distribution in the bones of the hindlimbs can be considered as an adaptation to swimming and foot-propelled diving (Habib & Ruff, 2008; Habib, 2010), although no comparative quantitative correlations between the density and distribution of the canals in long bones with locomotion types have been made to date.
Further analyses of midshaft samples from long bones of extant birds and other flying amniotes are required to further elaborate and define adaptations to mechanical stresses, as done in previous studies (Lee & Simons, 2015; McGuire et al., 2020), specifically with the use of in-depth observations and volume analyses of 3D-rendered models from which we could try to divine the evolution of these locomotor adaptations in the extinct bird lineages, as well as better understand the flight capability of the various bird species (i.e. more adapted for gliding or true flapping flight).
4.2.2 Notes on the vascular network
The predominant canal orientation in Gansus yumenensis is longitudinal, associated with different quantities and densities of the non-longitudinal canals exhibiting various orientation varying from sample to sample (Figure 12c; Table S6). The high canal connections to total vascular network ratio values, associated with the relatively thin total bone cortex, support the hypothesis of high metabolic needs for fast growing bone tissue, as observed in extant birds (Montes et al., 2007; Montes et al., 2010; Werner & Griebeler, 2014; Legendre et al., 2016; Monfroy & Kundrát, 2021).
We also observe in the samples of Gansus yumenensis that the total vascular network exhibits a noticeable decrease from the inner to the outer margin of the total bone cortex (Figures 2-11), an osteohistological feature, which is also observed in other non-ornithurine euornithians (O’Connor et al., 2015; Wang, Hao, et al., 2019; Monfroy & Kundrát, 2021) (Figure 14c; Table 1; Figure S2; Tables S1 and S7). In the case of the extinct and extant Ornithurae, a slight decrease in density from the endosteal surface to the periosteal surface can be observed whether an OCL is present or not, yet the total vascular network is generally more uniformly distributed throughout the total bone cortex compared to the non-ornithurine euornithians (Figure 14c; Table 1; Tables S1 and S7).
The decrease in the density of the total vascular network towards the periosteal surface of the bone cortex suggests a decrease in growth rate in Gansus yumenensis, as observed in other non-ornithurine Euornithes (Figure 14c). However, our comparisons with the other bird specimens must be considered carefully, as some of description made previously could have most likely been affected by the state of preservation of the specimens, as well as the ground preparation of the transverse sections. In the case of our virtual analysis of the samples of Gansus yumenensis IVPP V21692 and V21693, the synchrotron 2D transverse sections are closer to true 2D slice of the bone cortex compared to the 100-micron-thick ground physical sections which can change the appearance of the analysed features.
Further 3D analysis of bone samples from various extant and extinct specimens with virtual models would be required so as to see whether qualitative and quantitative correlations can be established between osteohistological features (e.g. density and orientation factors of the total vascular network) and physiological/biomechanical adaptations (e.g. cortical drift associated with periosteal resorption, biomechanical constraints with muscle attachments, preferential directions of stress and strain) (Enlow, 1962a; Enlow, 1962b; Enlow, 1963; Maggiano et al., 2015). These quantitative correlations could also provide insight regarding biomechanical questions such with the development of powered flapping flight amongst early birds.
4.2.3 Notes on the ontogenetic stage
Throughout the samples of Gansus yumenensis IVPP V21692/V21693, no distinct OCL is observed throughout the total bone cortex. However, the decrease of the vascular network and the change in the organisation of the osteocyte lacunae towards the outer margin of the mid-cortex suggest the onset of an OCL (Chinsamy et al., 1995; Ponton et al., 2004), specifically in the radius and tarsometatarsus samples (Figures 6, 7, 10 and 11; Table S1). Based on these observations, we do not necessarily expect the deposition of future growth marks, in a similar fashion to extant birds. Associated with the presence of a relatively thin ICL along the inner margin of the total bone cortex (Figures 2-11), this indicates that Gansus yumenensis was closed to ontogenetic maturity, and most likely was a late subadult when it died.
This is further supported by other osteohistological analyses performed on other non-ornithurine Euornithes closely related to Gansus yumenensis (Figure 14a,b), such as Iteravis huchzermeyeri (O’Connor et al., 2015), Yanornis martini (Wang, Hao, et al., 2019) and Khinganornis hulunbuirensis (Wang, Cau, et al., 2020). These specimens do not exhibit an OCL, as observed in specimens of Ornithurae (Figure 14c; Table 1), which likely suggests ontogenetic immaturity (Chinsamy et al., 1995; Ponton et al., 2004; O’Connor et al., 2015). No LAGs are observed in these species, and the descriptive analyses suggest that the deposition of future growth marks is not expected, contrary to other non-ornithurine Euornithes from the Cretaceous such as Patagopteryx deferrariisi (Chiappe, 2002; Starck & Chinsamy, 2002), Archaeorhynchus spathula (Zhou et al., 2013) and Hollanda luceria (Bell et al., 2010) (Figure 14c).
Further sampling for osteohistological analyses and comparisons would be required to complete our knowledge and categorise the ontogenetic stages in extinct euornithians.
4.3 Origin of uninterrupted bone deposition
Recent phylogenetic analyses place Gansus yumenensis near the bird crown group (Cau, 2018; Zheng et al., 2018; Wang, Cau, et al., 2020), and more specifically Ichthyornis (Figure 14a-b). This species is more derived than the other three non-ornithurine euornithians exhibiting uninterrupted bone deposition, with Yanornis martini at the base of the group followed by Khinganornis hulunbuirensis and Iteravis huchzermeyeri (Figure 14a-b). Based on our observations of Gansus yumenensis (Table 1; Table S1), the osteohistology of the compared specimens of this study (Table 1; Table S7) and the most recent and accepted bird phylogenies (Figure 14a), we suggest that uninterrupted bone growth typically found in the bird crown group most likely had multiple origins within the non-ornithurine euornithians of the Early Cretaceous (Figure 14a). This statement was suggested in previous studies (Bailleul et al., 2019; Wang, Hao, et al., 2019; Wang, Cau, et al., 2020; Monfroy & Kundrát, 2021). However, there is a small chance that the absence of post-natal growth marks in the studied specimens of Gansus yumenensis could be due to that fact that they had not reached full somatic maturity at their time of death, as observed in other non-ornithurine Euornithes exhibiting uninterrupted bone growth (O’Connor et al., 2015; Wang, Hao, et al., 2019; Wang, Cau, et al., 2020).
The conclusion of multiple origins for uninterrupted bone growth amongst the non-ornithurine Euornithes is mainly due to the phylogenetic position of two fossil euornithians from the Late Cretaceous: Vorona berivotrensis and Patagopteryx deferrariisi (Chiappe, 2002; Starck & Chinsamy, 2002). Both specimens exhibit a fibrolamellar complex in the mid-cortex, alongside an ICL with lamellar bone and an OCL of either non-lamellar parallel-fibred (Vorona) or lamellar (Patagopteryx) bone. Yet, the key osteohistological feature observed in these non-ornithurine euornithians is the presence of LAGs, sometimes associated with an annulus (Starck & Chinsamy, 2002). In the case of flightless Patagopteryx deferrariisi (Chiappe, 2002), presence of post-natal growth marks and secondary reversal to interrupted bone growth throughout the total bone cortex could be autapomorphies, most likely associated with the loss of flight capabilities and adaptations to their environment (i.e. response to the absence of major predators, changes in temperature and environment), as observed in extant insular palaeognaths (Bourdon et al., 2009; Legendre et al., 2014; Bailleul et al., 2019; Chinsamy, Angst, et al., 2020). Vorona berivotrensis and Patagopteryx deferrariisi are placed as the most derived non-ornithurine Euornithes in the most recently accepted phylogenetic analyses (Cau, 2018; Zheng et al., 2018; Wang, Cau, et al., 2020; Monfroy & Kundrát, 2021), close to Ichthyornis dispar and the bird crown group (Figure 14a). As these species exhibit interrupted bone deposition along with Archaeorhynchus spathula (Wang & Zhou, 2017) and Hollanda luceria (Bell et al., 2010), this provides arguments for multiple origins of this feature (Figure 14a) (Monfroy & Kundrát, 2021). However, other widely accepted phylogenies place both Vorona berivotrensis and Patagopteryx deferrariisi near the base of the Euornithes (Figure 14b) (Zheng et al., 2017; Wang et al., 2018; Wang, Huang, et al., 2018). As such, these analyses would argue for a single origin of uninterrupted bone deposition amongst the non-ornithurine Euornithes, most likely at the last common ancestor of Yanornis martini, Gansus yumenensis and the Ornithurae (Figure 14b).
Also, in both phylogenies (Figure 14a,b), the Chinese species Archaeorhynchus spathula from the Early Cretaceous (Zhou et al., 2013) and Hollanda luceria from the Late Cretaceous (Bell et al., 2010) are placed towards the beginning of the Euornithes branch, prior to the known non-ornithurine euornithians exhibiting uninterrupted bone growth. As these two species exhibiting interrupted bone growth are geologically younger than Gansus yumenensis, there is a high chance that the common ancestor of theses euornithians exhibited interrupted bone growth as observed in the other Ornithothoraces of this study. As such, uninterrupted bone deposition is potentially not a common feature of all the Euornithes (Figure 14c), appearing within specific non-ornithurine euornithians groups and suggesting a later development and evolution of this osteohistological feature (Monfroy & Kundrát, 2021).

Despite a large diversity of non-ornithurine euornithians, few osteohistological analyses have been performed due to limited availability for sampling as well as their preservation state (Chiappe, 2002; Starck & Chinsamy, 2002; Bell et al., 2010; O’Connor et al., 2015; Wang & Zhou, 2017; Wang, Hao, et al., 2019; Wang, Cau, et al., 2020; Monfroy & Kundrát, 2021). In order to better understand and determine the distribution of continuous and uninterrupted bone deposition within the non-ornithurine Euornithes and explore the evolutionary trends, further sampling and in-depth analysis of multiple samples from fore- and hindlimb bones of extinct birds are required to determine inter- and intraspecific similarities and differences, as well as create a well-supported phylogeny.
4.4 Stereometric analyses in the samples of Gansus yumenensis
The analysis of 3D data of Gansus yumenensis offered us a relatively accurate mean to estimate volume (complete bone sample) and surface area values (significant number of slices), as well as plot ratios for the analysed anatomical and osteohistological features, mainly for the total vascular network and the total bone cortex (Figure 12). The differences in the quantity and density of the various canal orientations between the samples from the forelimbs compared to those of the hindlimbs are potential indicators of adaptations the midshaft of long bones underwent in response to physiological requirements and external factors, such as various mechanical stresses during locomotion, as observed and suggested in extant birds (Pratt & Cooper, 2018; McGuire et al., 2020). The use of 3D data on a significant number of slices can better aid with the identification of osteohistological features by overcoming the lack of physical depth in traditional physical sections. Also, when used on a significant number of slices (50 or more), it can aid in estimating accurate surface area and volume values for the studied osteohistological features for a given bone sample.
However, the 2D and 3D data for the samples of Gansus yumenensis are dependent of the state of preservation of the samples, as well as the ontogenetic stage of the specimens. The determination of osteohistological features, such as the complexity of the vascular canal, is ambiguous and may be described differently in transverse or longitudinal sections compared to 3D-rendered models. This can lead to errors in interpretation and determination regarding osteohistological features, mainly in 2D but also in 3D. For instance, depending on the sampling location and size, the amount (in number and surface area) of analysed features can vary considerably (e.g. absence of circumferential canals in the tibiotarsus of Gansus yumenensis) (Figure 12c). Moreover, the intrinsic measurement error in VGStudio can cause confusion when it comes to the analysis of 2D data (with even lower actual values), since certain 3D features cannot be observed. As such, a more in-depth analysis of anatomical and osteohistological features using 3D sections of bone samples, as done for Gansus yumenensis IVPP V21692 and V21693 (Figures 3, 5, 7, 9 and 11), is required in order to perform more accurate metric analyses using surface area and volume values.
5 CONCLUSIONS
Virtual data (transverse sections, 3D-rendered models) offer a less destructive, more physical in-depth and volume analysis of the studied anatomical and osteohistological features compared to those performed with traditional physical sections. However, a more accurate description of said features can be achieved by using both physical and virtual analyses, as some characteristics of the bones (e.g. birefringence of apatite crystallites and/or collagen fibres) cannot be determined by using only a form of X-ray scan. Therefore, the combination of both analyses, which was unfortunately not possible here, would be recommended, as done in previous studies.
This study also represents the first osteohistological description of Gansus yumenensis, which is solely based on virtual transverse sections and 3D-rendered models obtained from synchrotron microtomography scans. Our observations of the osteohistological features show that Gansus yumenensis exhibits continuous and uninterrupted bone deposition with mainly a fibrolamellar bone complex associated with a relatively dense total vascular network outside of the crown group, making it the fourth recorded non-ornithurine euornithian to exhibit this osteohistological feature typical of the bird crown group. Differences in the thickness of the total bone cortex and the complexity of the total vascular network in the bone quadrants are observed between the zeugopodium and autopodium elements of the fore- and hindlimb samples of Gansus yumenensis. These differences are potentially due to the main physiological requirements and mechanical stresses associated with locomotion, either for active flight (zeugopodium elements of the forelimbs) or swimming (autopodium elements of the hindlimbs) in the case of this species. The total vascular network decreases from the inner to the outer margin of the total bone cortex, potentially associated with reaching somatic maturity prior to the formation of an OCL. Another possibility would be associated with the increase in locomotor abilities (mainly flight) from stem birds to Neornithes, as well as adaptations against mechanical stresses affecting limb bones and the physiological requirements for this type of locomotion.
Our analysis offers further evidence regarding the evolution of uninterrupted and continuous bone deposition, a feature observed as of non-ornithurine euornithians and in most extant Neornithes with few exceptions. We suggest that this osteohistological feature had most likely multiple origins amongst the non-ornithurine Euornithes during the Early Cretaceous. Further in-depth analyses of the osteohistological features in known non-ornithurine euornithians would be required to perform more accurate phylogenetic analyses. The PaleoBioImaging Lab is currently undertaking these investigations on extinct bird taxa.
ACKNOWLEDGEMENTS
We acknowledge the Paul Scherrer Institute (Villigen, Switzerland) for providing us with synchrotron radiation beam time at the TOMCAT beamline of the SLS.
We also thank Alida Bailleul (IVPP Chinese Academy of Sciences, Beijing), Edina Prondvai (School of Geography, University of Birmingham), Lucas Legendre (Jackson School of Geosciences, University of Texas at Austin) and Christian Foth (Department of Geosciences, University of Fribourg) for their comments on earlier versions of the manuscript.
Finally, we thank the anonymous reviewers for providing helpful comments, which were critical to the improvement of this manuscript.


