Assessment of the usage of biodegradable polymeric matrix in vaginal devices to sustain progesterone release in cows
Abstract
The usage of timed artificial insemination (TAI) at a low cost leading to better reproductive rates has been the aim of several research groups in the field. Usually during TAI protocols, sustained progesterone (P4) release devices are employed. Most devices are constituted of a nylon skeleton covered with a silicon layer with P4. A device based on biopolymers was developed in order to reduce costs and decrease its environmental impact. In this study, we compared the kinetics of sustained progesterone release among devices manufactured with a polymeric blend made of polyhydroxybutyrate-valerate (PHBV) and poly-ε-caprolactone (PCL) (DISP) which were compared with DIB® (Internal Bovine Device) used as the control. In the in vitro and in vivo progesterone release tests, two types of biopolymer-based devices with a superficial area of 147 cm2 were used: DISP8 (46% PHBV, 46% PCL and 8% P4; n = 4), DISP10 (45% PHBV, 45% PCL, 10% P4; n = 4) and DIB® (1 g P4, 120 cm2 area; n = 3). The in vitro tests were carried out according to USP XXIII specifications and were performed in a dissolutor sink using an alcohol/water mixture (60/40 v/v) as a release media and samples were collected at 2 min, 2, 4, 8, 12, 24, 48, 60, 72, 84 and 96 h. P4 concentrations were measured through spectrophotometry in a 244 nm long wave. Three to 3 comparisons of angular coefficients of the straight lines obtained by regression analysis of accumulated P4 concentrations as a function of square root of time were carried out. Furthermore, the diffusion coefficient values of P4 were also determined for DISP8 and DISP10. The results showed that the concentrations of P4 were higher in the DISP10 (774.63 ± 45.26 μg/cm2/t1/2) compared to DISP8 (566.17 ± 3.68 μg/cm2/t1/2) (P < 0.05). However, both DISP10 and DISP8 P4 concentrations did not differ from DIB® (677.39 ± 16.13 μg/cm2/t1/2). For the analysis of released quantities per day of the in vitro test, four periods were considered: 0–24, 24–48, 48–72 and 72–96 h. In the first 24 h, DISP8 released significantly less P4 than DISP10 or DIB®, which did not differ among them. Between 24 and 48 h, DISP10 released significantly more P4 than DIB®. DISP8 released an intermediate P4 amount and did not differ significantly from DIB® or DISP10. Between 48 and 72 h, P4 quantity released by DISP10 was significant higher (P < 0.01) than that of DIB® and DISP8, which did not differ among themselves. Between 72 and 96 h, DISP10 released significantly more P4 than DIB®, and DISP8 released an intermediate amount which did not differ from DIB® or DISP10 (P < 0.01). There was interaction between treatment and time (P = 0.0024). The diffusion coefficient values were: 1.36 × 10⁻⁸ (cm2/s) for DISP10 and 1.12 × 10⁻⁸ (cm2/s) for DISP8. For the in vivo test, ovariectomized crossbred cows received DIB® (n = 4) or DISP8 (n = 8) in an alternate design with a non-balanced sequence (cross-over) added of measures repeated in time referring to 16 days of blood samples collection. Samples were analyzed through radioimmunoassay in solid phase using the commercial kit of DPC (Diagnostics Products Corporation). Plasma concentrations of P4 peaked at 4 h after the placement of the device, this being the only time in which plasma P4 concentrations differed between DIB® (11.45 ± 1.96) compared with DISP8 (9.23 ± 1.15 ng/mL) (P = 0.027). On day 8, plasma P4 concentrations were similar for DIB® (2.44 ± 0.09) and DISP8 (1.89 ± 0.13 ng/mL) (P = 0.58) showing that both devices were able to keep P4 concentrations above 1 ng/mL in the plasma of the cow during the 16 day in vivo test. In conclusion, devices manufactured with the blend of PHBV/PCL biopolymers can sustain the release of P4 in a similar manner as silicon.
Introduction
The accuracy of estrus detection is a crucial limitation among the challenges involved in the implementation of a successful artificial insemination (AI) program in a herd (Madureira & Pimentel 2005). Several studies indicated that 27 to 45% of cows enrolled in an AI program are not efficaciously detected in estrus (Cavalieri & Fitzpatrick 1995).
The high rate of animals in anestrous (Pursley et al. 1997) decreases the service rate, which is the number of inseminated animals related to the number of available animals for insemination and/or natural mating (Madureira et al. 2004).
During recent years, the better understanding of the physiology of the estrous cycle has made the synchronization of ovulation possible through the use of hormonal treatments of cows, enabling a timed AI (TAI). Hence, service rate increases to 100% once all available animals are inseminated at the same period, eliminating the necessity of estrus observation (Madureira & Pimentel 2005). In order to implement TAI protocols, there needs to be a way of progesterone (P4) supplementation, which can be done orally, subcutaneously or intravaginally which is most widely used via the usage of P4-releasing devices to sustain plasma P4 concentrations.
Macmillan et al. (1991) tested a device consisting of a nylon structure covered with an inert silicon elastomer membrane impregnated with P4 in heifers and cows. These materials are biocompatible but not biodegradable, leading to an increase in the costs of TAI protocols (Macmillan et al. 1991).
Rathbone et al. (2002b) elaborated a P4 intravaginal dispersal device in PCL (poly-ε-caprolactone) with the same superficial area as CIDR® (Controlled Internal Drug Release, Zoetis, Hamilton, New Zealand): 120 cm2. They tested the P4 release, by measuring the P4 plasma concentration of ovariectomized cows and observed P4 plasma concentrations inferior to those provided by CIDR, and hence noticed that PCL had a different releasing rate than CIDR. Another study was performed in order to identify plasma P4 levels in relation to surface area, P4 load and temperature of manufacture and the results showed surface area to be the only significant variable, and so they increased the device's surface area to try to make it compatible with CIDR. After assuming that there is a linear relationship between plasma levels and surface area, the final device developed had 140 cm2. When in vitro study was performed, P4 showed release rates per cm2 as a function of square root of time and the rate of release between the PCL-based device and CIDR were quite similar: 1342 versus 1290 μg/cm2/t1/2, respectively. The final PCL-based device was manufactured with 142.9 cm2 of surface area and 2.2 g of P4 load, which made it very similar to CIDR.
According to Valentim (2004), the cost of devices made with silicon is divided into 10% nylon, 64% silicon and 26% P4. However, other than the fact of silicon being a material more expensive than the biopolymers, such as PHB-V and PCL, it needs a curing time at a temperature higher than 200°C, hence, the substitution of silicon for biopolymers can represent a significant reduction of the cost of the device.
The aim of this study was to test the sustained P4 release of a device based on biodegradable polymers constituted of poly-hydroxy-butyrate and valerate (PHB-V, PHB Industrial, Serrana-SP, Brazil), and PCL, gathered in a blend and mixed with P4, using in vitro and in vivo models.
Materials and Methods
In vitro tests
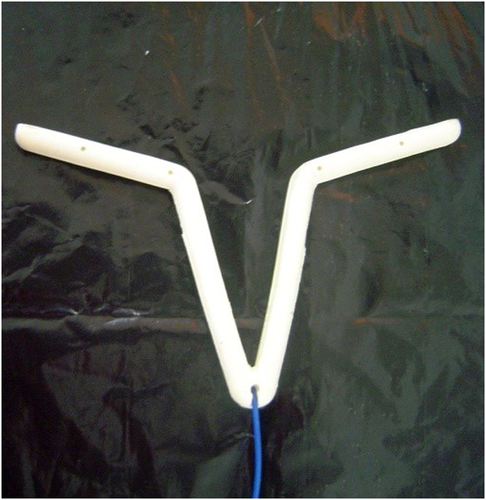
For the analysis of P4 release in vitro, a completely randomized block design with repeated measures across time was used to compare the rate of P4 release between DISP8, DISP10 and Device Internal Bovine (DIB, Syntex®, Buenos Aires, Argentina). Two tests (blocks) were performed with three devices in duplicate: Device Internal Bovine (DIB, Syntex®, Buenos Aires, Argentina) (Fig. 1) was used as a control, which according to the manufacturer contains 1 g of P4 and 120 cm2 of surface area; DISP8 containing a polymeric blend of 46% PHBV, 46% PCL and 8% P4; and DISP10 containing 45% PHBV, 45% PCL and 10% P4 (Fig. 2). Both devices had an area of 147cm2 and were manufactured through extrusion and injection processes.
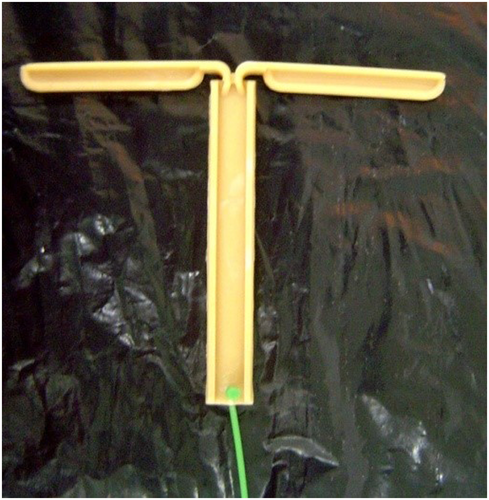
The devices weighed 16.4 ± 0.6 g and 16.3 ± 0.7 g for DISP8 and DISP10, respectively. Thus, the estimated P4 amount was 1.31 g for DISP8 and 1.63 g for DISP10 and each device was considered an experimental unit.
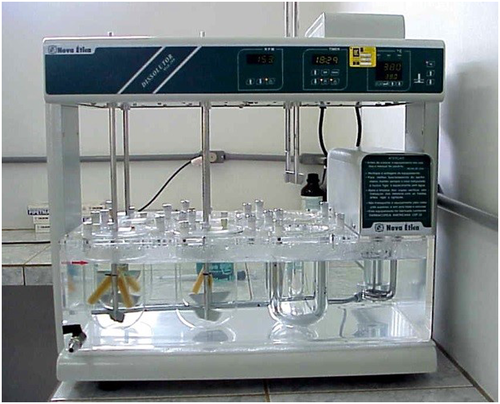
Two tests were carried out. In each test, two DIB, two DISP8 and two DISP10 were used. For that, a dissolutor (Nova Ética mod. 299, Vargem, Grande Paulista, Brazil) containing six sinks with capacity for 1000 mL each was used (Fig. 3). The sinks were filled with a release medium composed of a mixture of absolute alcohol and water (60:40 v/v). The devices were fixed and placed in the dissolutor's rotating temples at 38°C and the devices attached to the temples were placed into the sinks and maintained agitation speed of 150 rpm (Bunt et al. 1997).
Samples of 1 mL of medium were collected and placed in glass bottles sealed with Parafilm® (Pechiney Plastic Packaging, Menasha, WI, USA) for the following periods: 2 min, 2, 4, 8, 12, 24, 48, 60, 72, 84 and 96 h and kept in the fridge at 4°C for a maximum 3-day period.
Progesterone measurement
P4 was measured using the spectrophotometry technique, in which the sample's absorption was related to P4 concentration based on a standard curve given by the following equation: y = 0.052x +0.069 and R2 = 0.9999). The standard absorption readings were carried out in a spectrophotometer in a wave length of 244 nm (Shimatzu® UV 1203, Shimatzu Corporation, Kyoto, Japan).
The standard curve was plotted into a graph, where standard concentrations were placed at the × axis and the absorptions at the Y axis. Therefore, the equation y = a + bx was obtained and used to calculate P4 concentrations in samples according to their absorption.
Serial dilutions of the samples in alcohol/water were performed as often as necessary in order to keep absorption obtained in 24 nm between 20 and 80%.
The average absorption of duplicates was converted to P4 concentration using the standard curve equation. Next, the amount was multiplied by the dilution and by the sink volume obtaining the accumulated amount of P4 released by the device. This obtained P4 concentration released by the device was divided by the device's area in order to obtain the P4 amount released per cm2.
The accumulated amount of P4 released per cm2 was plotted into a graph where the square root of time was placed at the × axis and concentrations per cm2 of the device area at the Y axis. Based on the accumulated amount of P4 released, we calculated P4 amounts released every 24 h.
Data were statistically analyzed using the Statistical Analysis System (SAS 2001) with previous check of residues normality by Shapiro–Wilk test (PROC UNIVARIATE; P > 0.05).
Regression equations were obtained using PROC REG from SAS in a linear model y = a + bx, where determination coefficients (R2) and the linear effect probability were obtained. Comparisons (three to three) of angular coefficients (slopes) were carried out through PROC GLM from SAS.
The coefficients indicated P4 release speed of the devices and were expressed in μg of P4 per cm2 as a function of square root of time.
The dependent variable ‘P4 amount released per day (mg/day)’ was submitted to variance analysis. The repeated measures in time factor referring to the four intervals of 24 h were added to the statistical analysis of this variable. The probability of interaction with time was determined by the Greenhouse‑Geisse test using the REPEATED command generated by GLM procedure (PROC GLM from SAS). When there was interaction between time and treatment, the averages within time were analyzed by Tukey test. In all statistical analyses, the considered level of significance was P < 0.05.
In vivo test
An in vivo experiment was carried out to compare the P4 releasing rates between DISP8 and DIB. It was performed using a cross-over with repetitive measurements of time during the 16 days of blood sampling. Six crossbred animals with Zebu blood predominance (Bos taurus indicus × Bos taurus taurus) were ovariectomized through the left side following suitable asepsis and anesthesia procedures approved by the bioethics commission of the Faculdade de Medicina Veterinária e Zootecnia from Universidade de São Paulo, Brazil. During the experiment, the animals were fed with ad libitum mineral salt and maintained in Brachiaria brizanta cv marandu pastures and supplemented with sugarcane and ration following nutritional demands required by the National Reseach Council (2001).
The P4 releasing devices were introduced intravaginally and were left in place for 16 days. Four animals received DISP8 and two received DIB.
After 40 days at the end of the first experiment the animals that were treated with the DIB device were then treated with DISP8 keeping the following group division: two animals with DIB and four with DISP8.
Blood samples were collected by coccygeal venipuncture into tubes containing ethylenediaminetetraacetic acid (EDTA; Becton Dickinson, Franklin Lakes, NJ, USA) at the following periods: 0, 2, 4, 8, 12, 24, 48, 96, 144, 192, 240, 288, 336 and 384 h.
The samples were centrifuged at 1500 × g at 4°C for 15 min Sorvall, (Kendro Laboratory Products 31 Pecks Lane, USA), and plasma was collected and frozen until P4 concentration analysis by radioimmunoassay (RIA) using the DPC commercial kit (Diagnostics Products Corporation Siemens Healthcare Diagnostics, Los Angeles, CA 90045, EUA) was performed.
Obtained data were analyzed statistically using the SAS (2001) with previous check of residue normality by Shapiro–Wilks test (PROC UNIVARIATE).
The probability of interaction with time was determined by Greenhouse‑Geisse test using the REPEATED command generated by the GLM procedure (PROC GLM from SAS). Student's t-test was used to compare averages. In all statistical analyses the level of significance considered was 5%.
Results
In vitro experiment
There was no interaction between the experimental block and the type of device; neither was there significant effect when only the experimental block was analyzed. Therefore, the results of both tests were grouped. The averages of P4 quantities released by cm2 of each device as a function of time square root are found in Figure 4.
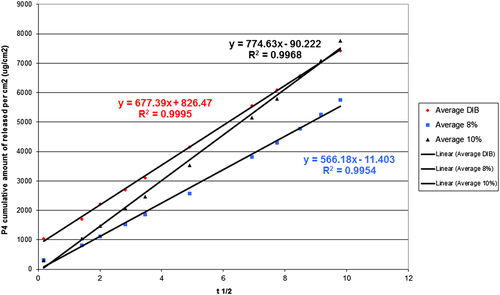
Comparisons (three to three) of angular coefficients are presented in Table 1. The averages and standard error (SE) of angular coefficients were 677.39 ± 16.13 μg/cm2/t1/2 for DIB, 566.17 ± 3.68 μg/cm2/t1/2 or DISP8 and 774.63 ± 45.26 μg/cm2/t1/2 for DISP10. There was difference between DISP8 and DISP10, but no statistical difference between DIB and the other two.
| Treatments | |||
|---|---|---|---|
| DIB® | DISP8 | DISP10 | |
| Means | 677.39a | 566.17a | 774.63a |
| Standard error | 16.13 | 3.68 | 45.26 |
| Probabilities | |||
| Block | 0.2171 | ||
| Treatments | 0.0031 | ||
- a Different letters in the same line differ statistically (P ≤ 0.25) DIB, Internal Bovine Device; DISP8 (46% PHBV, 46% PCL and 8% P4); DISP10 (45% PHBV, 45% PCL, 10% P4).
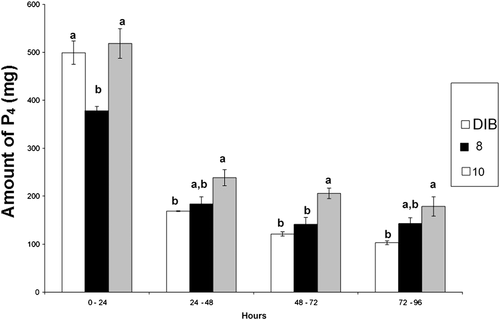
The averages and SE of daily quantity of P4 released, second device, are found in Figure 5. An interaction was observed between treatment and time (P = 0.002). In the first 24 h, DISP8 released less P4 than DISP10 and DIB (P = 0.0024). Between 24 and 48 h, DISP10 released more P4 than DIB (P < 0.0310). However, DISP8 released an intermediate quantity which did not differ from that released by DIB or by DISP10 (P < 0,8407; Table 2). At the time period between 48 and 72 h, P4 quantity released by DISP10 was higher when compared to the P4 release by DIB and DISP8. Finally, at 72 and 96 h, P4 quantity released by DISP10 was higher than that released by DIB and DISP8.
| Treatment | ||||
|---|---|---|---|---|
| Hours | DIB® | DISP8 | DISP10 | Tukey |
| 0–24 | 499.10a ± 24.48 | 377.47a ± 9.56 | 518.30a ± 30.83 | 0.0082 |
| 24–48 | 168.63a ± 0.77 | 183.45a ± 15.11 | 238.69a ± 16.73 | 0.0310 |
| 48–72 | 121.19a ± 4.50 | 141.38a ± 14.03 | 205.86a ± 10.96 | 0.0047 |
| 72–96 | 102.95a ± 3.94 | 142.98a ± 12.00 | 178.61a ± 20.15 | 0.0183 |
- a Different letters in the same line differ statistically by Tukey test. Greenhouse–Geisser Epsilon. DIB, Internal Bovine Device; DISP8 (46% PHBV, 46% PCL and 8% P4); DISP10 (45% PHBV, 45% PCL, 10% P4)
- Time × Treatment P = 0.0024
- Time × block P = 0.8407.
At the end of the 98 h test, DIB released 890 mg of P4 representing 89.1% of the total initial amount. DISP8 released 845 mg of P4 which represented 64.5% of the initial amount, whereas DISP10, which was the device presenting the highest initial quantity of P4 (1.63 g), released 1.140 mg of P4, representing 69.9% of the total initial P4 amount.
In vivo experiment
As shown in Table 3 and illustrated in Figure 6 plasma P4 concentration averages at the 384 h test were 4.06 ± 0.27 ng/mL for DISP8 and 4.94 ± 0.5 ng/mL for DIB, in which there was no statistical difference among them (P > 0.05).
| Treatment | |||
|---|---|---|---|
| Hours | DIB® | DISP8 | Probabilities |
| 0 | 0.783 ± 0.40 | 0.91 ± 0.19 | 0.896 |
| 2 | 9.82 ± 1.21 | 8.27 ± 1.21 | 0.124 |
| 4 | 11.45 ± 1.96 | 9.23 ± 1.15 | 0.027 |
| 8 | 10.48 ± 1.85 | 9.18 ± 0.729 | 0.196 |
| 12 | 8.98 ± 0.72 | 7.42 ± 0.64 | 0.122 |
| 24 | 7.30 ± 0.93 | 5.65 ± 0.56 | 0.101 |
| 48 | 4.83 ± 0.42 | 3.86 ± 0.31 | 0.334 |
| 96 | 3.29 ± 0.39 | 2.58 ± 0.10 | 0.480 |
| 144 | 2.75 ± 0.24 | 1.93 ± 0.16 | 0.410 |
| 192 | 2.44 ± 0.09 | 1.89 ± 0.13 | 0.584 |
| 240 | 2.13 ± 0.18 | 1.72 ± 0.14 | 0.686 |
| 288 | 1.84 ± 0.18 | 1.56 ± 0.12 | 0.781 |
| 336 | 1.53 ± 0.09 | 1.38 ± 0.13 | 0.885 |
| 384 | 1.56 ± 0.09 | 1.21 ± 0.09 | 0.732 |
| Means | 4.94 ± 0.50 | 4.06 ± 0.27 | 0.138 |
- Greenhouse–Geisser Epsilon = time × treatment = P = 0.5952. DIB, Internal Bovine Device; DISP8 (46% PHBV, 46% PCL and 8% P4); DISP10 (45% PHBV, 45% PCL, 10% P4).
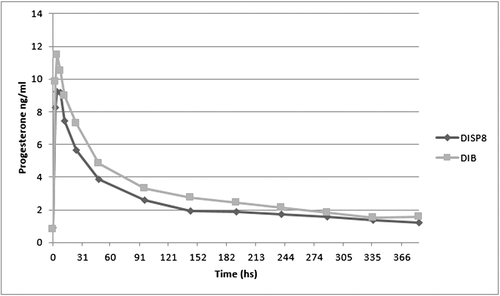
Maximum concentration of P4 occurred 4 h after device implementation for DIB and DISP8. However, maximum concentration was 11.45 (± 1.96) ng/mL for DIB and 9.23 (± 1.15) ng/mL for DISP8 (P < 0.05; Table 3). During the blood sampling period, both devices maintained P4 concentrations above 1 ng/mL.
Discussion
In vitro tests
In the present study, the intravaginal devices used followed the mathematical equation model of Higuchi (Qt = KH√ t), in which the quantity of P4 released per cm2 occurred as a function of the square root of time (Higuchi 1961). Angular coefficients of DISP8 (566.17 ± 3.68 μg/cm2/t1/2) and of DISP10 (774.63 ± 45.26 μg/cm2/t1/2) differed statistically, which means that the highest P4 quantity in DISP10 was enough to increase the release speed. However, DIB (677.39 ± 16.13 μg/cm2/t1/2) showed intermediate release speed and did not differ from the others. Figure 4 shows that DIB® and DISP8 regression curves were practically parallel, and in order for the quantities of P4 released daily to be similar, there would only need to be a few arrangements in the device size, hence, in its superficial area. DISP8 has 147 cm2 of area while DIB has 120 cm 2. Such a difference in area was enough to compensate the lower release speed and make possible an adjustment in P4 quantities released per day, as can be seen in Figure 5.
Bunt et al. (1997) studied in vitro release of CIDR devices similar to our experimental conditions, and obtained a higher speed rate of P4 release (average slope of 1.228 ± 52 μg/cm2/t1/2) than those observed in this study. They also observed that release speed increased as a function of the square root of the double of the initial P4 quantity contained in the device. Indeed, CIDR release is higher when considering DIB, although both are made with silicon-based material and have the same area, 120 cm2. In this case, P4 quantity of CIDR (1.9 g) is almost double that of DIB (1.0 g) and this might explain release differences.
Borgfeldt et al. (1997) compared CIDRs with different formulations in vitro and in vivo and concluded that the in vitro test is more efficient to identify slight differences among the tested devices once there were no significant differences among treatments in the in vivo test.
Rathbone et al. (2002b) compared slopes of PCL-based devices and 10% of P4 with a CIDR device and verified that these slopes were similar and remained about 1.300 μg/cm2/t1/2. In this study, the slopes were 677.39 ± 16.13 μg/cm2/t1/2 for DIB, 566.17 ± 3.68 μg/cm2/t1/2 for DISP8 and 774.63 ± 45.26 μg/cm2/t1/2 for DISP10 with a statistical difference between DISP8 and DISP10, but no statistical difference between DIB and the other two.
Determination of diffusion coefficient
A mathematical modeling of drug release process is able to provide reliable information of mass transport as well as allows the analyses of parameters and variables in the experimental condition such as device geometry, initial drug concentration, distribution and its release mechanism (Arifin et al. 2006). Hence, the optimized device project requires the determination of drug release profile to be predicted using a systematic approach with a minimum number of experimental studies.
Higuchi (1961) suggested the first example of a mathematical model developed for the purpose of describing drug release in a matrix (Grassi & Grassi 2005). This model makes several approximations, and it was initially developed for plane geometrical systems and then extended to other geometries and porous matrices (Siepmann & Peppas 2001). The model indicates that drug release is proportional to square root of time, which is in agreement with what is predicted by the analytical solution according to Fick's Law for cases in which the amount released is inferior to 60% (Siepmann & Peppas 2001).
 (1)
(1)where q is P4 concentration in the device (mg/g); De is the P4 diffusion coefficient in the device (cm2/s); t is the time and r is the radial direction (cm).
In modeling, it was also considered that the initial P4 distribution in the device is homogeneous. The agitation system guarantees that the P4 concentration released during fluid phase is homogeneous; P4 diffusivity is constant, external resistance in the liquid film is neglected due to agitation.
- - em t = 0:
 (2)
(2)- b) - em r = Re t > 0:
 (3)
(3)- c) - em r = 0
 (4)
(4) (5)
(5) ; ξ = r/R, J0 and J1 are Bessel functions of the first kind, in the order of zero to one, respectively; αj are roots of Bessel function of the first kind and order zero.
 (6)
(6) (7)
(7) (8)
(8) is P4 experimental mass released for the solution (mg), calculated using the model.
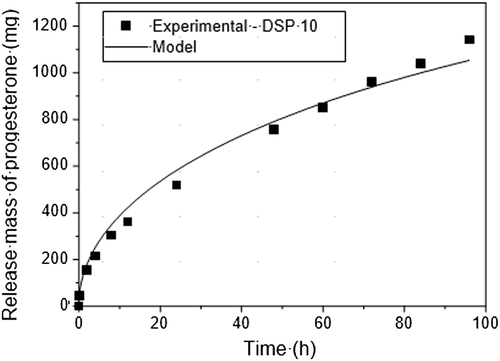
The diffusion coefficient values obtained were the following: 1.12 × 10⁻⁸ cm2/s for DISP8 and 1.36 × 10⁻⁸ cm2/s for DISP10. DISP8 and DISP10 possess similar geometric conformations with different polymeric matrixes and P4 concentrations. Considering the concept that the diffusion coefficient of a substance in a matrix is the function of several factors, such as the matrix material type, temperature, initial concentration and geometry, it is not possible to conclude that the higher diffusivity of DISP10 is related to the polymeric matrix once initial concentrations in both devices are different. The diffusion coefficient values obtained in this research ranged between 0.5–22 × 10−8 cm2/s as shown by Valenzuela-Calahorro et al. (2003), when they determined P4 diffusivity in four carbonaceous materials.
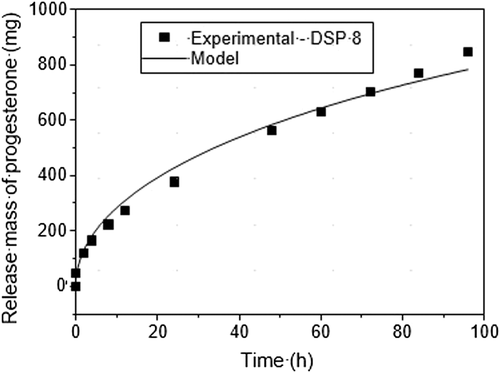
Absolute and estimated values by the application of the second Fick's Law for P4 release showed having similar diffusion equations representing P4 release by DISP8 (R2 = 98.5) and DSP10 (R2 = 98.2) as shown in Figures 7 and 8.
Release speed seems to be inherent to the matrix manufacture material; however, the manipulation of a series of factors might help to control release adjusting it to several needs. Borgfeldt et al. (1997) compared CIDRs produced with several silicon materials with or without 10% calcium carbonate and micronized or non-micronized P4. They found that the CIDR device containing non-micronized P4 released at a slow rate when compared to CIDR with micronized P4, possessing slopes of 1078 μg/cm2/t1/2 and 1088 μg/cm2/t1/2, respectively. Nevertheless, the addition of an inert additive (calcium carbonate) in silicon reduced the P4 release rate in CIDR. Other authors also had observed reduction in steroid release rate mixed in a silicon matrix when inert additives were added. Perhaps the addition of inert additives increases the distance which the steroid molecule has to travel to reach the silicon surface, then reducing release speed (Pfister et al. 1987). In the present study, no additives were used to help control P4 release. However, the P4 used was micronized.
Also, there were no additives used in the polymer matrix. However, in preliminary studies it was identified that, as the time went by, there was an increase in breakage of this matrix. In order to try to solve this issue, chitosan can be added to the devices to resolve this problem; devices containing chitosan increase their flexibility.
Matrix thickness is a very important variable to be considered. In pilot tests, it was possible to observe that specimens more than 2 mm thick did not release more P4 than those which had maximum 2 mm thickness. We hypothesized that it would be more difficult for P4 to migrate in a distance of more than 1 mm in devices made up with PHBV/PCL, and therefore we were careful to maintain almost the whole piece with 2 mm thickness. However, such observations should be further researched and confirmed in future studies.
Rathbone et al. (2002a) sequentially sliced used CIDR devices 100 μm thick and submitted them to an in vitro release test for different time periods. The authors measured P4 concentration in these slices and observed a depletion drug zone, which increased as the release occurred. The depletion zone formation is suggestive of the release as a function of the square root of time as it can be confirmed by the regression equation obtained.
In the first 24 h of in vitro test, DISP8 significantly released less P4 than DISP10 or DIB (Table 2). A higher release rate in the first 24 h of the test does not represent a physiological advantage. In contrast, this excessive P4 release in a short period of time represents a hormonal waste, since the maintenance of the P4 levels is more important to modulate ovarian function in the cow (Wiltbank et al. 2006). In fact, DIB and DISP8 provided much higher plasma P4 concentrations than necessary in the first 24 h after being introduced into the vagina. Thus, the lowest P4 quantity released by DISP8 during this period is seen as an advantage once P4 is saved for further release and also it prevents the animal from receiving excessive P4 in the beginning of the treatment.
DISP10 released significantly more P4 than DIB during the other three periods of 24 h considered. When compared with DISP8, DISP10 released significantly more P4 only between 48 and 72 h. DISP10 kept releasing more P4 than DISP8 as shown in Figure 5; however, the results did not reach a level of significance. Differences between DISP8 and DISP10 are related to the initial P4 quantity as both devices had the same polymer composition and area.
In the present study, DIB released 890 mg of P4 during the total 96 h of the test, representing 89.1% of the initial total and DISP8 released 845 mg of P4, representing 64.5% of the initial quantity, whereas DISP10, which showed higher P4 initial quantity, released 1.140 mg of P4 representing 69.9% of the total. The P4 quantity released by DISP10 is considered intermediate when compared to the other tested devices. DISP10 also kept a higher release rate in comparison to the rates showed by DIB and DISP8 (P ≤ 0.001). This can be explained by the model proposed by Rathbone et al. (2002a), in which P4 is organized in layers in the polymeric matrix and the concentration increase is a result of higher initial release provided by the most superficial P4 and the P4 release is maintained by the release of particles located in deeper regions of the device.
In our studies, the highest release speed and P4 quantities released observed during the time periods should not represent advantages for DISP10. Finally, due to the parallelism of the regression curves between DISP8 and DIB, together with the fact that P4 quantities released in each 24 h interval of the in vitro are similar to DIB release, we decided to use DISP8 in the in vivo test, to test the hypothesis that DISP8 would release P4 at similar concentrations to DIB with a better efficiency.
In vivo test
The P4 releasing devices showed an average of 0.87 ± 0.62 ng/mL before their placement intravaginally into ovariectomized cows.
According to Hollenstein et al. (2006), ovariectomized animals might present low levels of circulating P4 concentrations and they attributed this P4 synthesis to the adrenal cortex. The authors found P4 concentrations in the order of 1.2 ± 0.15 ng/mL in ovariectomized cows under acute stress. In this study, Zebu crossbred cows were used. The Zebu cows tend to behave more aggressively and therefore they are more likely to be under stress response, which can explain the relatively high concentrations of P4 in ovariectomized cows found in this study.
The analysis of the profiles during the experimental period showed a rapid increase in plasma P4 concentrations which reached the peak at about 4 h after device placement in the cow. This period was followed by a constant but slow decrease of P4 concentrations (Fig. 6). DISP8 profile did not differ from that provided by DIB. P4 concentrations were only statistically different at 4 h after the beginning of the experiment (P < 0.05; Table 3).
In a similar study, Rathbone et al. (2002a) compared the plasma P4 profile in ovariectomized cows that received CIDR or a polymeric matrix device composed by PCL. They also observed P4 plasma profiles similar to our results. This was also true in another study where cows that received CIDR, DIB and two other different types of silicon-based devices (Valentim 2004). Rathbone et al. (2002a) plotted the P4 quantity released in vitro against square root of time. The obtained line was a linear curve and high value of R2 (R2 = 0.992). The authors also obtained CIDR device sequential slices of 100 μm thick previously placed in the vaginal cavity for several days. They observed a P4 concentration gradient from the deepest to the most superficial parts. This suggests that P4 release would occur through a mechanism of the order of zero. These data were mathematically described by a linear equation and the high R2 value obtained (R2 = 0.989) suggests that a mechanism of the order of zero could be used to demonstrate CIDR P4 in vivo release. In the present study, only the in vivo release model of DISP8 was obtained. If in vivo follows the same model as in vitro release or is similar, CIDR follows a release model of the order of zero, and remains as an important study object for future experiments.
Therefore, the plasma P4 profiles obtained by the use of several vaginal devices are similar and follow a very dependent pattern of release speed, which in the last analysis is an inherent property in matrices used. However, P4 concentrations in blood plasma depend on several factors besides release speed, such as the polymeric matrix area and thickness, P4 concentration in this matrix, the genetic group of the animals used in tests, P4 distribution in the other body compartments and P4 biotransformation capacity.
Rathbone et al. (2002a) concluded that verified differences in P4 concentrations might be explained by the differences in area and P4 concentration of both tested devices. Valentim (2004) found a strong relation among plasma P4 concentrations: the area and concentration of P4 in the silicon matrix. The author presented a regression equation according to which there would be an increase of 0.343 ng/mL at 24 h and 0.00056 ng/mL after 7 days of the device placement for each cm2 that is increased in the area of the device. However, concentrations seem to be more influenced by P4 concentration in the matrix than by the contact surface when the devices are removed.
P4 concentrations found in the circulation are subjected to hormone metabolism in animals. P4 half-life is only from 22 to 36 min in cows (Spinosa et al. 1999). It is known that steroids are metabolized in the liver (Sangsritavong et al. 2002), and an increase in blood flow in this organ might increase P4 metabolism. In dairy cows subjected to a grazing system where the animal is not submitted to food restriction, the treatment with exogenous P4 source (CIDR) presents lower P4 concentrations when compared to that in cows with food restrictions (Rabiee et al. 2001). On the other hand, there is no correlation between milk production and P4 plasmatic levels in dairy cows treated with CIDR.
In this study, the maximum concentrations reached by the devices differed significantly (11.45 ± 1.96 vs. 9.23 ± 1.15 ng/mL, respectively for DIB and DISP8; P = 0.027) (Table 3). For both devices, maximum P4 concentration was reached 4 h after being placed in the vaginal cavity.
Rathbone et al. (2002b) verified that maximum concentrations were lower and the time spent to reach them was greater than those found in this study after comparing plasma P4 concentrations in cows which received a device manufactured with PLC (2.2 g P4 and 142 cm2) or CIDR (1.9 g P4 and 120 cm2). CIDR reached maximum concentration of 5.1 ng/mL, 14.4 h after being placed, while the device based on PCL reached maximum concentration of 5.3 ng/mL after 9.6 h.
TAI programs are usually 7 to 8 days long. Therefore, it is crucial for the P4 supplementing device to be able to sustain plasma P4 concentrations of at least 1 ng/mL on the 8th day of treatment (D8).
In this work P4 concentrations on the 8th day were not statistically different and were 1.89 ± 0.13 and 2.44 ± 0.09 ng/mL for DISP8 and DIB, respectively. Similar data were found by Valentim (2004), who produced devices with different concentrations (1.5 and 1.0 g P4, P50–1.5 and P50–1.0, respectively), and compared them with CIDR 1.9 g and DIB. The author obtained plasma P4 concentrations of 3.3 ± 0.7 ng/mL for CIDR; 2.6 ± 2.0 ng/mL for DIB; 3.0 ± 2.4 ng/mL for P50–1.5; and 1.1 ± 0,27 ng/mL for P50–1.0 on the 8th day. Plasma P4 concentrations on D8 found by Valentim (2004) for DIB were very similar to those found in this study for the same device. Rathbone et al. (2002b) found concentrations in the range of 2.0 ng/mL for CIDR with 1.9 g of P4, and in the same year they observed 2.5 ng/mL with 1.9 g of P4 for the same device in a different experiment. Macmillan et al. (1991) found concentrations around 3.2 ng/mL P4 on the 8th day using CIDR with 1.9 g of P4. However, in this case the RIA technique used to measure P4 was different, which might impede direct comparisons with results of the present research.
According to Rathbone et al. (2002b), the ideal device would reach at least 2.0 ng/mL of plasma P4 concentration at the moment of its removal. In this way, DIB and DISP8 provided 2.44 and 1.89 ng/mL of plasma P4, respectively, on day 8 of the treatment. These values did not differ among themselves and are close to 2.0 ng/mL P4 measurements extended until the 16th day after device placement in order to discover if P4 concentrations would remain enough to prevent ovulation, which would make its reuse possible. P4 concentrations of the in vivo test were 1.56 ± 0.09 ng/mL for DIB and 1.21 ± 0.09 ng/mL for DISP8 on the 16th day, suggesting that their use in two TAI protocols of 8 days might be viable. In an experiment conducted by Santos et al. (2004) several types of devices were placed in heifers for 25 days. The plasma P4 concentrations above 1 ng/mL for 25 days with CIDR 1.38 g, 25 days for CIDR 1.9 g, 15 days for CRONIPRESS®; 13 days for DIB and 22 days for PRID® were found.
The fact that the initial release is inferior for DISP8 and the standard release follows a low parallel line in comparison with DIB might be an advantage for this device. Several researchers observed that P4 concentrations during the luteal phase interfere with the frequency of luteinizing hormone (LH) pulses, and consequently in the growth and diameter of the dominant follicle (Borgfeldt et al. 1997; Fortune 1993; Sirois & Fortune 1990). Rhodes et al. (2003) demonstrated that high P4 concentrations have an inhibiting effect on follicular growth. This became evident in a research carried out by Adams et al. (1992a) and Adams et al. (1992b), who observed that the follicle's maximum diameter of the first wave is higher than that of the second wave in estrous cycles of three follicular growth waves. The follicle of the first wave is found to be under the effects of low P4 concentrations, and consequently subjected to a higher frequency of LH pulses while that of the second wave is under the effect of high P4 concentrations, which results in a lower frequency of LH pulses.
On that same line of thought, Mantovani et al. (2005) kept CIDR for 14 days associated with the application of prostaglandin F2α in the beginning of the treatment to induce the formation of persistent follicles. This led to the formation of dominant follicles, which were bigger than the ones observed in the control group (CIDR for 8 days). The author attributed this fact to follicle growth in an environment of sub-luteal P4 concentrations which, according to Fortune et al. (2004), are between 1 and 2 ng/mL, and hence are in a high LH frequency environment.
Although DISP8 has provided higher P4 concentrations than 1 ng/mL between 8 and 16 days in the vaginal cavity, it is relevant to keep in mind that in the second use, P4 concentrations will be inferior to those observed in the first use. This would certainly influence LH frequency and follicular development with reflexes on fertility which should be studied later.
Conclusion
Vaginal devices manufactured with a blend of PHB-V and PCL polymers in the same ratio may present a sustained P4 release as well as silicon devices. P4 percentage in the polymeric matrix (8 or 10%) interfered with the release speed in the in vitro test. Higuchi's equation, according to which drug release of a polymeric matrix occurs as a function of square root of time, was adequate to mathematically represent P4 release of PHBV/PCL-based devices independently of the P4 percentage being 8 or 10%. Plasma profile of ovariectomized cows treated with DISP8 was similar to that of cows treated with DIB. DISP8 maintained P4 concentrations above 1 ng/mL during the 16 days of treatment. Therefore, it releases enough P4 for two use periods of 8 days. Diffusion coefficient values obtained were 1.36 × 10⁻⁸ (cm2/s) for DISP10 and 1.12 × 10⁻⁸ (cm2/s) for DISP8. The model proposed based on Fick's Law makes the acknowledgement of P4 release kinetics possible without linearization limits of Higuchi's equation.


