Genetic diversity and structure in Asian native goat analyzed by newly developed SNP markers
Abstract
In the current study, a total of 65 single nucleotide polymorphisms (SNPs) within the intron region were developed in goat (Capra hircus) by utilizing genomic information of cattle and sheep due to poor available genomic information on goat. Using these markers, we carried out genetic diversity and structure analyses for 10 Asian goat populations. The phylogenetic tree and principal components analysis showed good correspondence between clustered populations and their geographic locations. The STRUCTURE software analysis illustrated six divergent genetic structures among 10 populations. Myanmar and Cambodia populations showed high admixture patterns with different ancestry, suggesting genetic introgression into native goat populations. We also investigated the correlation between genetic diversity and geographic distance from a domestication center. This result showed a decreasing trend of genetic diversity according to the distance (P = 0.014). This result supported common consensus that western Asia is one of the centers of origin for modern Asian domestic goat.
Introduction
Goat (Capra hircus) is probably one of the earliest domesticated ruminants, occurring at approximately 10 000 years ago (Zeder & Hesse 2000). Today, goats are raised all over the world due to their tolerance to various environments, adaptability to nutrient-poor diets and manageable size. The production of milk, meat and skin are very important, particularly in developing countries. More than 65% of goats around the world exist in these areas. Asia has rich goat resources, but several improved goat breeds have been recently introduced into developing countries for improvement of native goats, resulting in native goats being highly endangered. Therefore, it is important to understand genetic information for the conservation of genetic diversity in the Asian goat.
To date, genetic analyses for goats have been performed mainly using maternally inherited mitochondrial DNA (Luikart et al. 2001; Mannen et al. 2001; Sultana et al. 2003; Chen et al. 2005; Naderi et al. 2008; Lin et al. 2013) and high-polymorphic autosomal microsatellite markers (Barker et al. 2001; Rout et al. 2008). However, the ascertainment bias caused by typically selecting the most polymorphic markers may lead to reduced sensitivity for judging genome-wide levels of genetic diversity (Vali et al. 2008).
In recent years, single nucleotide polymorphism (SNP) has attracted attention as an alternative marker due to wide distribution across the genome, low mutation rate and simplicity to reproduce among different laboratories. Although bi-allelic SNP is less informative than multi-allelic microsatellites, it can be powerful when a certain number of SNP loci are applied for genetic analyses. Cappuccio et al. (2006) has reported 27 SNPs in 23 genes in the European goat, but similar studies have not been carried out due to lack of SNP markers in the Asian goat.
The aim of current study was to develop novel SNP markers in goat, and then investigate the genetic diversity and structure of the Asian goat using novel SNP markers.
Materials and Methods
Animals
In this study, 60 Cambodian, 20 Indian (IND), 30 each of Mongolian (MGL), Laotian (LAO), and Myanmar (MYA), Vietnamese (VIE), Bhutanese (BHU), Bangladesh (BAN) and Philippine (PHI) native goats were used for genetic population analyses. In 60 Cambodian goats, 30 animals were sampled from mountainous areas (CAM_M) and remaining animals were from plains areas (CAM_P). The information of detailed sampling locations was described in a previous study (Lin et al. 2013). Efforts were made to avoid sampling from related individuals. Genomic DNA was extracted from blood according to the standard phenol and chloroform method.
Primer designed and PCR
In order to detect SNPs within introns, 71 genes were selected from sheep gene sequences published in a database (Table S1). All primers were designed within exon regions flanking introns based on information about exon/intron structures estimated by comparison with the cattle genome sequence (Btau 4.0).
PCR was performed in volumes of 20 μL of reaction mixture, including 50 ng of DNA, 1 μL (10 pmol/μL) of each primer, 2 μL of 10 × PCR buffer (100 mmol/L Tris-HCl, 15 mmol/L MgCl2, 500 mmol/L KCl, ph8.6), 1.6 μL deoxynucleotide triphosphate (dNTP) mixture (2.5 mmol/L each) and 0.1 μL EX-Taq polymerase (5 units/μL). PCR was carried out in an initial denaturation at 94°C for 2 min, followed by 35 cycles of 30 s for denaturation at 94°C, 30 s for annealing at the temperature optimized for each primer pair and 90 s for extension at 72°C, and a final extension step at 72°C for 4 min.
Sequencing and SNP detection
Eight individuals from different goat populations were used to detect SNPs in Asian goats. After purification of DNA product using Ultra CleanTM 15 DNA Purification Kit (Mo Bio Laboratories, Inc. Carlsbad, CA, USA), DNA sequencing was performed with BigDye® Terminator v3.1 Cycle Sequencing Kit (Applied Biosystems, Foster City, CA, USA) and ABI PRISM® 3100 Genetic Analyzer (Applied Biosystems). Sequence alignment of eight individuals was achieved using the MEGA package Ver.3.1 for SNP detection (Kumar et al. 2004).
Based on sequencing results, minor allele frequency (MAF) of each SNP was calculated. When two and more SNPs were identified in a gene, the SNP with the highest MAF (defined as maximum MAF) was selected for PCR restriction fragment length polymorphism (RFLP) (Table S2).
SNP genotyping
Out of the 71 SNPs, 65 SNPs were developed as RFLP markers for genotyping and their primer sets were designed for PCR amplification (Table S3). PCR was performed using 20 μL of reaction mixture, including 50 ng of DNA, 1 μL (10 pmol/μL) of each primer, 2 μL of 10 × PCR buffer (100 mmol/L Tris-HCl, 15 mmol/L MgCl2, 500 mmol/L KCl, ph8.6), 1.6 μL dNTP mixture (2.5 mmol/L each) and 0.1 μL EX-Taq polymerase (5 units/μL). PCR was carried out in initial denaturation at 94°C for 2 min, followed by 35 cycles of 30 s for denaturation at 94°C, 30 s for annealing at 56°C to 66°C and 90 s for extension at 72°C, and 4 min extension at 72°C. Amplified PCR products were digested with appropriate restriction enzymes (Table S3) followed by electrophoresis in 2% agarose or 5% polyacrylamide gels. The analysis assumes that bands with the same size are identical alleles.
Statistical analysis
Allele frequencies for SNPs and FIS (inbreeding coefficient) for per population were calculated using FSTAT v2.9.3 (Goudet 2001). Polymorphic information contents (PIC) was calculated using the Microsatellites Tools for Excel (Park 2001). Observed (Ho) and expected (HE) heterozygosities, and average FST were calculated utilizing ARLEQUIN (Excoffier et al. 2005). For the investigation of phylogenetic relationships among populations, standard genetic distance of Nei (1972) was calculated from allele frequencies, and a neighbor-joining tree (Saitou & Nei 1987) was constructed using PHYLIP 3.6 (Felsenstein 1989). Principal components analysis (PCA) was performed according to the software MVSP 3.1 (Kovach 2005) and the principal components were calculated from all allele frequencies for each population.
Population structure and degree of admixture were inferred using STRUCTURE 2.3 (Pritchard et al. 2000) included prior information on populations. STRUCTURE uses Bayesian clustering of multi-locus genotypes to assign individuals to populations, estimate individual admixture proportions and infer the number of parental populations (K) for a given sample. To obtain a representative value of K for modeling the data, we performed 10 independent runs of the Gibbs sampler for each K (1 ≤ K ≤ 10) with a 20 000 initial burn-in used to minimize the effect of the starting configurations, followed by 100 000 MARKOV CHAIN MONTE CARLO iterations, as recommended by Falush et al. (2007). We used the default settings, and an admixture model with independent allele frequencies and the parameter of individual admixture alpha were set to be the same for all clusters.
Results
SNP detection and allele frequency
After sequencing 71 intron regions of genes, sequence comparison among eight animals revealed a total of 417 SNPs. The number of SNPs observed in each gene ranged from one (IL6) to 17 (LOC100125612) (Table S2). For developing high polymorphic markers, SNPs with maximum MAF in each gene were selected. Average MAF of the 71 selected SNPs was 0.320. Out of the 71 SNPs, 53 SNPs were transitions (α) and 18 SNPs were transversions (β), giving a mutational ratio (α/β) of 2.94. This ratio was consistent with SNP collections identified from sheep (α/β = 2.67 in 5982 SNPs, Kijas et al. 2009).
Population genetics
As six SNPs were not located on any restriction enzyme sites, we designed the remaining 65 SNPs for RFLP markers (Table S3) and genotyped in Asian goat populations. The average MAF for 65 SNPs was 0.304 (Table S2). Most SNPs (50/65, 76.92%) were polymorphic in all populations.
Table S2 also shows genetic indices of PIC, Ho, HE and FST in each SNP marker. The mean genetic indices in each population are shown in Table 1. The Indian population displayed the highest genetic diversity (HE = 0.381, PIC = 0.285), while the CAM_M population was ranked lowest (HE = 0.285, PIC = 0.199). Significant differences between Ho and HE were observed in two Cambodian goat populations, especially in the CAM_M population with an extreme low of P < 0.001 (Table 1). In addition, the highest inbreeding level was observed in the CAM_M population (FIS = 0.331) and lowest in the Philippine population (FIS = −0.026).
| Population | N | PIC | HO | HE | FIS |
|---|---|---|---|---|---|
| MGL | 30 | 0.278 | 0.365 | 0.367 | 0.006 |
| LAO | 30 | 0.262 | 0.305 | 0.342 | 0.110 |
| MYA | 30 | 0.289 | 0.342 | 0.378 | 0.098 |
| CAM_M | 30 | 0.199 | 0.192 | 0.285 | 0.331 |
| CAM_P | 30 | 0.274 | 0.292*** | 0.356 | 0.181 |
| VIE | 30 | 0.249 | 0.311* | 0.340 | 0.085 |
| BHU | 30 | 0.283 | 0.340 | 0.370 | 0.083 |
| BAN | 30 | 0.266 | 0.318 | 0.351 | 0.096 |
| IND | 20 | 0.285 | 0.368 | 0.381 | 0.035 |
| PHI | 30 | 0.236 | 0.332 | 0.324 | −0.026 |
- FIS: inbreeding coefficient; HE: average expected heterozygosity; HO: average observed heterozygosity; N: Sample sizes; PIC: polymorphic information contents. *P < 0.05, ***P < 0.001.
- MGL, Mongolian; LAO, Laotian; MYA, Myanmar; CAM_M, Cambodian mountainous; CAM_P, Cambodian plains; VIE, Vietnamese; BHU, Bhutanese; BAN, Bangladesh; IND, Indian; PHI, Philippine (PHI) native goats.
Genetic distance and relationships among populations
Table 2 presents the Nei's genetic distance and FST values assessed among all goat populations. The lowest value of Nei's genetic distance was observed between BHU and BAN populations (0.024), while the highest distance was 0.252 between CAM_M and IND populations. Relatively high genetic distances were shown between CAM_M and other populations (0.096∼0.252), followed by PHI and other populations (0.099∼0.165). However, no significant difference was observed among populations by exact test.
| Population | MGL | LAO | MYA | CAM_M | CAM_P | VIE | BHU | BAN | IND | PHI |
|---|---|---|---|---|---|---|---|---|---|---|
| MGL | – | 0.145 | 0.089 | 0.312 | 0.141 | 0.170 | 0.065 | 0.105 | 0.064 | 0.207 |
| LAO | 0.103 | – | 0.063 | 0.172 | 0.091 | 0.042 | 0.097 | 0.110 | 0.177 | 0.201 |
| MYA | 0.068 | 0.047 | – | 0.164 | 0.053 | 0.102 | 0.045 | 0.052 | 0.094 | 0.159 |
| CAM_M | 0.224 | 0.096 | 0.097 | – | 0.173 | 0.206 | 0.228 | 0.222 | 0.336 | 0.280 |
| CAM_P | 0.104 | 0.063 | 0.042 | 0.100 | – | 0.148 | 0.091 | 0.105 | 0.119 | 0.191 |
| VIE | 0.118 | 0.030 | 0.071 | 0.115 | 0.101 | – | 0.139 | 0.155 | 0.208 | 0.227 |
| BHU | 0.049 | 0.068 | 0.038 | 0.144 | 0.067 | 0.096 | – | 0.027 | 0.087 | 0.151 |
| BAN | 0.074 | 0.074 | 0.040 | 0.132 | 0.074 | 0.102 | 0.024 | – | 0.114 | 0.163 |
| IND | 0.051 | 0.134 | 0.076 | 0.252 | 0.092 | 0.156 | 0.068 | 0.084 | – | 0.214 |
| PHI | 0.143 | 0.132 | 0.108 | 0.165 | 0.129 | 0.148 | 0.099 | 0.103 | 0.152 | – |
- MGL, Mongolian; LAO, Laotian; MYA, Myanmar; CAM_M, Cambodian mountainous; CAM_P, Cambodian plains; VIE, Vietnamese; BHU, Bhutanese; BAN, Bangladesh; IND, Indian; PHI, Philippine (PHI) native goats.
Phylogenetic relationship among populations was constructed by a neighbor-joining tree using genetic distance matrix (Fig. 1). The tree shows two major clusters (BAN, BHU, IND and MGL) and (CAM_P, LAO and VIE). The MYA population was located between the two clusters, while PHI and CAM_M populations were apart from the two clusters.
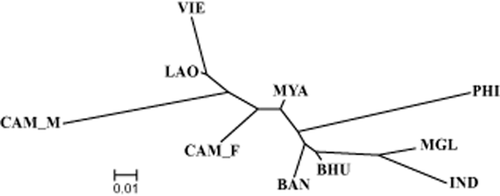
Un-rooted neighbor-joining tree for 10 goat populations using goat 65 goat single nucleotide polymorphism (SNP) markers.
PCA of populations
The population-based PCA was performed using allele frequencies of the 65 SNP markers in 10 goat populations (Fig. 2). The results mostly coincided with the topology of the neighbor-joining tree. The first principal component (PC) accounts for 33.8% of the total variation and especially separated CAM_M population out from other populations. The second PC condenses 19.0% of the variation, which separated the PHI population out from others. The populations are grouped on the basis of geographical location, with the exception of MGL and CAM_M populations.
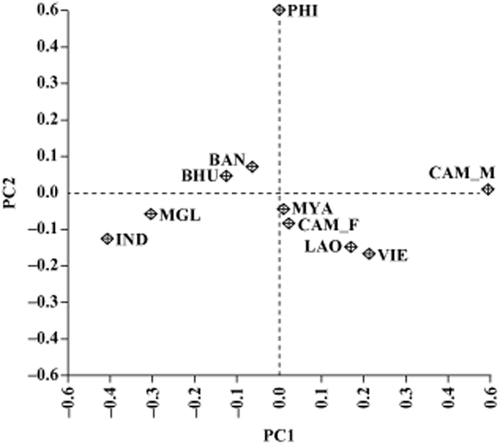
Principal components analysis (PCA) of allele frequencies from 65 single nucleotide polymorphism (SNP) markers typed in 10 goat populations. The first PC accounts for 33.8% of the underlying variation and the second PC condenses 19.0% of the variation.
Population structure and levels of admixture
Figure 3 shows genetic structure analyzed by using the STRUCTURE program. This provided a relatively meaningful explanation of the genetic structure and levels of admixture for populations. We determined an optimum K-value at 6. Among 10 populations, independent structures of CAM_M, CAM_P and PHI goats are shown in Figure 3A. Similar genetic structures were observed between VIE and LAO, BAN and BHU, and MGL and IND goats.
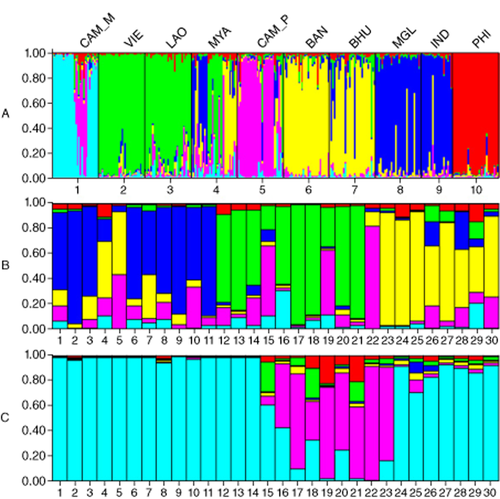
Genetic structures of 10 goat populations. This illustrates total goat population (A), Myanmar (MYA) population (B) and Cambodian mountainous (CAM_M) (C) population, at K = 6 inferred using STRUCTURE 2.3 software, where K is the number of clusters assumed and the length of the colored segment represents the individual's estimated proportion of membership to a particular cluster. Vertical black lines separate populations (A) or individuals (B, C).
Since MYA and CAM_M populations showed high admixture patterns with different ancestry (Fig. 3A), we re-analyzed these populations independently. In the MYA population (Fig. 3B), three major genetic substructures were presented. The substructures were grouped by goats 1∼11 from central and southern Myanmar, goats 12∼21 from eastern Myanmar, and goats 22∼30 from western Myanmar. In the CAM_M goat population, goats 15∼23 presenting different genetic structures were from eastern Cambodia.
Discussion
In the current study, we attempted to develop novel SNP markers of goat and carried out genetic analyses in 10 Asian goat populations. To sequence intron regions of caprine genes, bovine genome information was used to speculate intron region and chromosomal location of candidate genes. In addition, exon sequences of ovine genes were used to design primers, due to less availability of messenger RNA (mRNA) and/or gene information in goat at the present. The orthologous loci of the ovine genes were selected to cover all bovine autosomes. By using this strategy, we detected 417 SNPs in 71 genes and developed 65 SNP markers.
Using the 65 SNP markers, the phylogenetic tree and PCA analysis differentiated populations with good correspondence to geographic locations, except for MGL and CAM_M population (Figs 1, 2). Significant low Ho (0.192) but high HE (0.285) (P < 0.001, Table 1) were observed in the CAM_M population. This could be explained by Wahlund effect, which refers to reduction of heterozygosity in a population caused by subpopulation structure. The population subdivision may be due to geographic barriers, limitation of gene flow and genetic drift between and within the subpopulations.
The STRUCTURE analysis showed different population structures among countries (Fig. 3A). The MYA population revealed the highest genetic admixture of different ancestries (Fig. 3B). In this figure, the goats 12∼21 originated from eastern Myanmar and goats 22∼30 from western Myanmar. The genetic structures of eastern and western Myanmar were similar to those of neighbor countries (Fig. 3A). Goats 1∼11 from central and southern Myanmar showed similar genetic pattern with Indian goats, suggesting genetic introgression from the Indian breed into Myanmar native goats of central and southern Myanmar. Lin et al. (2013) also suggested the introgression of the Indian breed into the Myanmar breed by mitochondrial analysis and morphological examinations.
Two Cambodian goat populations showed different genetic structures between mountain and plain areas (Fig. 3A) and an admixture pattern was observed in the CAM_M population (Fig. 3C). Goats 15∼23 were sampled from eastern Cambodia, where the Mekong River dissects it. The admixture pattern may be due to gene introgression from CAM_P goat into this area via the river, and the introgression is not facilitated in other mountain areas apart from the river.
Genetic diversity in modern populations generally decreases with increasing distance from the center of domestic origin (Troy et al. 2001; Beja-Pereira et al. 2004). The goat is thought to have been domesticated in Western Asia and propagated eastward to Asia (Devendra & Nozawa 1976). In the current study, analysis of genetic diversity showed high values in IND (including its neighboring population as BHU) but relatively low values in CAM_M and PHI populations (Table 1). We investigated correlation between genetic diversity and geographic distance from the domestication center (Fig. 4). This result showed a decreasing trend of genetic diversities according to the distance (P = 0.014). This is consistent with common consensus that western Asia is the major center of origin for modern Asian domestic goats (Zeder & Hesse 2000).
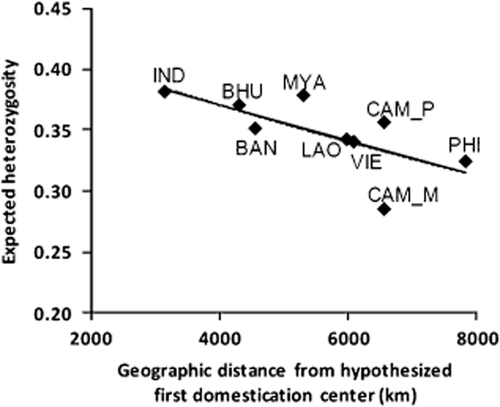
Correlation between genetic diversity and geographic distance from domestication center. Non-parametric correlation (Spearman correlations) was used to test if genetic diversity was correlated with the distance from the domestication center hypothesized by Zeder and Hesse (2000). r2 = 0.446, Spearman's rho = −0.778, P = 0.014.
In summary, we performed comprehensive genetic analyses of 10 Asian goat populations using 65 SNPs developed in this study. The results revealed the genetic diversity, phylogenetic relationship and population structure for Asian goat. Especially, the STRUCTURE analysis sufficiently elucidated the genetic structure and levels of admixture in the Asian goat populations. The results could contribute to providing useful genetic information for conservation of goat diversity.
Acknowledgments
We thank Drs. Namikawa T, Maeda Y, Yamamoto Y, Bouahom B, Dorji T, Phith LC, Daing T, Faruque MO and Masangkay JS for help collecting samples. This research project was supported in part by Grant-in-Aid, no. 14405029, 15405033, 16201046, 70111838 and 19405043 from the Ministry of Education, Culture, Sports, Science and Technology and the Society for Researches on Native Livestock, Japan.


