Growth, oxidative stress and the non-specific immune response of Oncorhynchus mykiss exposed to different light spectra
Xueqian Sun and Xin Zhao contribute equally to the manuscript.
The development and expansion of marine aquaculture in Chinese coastal waters are constrained by space and environmental problems (Hu et al., 2021). Chinese researchers have built a submersible fish cage called “Deep Blue 1” to study salmonid mariculture far-offshore in the Yellow Sea (Jiang et al., 2021; Yu et al., 2022). Rainbow trout (Oncorhynchus mykiss) is one of the most important mariculture species commercially farmed in“Deep Blue 1” (Jiang et al., 2021; Yu et al., 2022). Fish welfare, such as light conditions, is an extremely important aspect of far-offshore mariculture.
Light plays a particularly important role in the health and welfare of teleost fish (Villamizar et al., 2011; Ruchin, 2020). The longer wavelengths (such as the red spectrum) penetrate shallow water, whereas shorter wavelengths (such as the blue and green spectra) predominate in deeper sea waters (Wu et al., 2020). Several studies have demonstrated the effects of light spectra on the growth performance, oxidative stress and immune-physiological responses of sea bass (Lateolabrax maculatus), turbot (Scophthalmus maximus) and goldfish (Carassius auratus) (Hou et al., 2019; Wu et al., 2020; Wu et al., 2021; Noureldin et al., 2021). The rainbow trout is a visual predator and sensitive to a specific light spectrum, but which light spectrum is best for the welfare of this species has not been determined. Heydarnejad et al. (2013) reported that O. mykiss grows best under yellow light. However, Karakatsouli et al. (2008) showed that O. mykiss growth was favoured when the fish were reared under red light. Güller et al. (2020) indicated that different light spectra caused important changes in the activities of antioxidant enzymes and suggested that blue and green light, primarily blue light, should be used to improve O. mykiss culture.
In the present study, healthy O. mykiss juveniles were obtained from a fish farm, in Weifang, Shandong Province, and transported to the Key Laboratory of Mariculture, Ocean University of China (Qingdao, Shandong Province, China), where the experiments were conducted. All experiments were conducted according to the Guidelines of the Animal Research and Ethics Committees of the Ocean University of China. After a 2-week acclimation period, fish of a similar size (mean weight 43 ± 2.1 g, mean length 14.5 ± 0.9 cm) were randomly distributed (7 fish/tank) into 12 glass tanks (length × height × width: 60 × 40 × 30 cm). White fluorescent bulbs (full spectra, made in China) were used during the acclimation period. Four light spectra including white (full spectrum), red (peak at 620 nm), green (peak at 540 nm) and blue (peak at 450 nm) were set up with three replicates per treatment during the experimental period.
During the acclimation and experimental periods, the fish were fed to satiation with the same commercial trout feed (moisture, 7.99%; crude protein, 50.52%; crude lipid, 12.62%; ash, 15%) twice daily (at 08:00 and 16:00 h) at a daily ration of approximately 2% of wet body weight. Uneaten feed was removed by siphoning after 0.5 h of feeding. About 100% of the water in each tank was changed daily. The average temperature and dissolved oxygen were 16.2°C and 7.17 mg/L respectively. Average total ammonia-nitrogen was 0.99 mg/L, nitrite-nitrogen was 0.37 mg/L, nitrate-nitrogen was 1.76 mg/L and pH was 7.92. The photoperiod was 12 L: 12D (08:00–20:00), and the light intensity near the water surface of the tanks was approximately 260 lx.
The experiment was conducted from 30 June to 30 August 2019. At the end of the experiment, the fish were subjected to 1-h of stress (hypoxia, chasing and high stocking density by reducing the water level to a height of 10 cm) (López-Patiño et al., 2014). The fish were weighed, and total length was measured. Growth performance was calculated by daily weight gain (DWG, g/day), specific growth rate (SGR, %/day) and the feed conversion ratio (FCR) at the end of the study (Opiyo et al., 2014).
Three fish were randomly selected at the beginning of the experiment, and one fish from each tank was randomly collected every 15 days during the experiment and after lowering the water level. Total RNA and DNA of fish liver tissues were extracted using RNA and DNA kits (Nanjing Jiancheng Bioengineering Institute, Nanjing, China), and RNA and DNA concentrations were determined by ultraviolet spectrophotometry (Aosheng Nano-300).
Biochemical analysis of 10 parameters was conducted for fish sampled at the beginning, day 15, day 60 and after lowering the water level. Serum and liver samples were collected according to Velisek et al. (2011). Malondialdehyde (MDA), protein carbonyl (PC) and glutathione s-transferase (GST) in the liver, as well as serum aspartate transaminase (AST), alanine transaminase (ALT), total protein (TP), lysozyme (LZM) and catalase (CAT) levels were analysed using commercial kits (Nanjing Jiancheng Bioengineering Institute). Serum cortisol (COR) and superoxide dismutase (SOD) were detected using commercial enzyme-linked immunosorbent assay kits (Elisa).
The results are expressed as mean ± standard deviation. The statistical analysis was conducted with SPSS 24.0 software (SPSS). The Kolmogorov–Smirnov and Levene tests were used to assess the normal distribution and homogeneity variance of the data respectively. If the dataset was normally distributed with equal variance, a one-way analysis of variance was used to compare the difference between the treatments and the sampling times, otherwise a non-parametric test was used. Principal component analysis was used to investigate differences in the 10 biochemical parameters analysed among treatments and sampling times. A p-value <0.05 was considered significant.
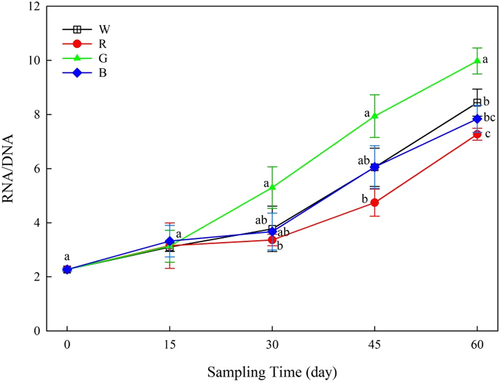
The survival rate of the experimental fish was 100%. The choice of light spectrum did not have a significant effect on the SGR of the fish (Table 1, p > 0.05). However, the DWG of fish under green light was higher than that of fish under red or white light (p < 0.05). Significantly higher final body weight (FBW) and a lower FCR were observed in fish under the green light than in the other treatments. Additionally, the FBW of fish under red light was the lowest. The RNA/DNA ratio in fish under the green light was higher than that in fish under the red light on day 30 and was the highest among treatments on day 60 (p < 0.05). The ratio was lowest in fish under red light on day 60 (Figure 1).
| Parameters | Light spectra | |||
|---|---|---|---|---|
| White | Red | Green | Blue | |
| Survival rate (%) | 100 | 100 | 100 | 100 |
| Final body weight (g) | 145.57 ± 4.08bc | 138.79 ± 1.95c | 160.88 ± 3.41a | 149.49 ± 5.78b |
| Specific growth rate (%) | 2.01 ± 0.09a | 1.96 ± 0.05a | 2.23 ± 0.17a | 2.05 ± 0.16a |
| Daily weight gain (g) | 1.70 ± 0.08b | 1.60 ± 0.03b | 1.98 ± 0.12a | 1.76 ± 0.14ab |
| Feed conversion ratio | 1.16 ± 0.01a | 1.15 ± 0.01a | 1.02 ± 0.00b | 1.16 ± 0.01a |
- Note: Different lowercase letters in each line denote significant difference among treatments at p < 0.05 based on one-way ANOVA.
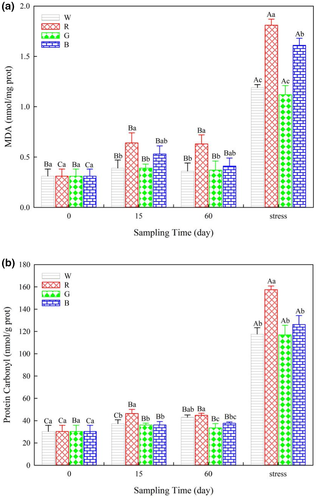
The MDA levels in fish under red light were significantly higher than those in fish under white or green light on days 15 and 60 (Figure 2a). PC levels in the liver were highest in fish under the red light and lowest in fish under the green light on day 60 (Figure 2b). After lowering the water level, MDA and PC levels increased in all treatments (p < 0.05). Moreover, MDA and PC levels in fish under red light were the highest among all of the treatments (Figure 2a,b).
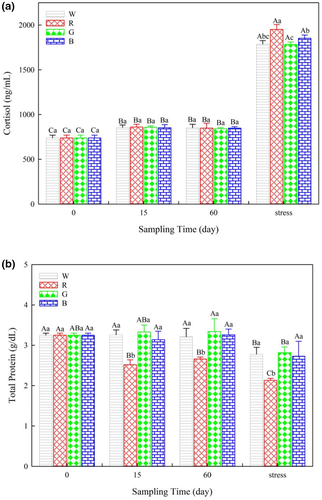
Serum COR levels were not different among the treatments during the 60 days of the study. After lowering the water level, the COR levels increased in all treatments and were highest in fish under red light (Figure 3a). A significant decrease in the TP levels was observed in fish under red light beginning on day 15 of the study. After lowering the water level, the TP levels in fish under red light were the lowest among the treatments (Figure 3b).
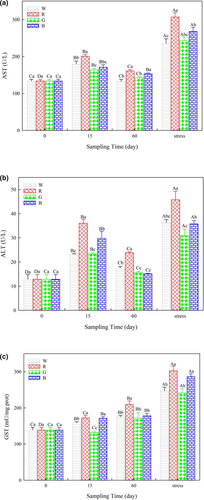
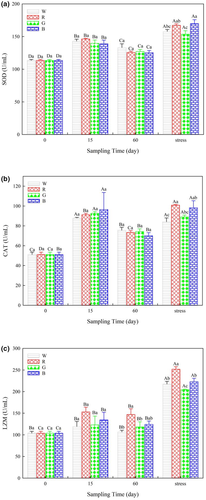
The AST, ALT and GST activities in fish under red light were the highest on day 60. After lowering the water level, the activities of the three transaminases increased in all the treatments (p < 0.05) and were highest in fish under red light (Figure 4a–c). Similarly, the CAT and SOD activities increased first on day 15 and then decreased on day 60 of the study (Figures 4 and 5). Significant increases in CAT, SOD and LZM activities were observed in all the treatments after lowering the water level (p < 0.05).
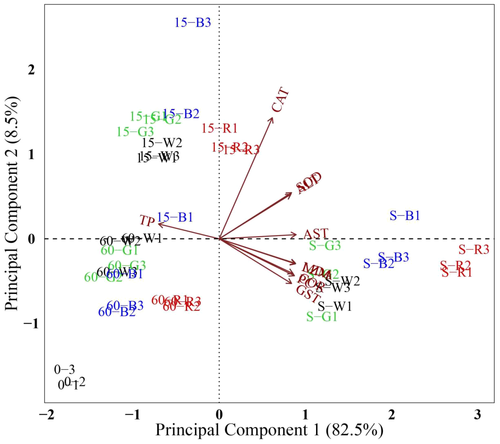
The eigenvalues of the first two principal components (PCs) were 8.25 and 0.85 respectively. A two-dimensional scatterplot was prepared using the first two PCs, which explained 82.46% and 8.54% of the total variability respectively (Figure 6). Fish sampled at the beginning of the study and on days 15 and 60 were well separated based on the second PC, which was mainly related to CAT. Fish sampled after lowering the water level were separated from the other sampling times based on the first PC, which was related to AST, MDA, LZM, PC, COR, GST, SOD and ALT. Fish under red light were well separated from the other treatments at the same sampling time. Fish under green light were distributed furthest from fish under red light on day 15 and after lowering the water level.
The results indicate that fish under red light had lower FBW and RNA/DNA ratios. This finding agreed with the results of a previous study on the same species (Heydarnejad et al. 2013). However, contrary to our results, Karakatsouli et al. (2008), who studied larger fish, reported that red light favoured the growth of the fish. Indeed, the negative effects of relatively longer wavelengths, such as red light, have been reported to inhibit the growth of turbot (Wu et al., 2020) and carp (Cyprinus carpio) (Ruchin et al., 2002). In addition, fish under green light had better growth performance. This is supported by previous studies, indicating that green and blue light promotes the growth of rainbow trout (O. mykiss) (Güller et al., 2020) and the other species, including European sea bass larvae (Villamizar et al., 2009), goldfish (Noureldin et al., 2021) and barfin flounder (Verasper moseri) (Takahashi et al., 2016).
Lipid peroxidation and protein oxidation are assayed by MDA and PC respectively (Jiang et al., 2010). Elevated levels of serum AST and ALT indicate liver damage and dysfunction (Zhu et al., 2016; Meng et al., 2019). GST, which is glutathione-dependent enzyme, counteracts peroxidative damage (Jiang et al., 2010). COR is an indicator of fish stress, and TP represents the energy consumption of the fish (Hoseini et al., 2019). Enzymes, such as LZM, SOD and CAT, comprise the main antioxidant enzyme system of teleost fish to resist the external oxidative stress (Wu et al., 2020). Elevated concentrations of all 10 of these biochemical parameters except TP, which decreased in fish reared under red light, indicate that the fish were stressed. This is in agreement with some previous studies. In rainbow trout, goldfish and Nile tilapia (Oreochromis niloticus), exposure to red light increases COR levels (Volpato and Barreto, 2001; Heydarnejad et al., 2013; Song et al., 2016). An increase of SOD and CAT activities was reported in cinnamon clownfish (Amphiprion melanopus) (Choi et al., 2012) and yellowtail clownfish (A. clarkia) (Shin et al., 2011) reared under red light.
After lowering the water level, the increase in most of the parameters of fish under red light was higher than those of fish under the other light spectra. Additionally, fish under green light were distributed furthest from the fish under red light on day 15 and after lowering the water level (Figure 6). This finding suggests that green light could alleviate the adverse effects of stress. Green and blue light inhibited oxidative stress and enhanced immune function compared with red light in starved cinnamon clownfish (Choi et al., 2012). In another study, green light inhibited oxidative stress and boosted the immune system of goldfish during thermal stress (Jung et al., 2016). Moreover, in our study, AST, ALT, CAT and SOD activities increased first on day 15 and then decreased on day 60. The decreases suggest that O. mykiss may have gradually adapted to the light environment during the experiment.
In conclusion, the results indicate that red light had unfavourable effects on fish growth and physiological status, and green light favoured fish growth. Thus, the results suggest that green light should be used for rainbow trout welfare in far-offshore mariculture.
1 ACKNOWLEDGEMENTS
This work was supported by the National Key Research and Development Program of China (grant number 2019YFD0901000) and the Natural Science Foundation of Shandong Province, China (ZR2020MC194).
2 CONFLICT OF INTEREST
The authors declare that they have no conflict of interests.
AUTHOR CONTRIBUTIONS
Xueqian Sun: Formal analysis, Visualization, Writing original draft, Writing review & editing. Xin Zhao: Conducted the experiment, Data analysis, Writing original draft. Li Li: Project administration; Methodology, Writing review & editing. Qinfeng Gao: Funding acquisition; Resources; Writing review & editing. Shuanglin Dong: Supervision; Conceptulization; Writing review & editing.
3 ETHICAL APPROVAL
Our experimental procedures complied with the current laws on animal welfare and research in China and were specifically approved by the animal welfare and ethics committee of Ocean University of China.
Open Research
DATA AVAILABILITY STATEMENT
The data that support the findings of this study are available from the corresponding author upon reasonable request.


