Reduced dietary protein levels do not impair growth and muscle composition in juvenile red swamp crayfish, Procambarus clarkii (Girard, 1852): Implications for pond culture in China
Funding information
This study was financially supported by the National Key Research and Development Program of China (Grant No. 2019YFD0900703) and the Technical Innovation Project of Science and Technology Department of Hubei Province (Grant No. 2018ABA102 and 2016ABA123).
[Correction added on 7 December 2021, after first online publication: affiliations have been reordered in this version.]
Abstract
High dietary protein input in aquaculture leads to suboptimal growth and increased production costs. Limited knowledge on dietary protein requirements of Procambarus clarkii in pond culture has hindered the scientific expansion of optimum feeding strategies. We evaluated the effects of reduced dietary protein levels (from 30% to 26%) on the growth performance (weight, length, GSI, HSI, SGRw, SGRL and muscle weight) and muscle composition (crude protein, lipid, ash and moisture) of juveniles in eight concrete ponds cultured with Hydrilla verticillata. No significant differences were observed in the growth performance between the two treatments. P. clarkii fed a diet containing 26% protein had significantly higher crude protein and ash contents, whereas no significant differences existed in the lipid contents. The δ13C and δ15N values of P. clarkii and its food resources were not significantly affected by dietary protein levels. However, the Bayesian mixing model identified the mean contribution of H. verticillata in P. clarkii growth increased from 37.34% to 41.93% when dietary protein levels decreased from 30% to 26%. Considering the significant contribution of natural foods, we encourage the reduction in dietary protein levels from 30% to 26% in ponds to further reduce the production costs.
1 INTRODUCTION
Artificial foods form the main diet of cultured crayfish, accounting for higher than 50% of the total aquaculture costs (Keckeis & Schiemer, 1992; Wong et al., 2016). As a primary component in diet formulation, proteins are one of the most expensive components strongly influencing diet prices (Huner & Meyers, 1979). Optimal dietary protein levels ensure crayfish growth, maintenance, tissue repair and an optimal health status (Teles et al., 2020). Conversely, an excess in dietary protein inputs leads to water deterioration, pathogenic microorganisms, and fish or crayfish hypoxia or even death (Chávez-Crooker & Obreque-Contreras, 2010), resulting in economic losses and major waste issues (Craig et al., 2017; Henry & Fountoulaki, 2014; Martinez-Cordova et al., 2003; Velazco-Vargas et al., 2014). Higher than 80% of production loss occurs with white spot syndrome virus infections (Chen et al., 1997; Du et al., 2007; Zhan et al., 1998), and outbreaks of diseases are highly related to the organic and nutrient loadings in culture systems (Navarro-Barrón et al., 2019). Despite efforts to improve water management and disease surveillance, economic losses related to disease outbreaks in aquaculture have been estimated at over US 9.5 billion dollars per year (Shinn et al., 2015). However, the whole aquaculture industry has low nutrition utilization efficiency, which was estimated at 11.7%–27.7% and 8.7%–21.2% for nitrogen and phosphorous respectively (Zhang et al., 2015). Sahu et al. (2013) also demonstrated that only 10.44% of phosphorous, 36.85% of nitrogen and 16.34% of organic carbon are recovered in the fishery product biomass. This suggests that reducing dietary nutrient inputs should be a priority to reduce aquaculture waste, potential eutrophication and economic losses (Cho & Bureau, 2001; Person, 1991).
The protein requirements of numerous crustacean species have been extensively researched under laboratory-controlled conditions, which were 25.6% for the crayfish Cherax quadricarinatus (Cortés-Jacinto et al., 2004), 30% for crayfish Astacus leptodactylus (Ghiasvand et al., 2012), 35% for prawn Macrobrachium carcinus (Benítez-Mandujano & Ponce-Palafox, 2014), 40%–45% for the crayfish Pacifastacus leniusculus (Fuertes et al., 2012), 51.5% for the crab Portunus trituberculatus (Jin et al., 2013) and 60% for the shrimp Fenneropenaeus merguiensis (Tendulkar & Kulkarni, 2011). However, few studies have estimated the actual dietary protein demands under practical culture conditions, with some evidence suggesting that dietary protein levels could be reduced because natural foods provide supplementary proteins (Cardona et al., 2015; Duffy et al., 2011). For instance, Duffy et al. (2011) demonstrated C. destructor achieved acceptable growth when fed a diet containing a 19% protein level because of the additional nutrition provided in natural foods. Xu and Pan (2014) found that dietary protein levels can be reduced from 35% to 25% without affecting the survival rate, growth, feed conversion efficiency, and physiological status in the immune response and antioxidant capability of Litopenaeus vannamei due to the addition of biofloc. These studies suggest efforts should be made to optimize the dietary nutrient inputs to maintain the sustainability and productivity of crayfish aquaculture systems (Hasan, 2000).
The red swamp crayfish (Procambarus clarkii) originates from northeastern Mexico and south-central United States. In the wild, the red swamp crayfish is omnivorous, consuming macrophytes, detritus, periphyton, benthos, plankton and microbially enriched detritus (Alcorlo et al., 2004; Correia, 2003; Gutierrez-Yurrita et al., 1998; Li et al., 2012). Due to its high adaptability and rapid growth, P. clarkii has become a most noteworthy freshwater species, both commercially and academically. Its annual production has reached 1,711,300 tons, accounting for 18.23% of the total crustacean aquaculture production worldwide (FAO, 2020). Without a doubt, the aquaculture of P. clarkii will continue to play an important role in the national fishery supply into the future. Previous research has evaluated the optimal dietary protein levels (26%–30%) of juvenile P. clarkii under laboratory-controlled conditions (Jover et al., 1999; Ling et al., 2012; Wu et al., 2007; Xu, Liu, et al., 2013; Zhang et al., 2012). However, the results of these studies are not directly relevant to culture conditions since P. clarkii also derives a substantial part of its nutrition from natural foods (Alcorlo et al., 2004; Correia, 2003; Gutierrez-Yurrita et al., 1998). Little information exists on their dietary protein requirements under practical pond culture conditions.
This study aims to (1) investigate the effects of reduced dietary protein levels on the growth performance and muscle composition of juvenile P. clarkii and (2) quantify the contributions of artificial diet and the macrophyte H. verticillata to crayfish growth under reduced dietary protein levels. This study explores scientific feeding strategies to minimize feed waste and production costs while maintaining aquaculture production to improve the economic success and sustainability of P. clarkii aquaculture in China.
2 MATERIALS AND METHODS
2.1 Experimental design
Juvenile P. clarkii (4.82 ± 0.15 g, 60.03 ± 0.52 mm, mean ± SE) were obtained from ponds at the Selection and Reproduction Center of Crayfish, Qianjiang, Hubei Province, China. A 50-day feeding experiment was conducted in eight experimental concrete ponds (90 juveniles per pond of 9 m2), which followed the National Institutes of Health guide for the care and use of Laboratory Animals (NIH Publications No. 8023, revised 1978). There were four replicate ponds for the two treatments (26% and 30% protein levels). The experimental crayfish were acclimated to the culture conditions for one week before the experiment. At the beginning of the experiment, healthy juveniles were collected and randomly allocated to 8 concrete ponds. Throughout the whole experimental period, water flow rates in ponds were approximately 7 L/min with constant aeration. Water depth was maintained at approximately 27 cm, and H. verticillata was planted in 35 polyethylene flowerpots (0.44 m diameter) which served as both shelters and foods with coverage of approximately 60% in each pond. The water temperature, pH and dissolved oxygen (DO) were measured by a YSI probe (Yellow Springs Instruments), which were 27.27 ± 1.06°C, 9.3 ± 0.05 and 4.33 ± 0.70 mg/L throughout the study. The concentrations of ammonia nitrogen, nitrite, chemical oxygen demand, total nitrogen, total phosphorus and chlorophyll-a were determined using standard methods (APHA (American Public Health Association), 1992). Specifically, ammonia nitrogen was 0.1700 ± 0.015 mg/L, with 0.0412 ± 0.002 mg/L for nitrite, 1.2009 ± 0.020 mg/L for total nitrogen, 0.0345 ± 0.017 mg/L for total phosphorus, 7.1347 ± 0.100 mg/L for chemical oxygen demand and 17.6489 ± 0.440 μg/L for chlorophyll-a respectively.
2.2 Feeding management
Throughout the experiment, crayfish were fed twice daily (8:00 and 18:00). For each feeding practice, the experimental diets were put into a plastic pallet (30 × 15 cm), a diagram of which was described in our previous study (Jin et al., 2019). Crayfish were fed with an excess weighted diet. Two diets (containing 26% and 30% protein levels) were chosen based on the existing knowledge of dietary requirements of P. clarkii. The experimental diets followed common commercial diet formulation from Charoen Pokphand Group (WHS001-2016). They were designed specifically for crayfish, differing in protein levels (Table 1). Ingredients were ground and sieved with a 60-mesh screen, and then completely mixed and made into 2-mm pellets. The diets were dried at 45°C by an air flux oven (Yiheng DHG-9030) and stored at −20°C. After their feeding activities stopped within one hour, the remaining diet was removed, dried and reweighted (Van Ham et al., 2003). The amount of diet consumed by crayfish was calculated. The experiment lasted 50 days.
| Ingredients | Diet 1 (%) | Diet 2 (%) |
|---|---|---|
| Fish meala | 0.5 | 2 |
| Rapeseed mealb | 15 | 10 |
| Soybean mealb | 25 | 25 |
| Cottonseed mealb | 10 | 11 |
| Wheat flourc | 20 | 20 |
| DDGSc | 18 | 18 |
| Soybean oild | 2 | 2 |
| Vitamin premixe | 0.1 | 0.1 |
| Mineral premixe | 0.5 | 0.5 |
| Ca(H2PO4)2 | 0.5 | 0.5 |
| Sodium chloride | 1 | 1 |
| Cellulose | 3.9 | 6.4 |
| Binder | 3.5 | 3.5 |
| Proximate composition | ||
| Crude protein | 26.53 | 30.23 |
| Crude lipid | 10.41 | 10.74 |
| Ash | 6.87 | 8.7 |
| Moisture | 13.96 | 10.18 |
- a Fish meal was from Qingdao Great Seven Co., Ltd., Shandong, China.
- b Rapeseed meal, soybean meal and cottonseed meal were purchased from Jiangxi Zhengbang Tech, Jiangxi, China.
- c Wheat flour and DDGS were from Wuhan Yufeng Cereals, Oils and Foodstuffs Industrial, Hubei, China.
- d Soybean oil was from Handan Mingfu Vegetable Oil Company, Hebei, China.
- e Vitamin and mineral premix were purchased from Haid Feeds Co., Ltd., Guangzhou, China.
2.3 Sample collection
All crayfish were starved for 24 h and then collected for growth performance parameters measurement at the end of the experiment. Twelve male crayfish and twelve female crayfish of each pond (48 crayfish for each treatment totally) were randomly sampled and stored at −20°C for muscle composition analysis after chill-killed using the ice-water bath. Furthermore, samples of eight individuals from each treatment were also chill-killed and maintained for stable isotope analysis.
2.4 Growth performance


2.5 Muscle composition analysis
Samples of crayfish abdominal muscle and artificial diets were analysed for protein, lipid, moisture and ash contents. Protein content was determined using the Kjeldahl method (N × 6.25) (William, 1980) with a 4800 Kjeltec Auto Analyzer (FOSS Tecator, Haganas). Lipid content was determined by chloroform–methanol extraction (Folch et al., 1957). Moisture content was determined by placing a 1-g sample into a convection oven (105°C) for 2 h and drying it to constant weight (William, 1980). Ash content was determined by placing a 1-g sample combusting at 550°C in a muffle furnace for approximately 10 h (William, 1980).
2.6 Stable isotope analysis


2.7 Statistical analyses
The variations in the survival rates between the two treatments were analysed using pairwise permutation tests. Student's t tests were used to analyse the variations in other growth parameters (W, L, GSI, HSI, SGRW, SGRL and muscle weight), muscle composition, and crayfish δ13C and δ15N values between the two treatments. The Kruskal–Wallis test was used to analyse the differences in δ13C and δ15N values between the two experimental diets and H. verticillata. Growth performance parameters were analysed using principal component analysis (PCA). For the stable isotope data, we calculated the contributions of the experimental diets and the H. verticillata to crayfish growth using the ‘SIAR’ package in R. All analyses were performed using R (version 3.3.2, R Core Team, 2017), and the significance level was set to 0.05 (p < 0.05).
3 RESULTS
3.1 Growth performance
The growth parameter results of the males and females are provided in Table 2 and Data S1. The survival rates were 84.45% (26% dietary protein level) and 70.56% (30% dietary protein level). There were no significant differences between the two treatments (Student's t test, t = 2.06, p = 0.09).
| Parameters | Treatments | |
|---|---|---|
| 26% protein level | 30% protein level | |
| Survival rate (%) | 84.45 ± 3.77 | 70.56 ± 5.60 |
| Males | ||
| W (g)a | 25.29 ± 1.23 | 23.34 ± 0.94 |
| L (mm)b | 87.52 ± 1.49 | 84.37 ± 1.07 |
| GSI (%)c | 0.071 ± 0.013 | 0.051 ± 0.007 |
| HSI (%)d | 7.79 ± 0.35 | 7.91 ± 0.23 |
| SGRW (%, day−1)e | 3.28 ± 0.10 | 3.12 ± 0.08 |
| SGRL (%,day−1)a | 0.75 ± 0.0.03 | 0.68 ± 0.03 |
| Muscles weight (g) | 2.09 ± 0.10a | 1.80 ± 0.07b |
| Females | ||
| W (g) | 22.79 ± 1.37 | 21.66 ± 0.69 |
| L (mm) | 90.46 ± 2.03 | 90.00 ± 0.89 |
| GSI (%) | 0.38 ± 0.035 | 0.34 ± 0.039 |
| HSI (%) | 9.89 ± 0.15 | 10.05 ± 0.29 |
| SGRW (%,day−1) | 3.06 ± 0.12 | 2.98 ± 0.06 |
| SGRL (%,day−1) | 0.81 ± 0.04 | 0. 81 ± 0.02 |
| Muscles weight (g) | 2.38 ± 0.11 | 2.37 ± 0.06 |
Note
- Values in the same row sharing the same superscript are not significantly different (p > 0.05).
- a W: final weight (g).
- b L: final length (mm).
- c GSI: gonadosomatic index (%) = 100 × (gonad weight, g)/(final weight, g).
- d HSI: hepatosomatic index (%) = 100 × (liver weight, g)/(final weight, g).
- e SGRW: specific growth for weight (%/day) = 100 × [ln(final weight)−ln(initial weight)]/experimental days.
- f SGRL: specific growth for length (%/day) = 100 × [ln(final length)−ln(initial length)]/experimental days.
The male P. clarkii fed the 26% dietary protein level had significantly higher muscle weight than those fed the 30% dietary protein level (Student's t test, t = 2.30, p = 0.03). The male P. clarkii had no significant differences in W, L, GSI, HSI, SGRW and SGRL between the two treatments (Student's t test, p > 0.05). Similarly, the female P. clarkii had no significant differences in all parameters (W, L, GSI, HSI, SGRW, SGRL and muscle weight) between the two treatments (Student's t test, p > 0.05).
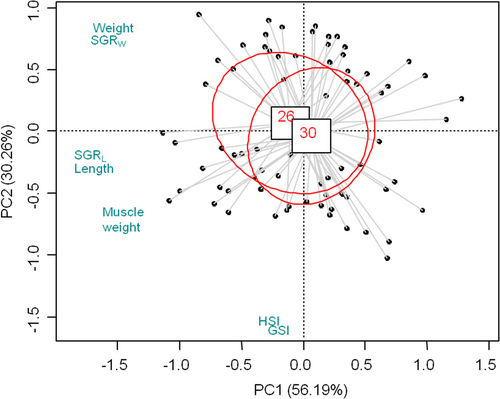
PCA revealed no significant differences in all the growth parameters of both sexes between the two treatments (Figure 1). Specifically, PC1 included W, L, SGRW, SGRL and muscle weight, and explained 56.19% of the variance among samples. PC2 mainly separated females and males into two groups by GSI and HSI, explaining 30.26% of the variance. The two components accounted for 86.44% of the total variance. Taking both sexes into consideration, Figure 1 illustrated that crayfish fed a 26% dietary protein level had no significant differences in all growth parameters when compared with those a 30% dietary protein level. This result indicated reduced dietary protein levels from 30% to 26% did not impair the growth performance of juvenile P. clarkii.
3.2 Muscle composition
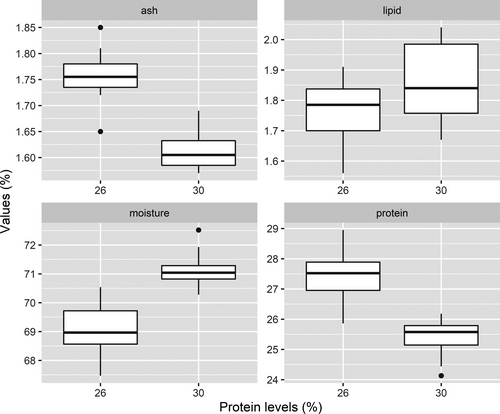
The ash, lipid, moisture and protein contents in P. clarkii muscles from the two different treatments are provided in Figure 2 and Data S2. P. clarkii fed the 26% dietary protein level had significantly higher protein and ash contents than the crayfish fed the 30% dietary protein level (Student's t test, p < 0.001). Conversely, the moisture content within the P. clarkii had the opposite trend, and it was significantly lower in P. clarkii fed the 26% dietary protein level (Student's t test, p < 0.001). The P. clarkii fed the 30% dietary protein level had higher lipid content than those fed the 26% dietary protein level, but the difference was not statistically significant between the two treatments (Student's t test, p = 0.17).
3.3 Stable isotope analysis
The carbon and nitrogen stable isotope ratios (δ13C and δ15N, Data S3) in P. clarkii and the food resources are provided in Figures 3 and 4 respectively. The δ13C values in P. clarkii ranged from −22.87 ‰ to −19.12 ‰, with no significant differences observed between the two treatments (Student's t test, p > 0.05). The δ13C values in the food resources were −21.18 ‰ to −20.5 ‰ for experimental Diet 1 (26% protein level), −21.24 ‰ to −19.2 3‰ for experimental Diet 2 (30% protein level) and −26.58‰ to −23.07‰ for H. verticillata. The δ13C values of the H. verticillata were significantly lower than those of the experimental diets (Kruskal–Wallis test, p < 0.05). The δ15N values of P. clarkii ranged from 4.34 ‰ to 5.66 ‰, with no significant differences observed between crayfish in the two treatments (Student's t test, p > 0.05). H. verticillata had significantly lower δ15N values (1.92 ‰–3.46 ‰) than the two experimental diets (Kruskal–Wallis test, p < 0.05), which were 4.25 ‰–4.3 ‰ for diet 1 and 4.91 ‰–5.05 ‰ for diet 2 respectively.
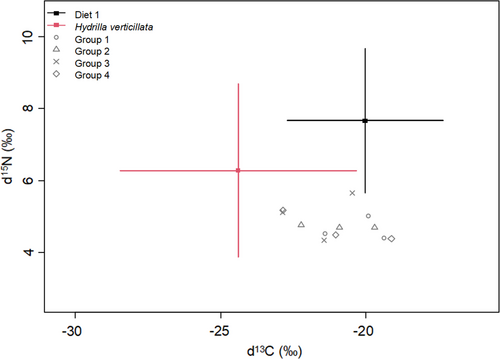
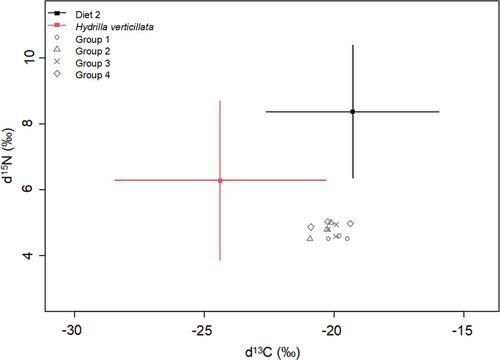
The isotopic Bayesian mixing model estimated the relative contributions of the food resources (diet 1, diet 2 and H. verticillata) to tissue growth in P. clarkii. Results identified the artificial diet was the main food consumed by P. clarkii in both treatments (mean contribution: 58.07% for diet 1 and 62.66% for diet 2, Table 3). However, when the dietary protein levels decreased from 30% to 26%, the mean contribution of H. verticillata increased from 37.34% to 41.93%. This result indicates the diet of P. clarkii shifted from the artificial diet to the easily available H. verticillata when the dietary protein levels in the artificial feed decreased.
| Treatments | Replicates | Foods contributions (%) | |
|---|---|---|---|
| Artificial diet | Hydrilla verticillata | ||
| 26% | 1 | 66.34 (22.60–100) | 33.66 (0–77.34) |
| 2 | 59.17 (18.52–98.92) | 40.83 (1.08–81.49) | |
| 3 | 52.10 (13.13–90.49) | 47.90 (9.51–86.87) | |
| 4 | 54.65 (10.85–96.99) | 45.35 (3.01–89.15) | |
| 30% | 1 | 65.62 (25.37–100) | 34.38 (0–74.63) |
| 2 | 60.25 (23.68–98.30) | 39.75 (1.70–76.32) | |
| 3 | 63.61 (24.87–100) | 36.39 (0–75.13) | |
| 4 | 61.15 (19.11–100) | 38.85 (0.06–79.89) | |
4 DISCUSSION
4.1 Effects of dietary protein levels on growth performance of P. clarkii
Reducing the dietary protein level from 30% to 26% did not significantly affect growth performance in crayfish. In this situation, feeding P. clarkii with a dietary protein level of 26% ensured successful crayfish production with reduced production costs. Previous numerous laboratory experiments could not consider the contributions of natural foods and still confirmed the growth of P. clarkii did not benefit from high dietary protein levels. For instance, juvenile P. clarkii exhibited the highest growth rate when fed a diet with a 27% protein level (Wu et al., 2007). Other researches have suggested that optimal dietary protein levels are 26% – 30% for juvenile P. clarkii (Jover et al., 1999; Ling et al., 2012; Wu et al., 2007; Xu, Liu, et al., 2013; Zhang et al., 2012). Similar results have also been found in other species such as Macrobrachium americanum (Méndez-Martínez et al., 2017), Ctenopharyngodon idella (Xu et al., 2016), C. quadricarinatus (Cortés-Jacinto et al., 2003), M. carcinus (Benítez-Mandujano & Ponce-Palafox, 2014) and L. vannamei (Shahkar et al., 2014). All of these studies showed that an excessive input of dietary protein had negative effects on the growth of the cultured organisms.
For intensive aquaculture operations, artificial diets can exceed 50% of the production costs (Keckeis & Schiemer, 1992; Wong et al., 2016), and the diet cost highly depends on the proportion of protein. To provide crayfish at desirable market sizes in the shortest timeframe, farmers feed crayfish diets high in protein. However, high protein inputs in culture systems cause water pollution, low dissolved oxygen levels, and decreased efficiency in food absorption and impact immune systems, resulting in huge economic losses (Craig et al., 2017; Henry & Fountoulaki, 2014; Martinez-Cordova et al., 2003; Velazco-Vargas et al., 2014). Considering the similar production potential by the two treatments in the current study, we suggest reducing the dietary protein levels from 30% to 26% to maintain aquaculture production at a minimum economic loss. This change not only brings numerous benefits to farmers but is also the key to improving the economic and environmental sustainability of P. clarkii culture.
4.2 Effects of dietary protein levels on muscle composition of P. clarkii
The results of muscle composition analysis showed the P. clarkii fed the 26% protein diet had significantly higher crude protein and ash contents than those fed the 30% protein diet. However, dietary protein levels did not significantly influence the lipid content within the crayfish muscles. This result suggests reducing the dietary protein level to 26% would not negatively impact crayfish muscle composition. Furthermore, crude protein content in the crayfish muscles tended to decrease with the increased dietary protein level. This result supports previous research on the crayfish Astacus leptodactylus (Ghiasvand et al., 2012) and crab Portunus trituberculatus (Jin et al., 2013). However, not all previous researches support the same. Some studies found that muscle crude protein content tended to increase with an increase in dietary protein levels in P. clarkii (Li, 2012; Yu, 2011), C. quadricarinatus (Pavasovic et al., 2007) and M. americanum (Méndez-Martínez et al., 2017). Other studies demonstrated that dietary protein levels had no significant effect on muscle composition in P. clarkii (Ling et al., 2012), C. quadricarinatus (Thompson et al., 2004), M. carcinus (Benítez-Mandujano & Ponce-Palafox, 2014), L. vannamei (Hu et al., 2008) and M. nipponense (Zhang et al., 2017).
We identified the crude lipid content was not significantly affected by dietary protein levels, which was in agreement with previous research on P. trituberculatus (Huo et al., 2014) and C. quadricarinatus (Thompson et al., 2004). However, our results disagreed with previous studies in P. clarkii (Li, 2012; Su et al., 2009; Xu, Liu, et al., 2013), A. leptodactylus (Ghiasvand et al., 2012), P. trituberculatus (Jin et al., 2013), M. carcinus (Benítez-Mandujano & Ponce-Palafox, 2014), M. nipponense (Zhang et al., 2017) and M. americanum (Méndez-Martínez et al., 2017). In our study, the ash and moisture contents had an opposite tendency with an increase in the dietary protein level. In contrast, most studies found no significant differences in the ash and moisture contents with increasing dietary protein levels (Catacutan, 2002; Ghiasvand et al., 2012; Hu et al., 2008; Huo et al., 2014; Jin et al., 2013; Méndez-Martínez et al., 2017; Wu et al., 2007; Zhang et al., 2017). Many factors could be responsible for the different muscle compositions within cultured organisms. For instance, the protein, lipid and ash contents are size-dependent and can also be affected by the life stage and energy intake of the organism (Shearer, 1994). The different diet formulations also had significant effects on muscle composition. For instance, Shearer (1994) proved that diets containing energy from carbohydrates produced higher body protein levels than diets containing the same level of energy produced from lipids. In addition, other natural foods such as detritus, phytoplankton, benthos and zooplankton would also affect body composition in practical culture systems. For instance, Lei et al. (2013) demonstrated that fish feeding on phytoplankton and zooplankton had higher levels of polyunsaturated fatty acids. Therefore, our results indicate that feeding crayfish with high dietary protein levels is unnecessary because crayfish derive a substantial part of their dietary requirements from natural foods in the culture system. We also conclude that a high dietary protein input during farming is not the best feeding strategy for P. clarkii.
4.3 Natural foods contributions and implications for sustainable aquaculture
In this study, the stable isotope analysis showed that H. verticillata was an important component of P. clarkii diets, and contributed 37.34% and 41.93% when crayfish were fed artificial dietary protein levels of 30% and 26% respectively. The results confirm our hypothesis that a reduction in the dietary protein levels does not negatively influence the growth and muscle composition in P. clarkii because of the natural supplementary nutrition available from H. verticillata. In addition to H. verticillata, other natural foods also contribute to the growth of P. clarkii, such as benthic detritus, sediment, planktonic, zooplankton and invertebrates (Alcorlo et al., 2004; Grey & Jackson, 2012; Gutierrez-Yurrita et al., 1998; Huner, 1981; Kreider & Watts, 1998). Similar results have been identified in other crayfish. For instance, in semi-intensive pond cultures of C. quadricarinatus, the contribution of natural plants to crayfish growth can be as high as 44% (Joyce & Pirozzi, 2016). For Paranephrops zealandicus, terrestrial detritus constitutes up to 58.3% of its stomach contents (Hollows et al., 2002). These results also highlight the benefits of natural foods that contribute to crayfish growth, potentially reducing production costs.
4.4 Implications of reduced dietary protein levels for sustainable aquaculture
At the management level, reducing the dependence on high dietary protein inputs in farming systems and maximizing the utilization of natural foods as alternative food sources is of high significance to further reduce production costs (especially feed costs) to aquaculture profitability (Tacon, 1997). The nutritional and economic importance of natural foods has been well recognized in the culture of many crustacean species, increasing both pond productivity and yield. For example, previous studies on C. destructor and L. stylirostris have demonstrated the growth-enhancing effects of natural foods in ponds, which contribute 28%–79% and 37%–40% of their growth, reducing artificial diet costs (Cardona et al., 2015; Duffy et al., 2011). Similar results have also been reported in L. vannamei (Gamboa-Delgado et al., 2011; Porchas-Cornejo et al., 2012; Roy et al., 2012; Xu, Liu, et al., 2013), Farfantepenaeus brasiliensis (Emerenciano et al., 2012), C. quadricarinatus (Viau et al., 2012), M. rosenbergii (Correia et al., 2003), L. stylirostris (Cardona et al., 2015) and Marsupenaeus japonicus (Arapi et al., 2012). All these studies support that maximizing the use of natural foods in the overall nutritional budget of pond-cultured crayfish not only improve crustacean species growth but also greatly reduce production costs. It is important for farmers to focus on managing the naturally available foods in ponds to maximize production profits. As the artificial food involves large production costs, further studies should be encouraged to assist in the utilization of natural foods and explore sustainable feeding strategies.
5 CONCLUSION
Reducing dietary protein levels while maintaining aquaculture production is crucial for improving the economic success and sustainability of the P. clarkii culture industry. Our study suggests that reducing dietary protein levels from 30% to 26% did not impair the growth performance and muscle composition of P. clarkii. Furthermore, results from the Bayesian mixing model showed that the mean contribution of H. verticillata increased from 37.34% to 41.93% when the dietary protein levels were decreased from 30% to 26%. The results suggest a shift in the P. clarkii diet towards the easily available H. verticillata when provided an artificial diet with decreased dietary protein levels. There are numerous natural foods (e.g. detritus, periphyton, benthos and plankton) that could also provide additional nutrition for P. clarkii in practical culture. Therefore, further studies to evaluate the contributions of natural foods should be encouraged.
ACKNOWLEDGEMENTS
This study was financially supported by the National Key Research and Development Program of China (Grant No. 2019YFD0900703) and the Technical Innovation Project of Science and Technology Department of Hubei Province (Grant No. 2018ABA102 and 2016ABA123). The authors would like to acknowledge Prof. Xiaoming Zhu, Prof. Dong Han and Si Luo for their technical assistance in the experiment. We also gratefully acknowledge the great help of Sovan LEK, Jing Qian and Yuan Ting. The infrastructure support of the Selection and Reproduction Center of Crawfish is also acknowledged.
CONFLICT OF INTEREST
None. The funding sponsors had no roles in the design of the study; in the collection, analysis or interpretation of data; in the writing of the manuscript, nor in the decision to publish the results.
AUTHOR CONTRIBUTIONS
Shiyu Jin and Tanglin Zhang conceived and designed the investigation. Shiyu Jin conducted the test. Shiyu Jin, Xiangsong Li and Lisa Jacquin drafted the initial manuscript and latter revision. Jiashou Liu contributed to the data analysis. Wei Li and Tanglin Zhang provided guidance for data analysis and critical feedback on the manuscript and approved the final manuscript.
ETHICAL APPROVAL
This study was followed the National Institutes of Health guide for the care and use of Laboratory Animals (NIH Publications No. 8023, revised 1978).
DECLARATIONS OF SUBMISSION
All authors approved the authorship and submission of the manuscript for peer review. The authors confirm that this manuscript has not been published and is not currently under consideration by any other journals.
PATIENT CONSENT STATEMENT
This study did not involve in patient.
PERMISSION TO REPRODUCE MATERIAL FROM OTHER SOURCES
No.
CLINICAL TRIAL REGISTRATION
Not involved.
Open Research
DATA AVAILABILITY STATEMENT
The authors confirm that the data supporting the findings of this study are available within the Supporting information.


