cGMP-dependent kinase 2, Na+/H+ exchanger NHE3, and PDZ-adaptor NHERF2 co-assemble in apical membrane microdomains
Min Luo and Yongjian Liu contributed equally to this work.
Abstract
Aim
Trafficking, membrane retention, and signal-specific regulation of the Na+/H+ exchanger 3 (NHE3) are modulated by the Na+/H+ Exchanger Regulatory Factor (NHERF) family of PDZ-adapter proteins. This study explored the assembly of NHE3 and NHERF2 with the cGMP-dependent kinase II (cGKII) within detergent-resistant membrane microdomains (DRMs, “lipid rafts”) during in vivo guanylate cycle C receptor (Gucy2c) activation in murine small intestine.
Methods
Small intestinal brush border membranes (siBBMs) were isolated from wild type, NHE3-deficient, cGMP-kinase II-deficient, and NHERF2-deficient mice, after oral application of the heat-stable Escherichia coli toxin (STa) analog linaclotide. Lipid raft and non-raft fractions were separated by Optiprep density gradient centrifugation of Triton X-solubilized siBBMs. Confocal microscopy was performed to study NHE3 redistribution after linaclotide application in vivo.
Results
In the WT siBBM, NHE3, NHERF2, and cGKII were strongly raft associated. The raft association of NHE3, but not of cGKII, was NHERF2 dependent. After linaclotide application to WT mice, lipid raft association of NHE3 decreased, that of cGKII increased, while that of NHERF2 did not change. NHE3 expression in the BBM shifted from a microvillar to a terminal web region. The linaclotide-induced decrease in NHE3 raft association and in microvillar abundance was abolished in cGKII-deficient mice, and strongly reduced in NHERF2-deficient mice.
Conclusion
NHE3, cGKII, and NHERF2 form a lipid raft-associated signal complex in the siBBM, which mediates the inhibition of salt and water absorption by Gucy2c activation. NHERF2 enhances the raft association of NHE3, which is essential for its close interaction with the exclusively raft-associated activated cGKII.
1 INTRODUCTION
Na+/H+ exchanger NHE3 (Slc9a3) is a key transporter in the regulation of salt and water absorption in the intestine.1 A variety of neurotransmitters, endocrine, paracrine, and luminocrine hormones stimulate an increase in luminal fluidity by inhibiting NHE3 activity, often in parallel with a stimulation of the CFTR anion conductance.2 Bacterial enterotoxins use these signaling pathways to activate the same downstream targets, thereby eliciting diarrhea.3 A logical consequence from a better understanding of the molecular mechanisms behind pathogen-induced intestinal fluid loss is the assumption that an interference with these signaling events may stop the fluid loss.2 However, so far no pharmacological strategies to curb enterotoxin-induced intestinal fluid loss have been FDA approved.
One highly prevalent and particularly fascinating diarrheal agent is the heat-stable Escherichia coli enterotoxin STa, the most frequent causal agent for travelers' diarrhea, an extremely frequent event during international travel.4 This enterotoxin binds to and activates the receptor kinase guanylate cyclase C (Gucy2c) in the enterocyte brush border membrane, thus mimicking the downstream effects of the endogenous guanylins.5 Gucy2c knockout mice are resistant to the diarrheal effects of STa,6, 7 and pharmacological Gucy2c inhibitors also reduce STa-induced chloride channel activation,8 suggesting that this strategy may be successful in the treatment of acute enterotoxic E. coli-induced diarrhea, as well as in treating the rare congenital secretory diarrhea caused by activating Gucy2c mutations.9, 10 However, as hypothesized early by Garbers and colleagues6, experimental and clinical evidence is accumulating that the guanylin-guanylate cyclase C axis is an important regulator of intestinal health.11, 12
In a search for more selective treatment strategies, others and we explored the signaling mechanisms downstream of guanylate receptor activation. The cGMP-dependent protein kinase II (cGKII) was recognized as the predominant effector kinase for apical chloride channel activation,13 as well as for the inhibition of the apical Na+/H+ exchanger NHE3, in the murine small intestine.14
The trafficking, membrane retention, and interaction of CFTR and NHE3 with other proteins is regulated by the NHERF (SLC9A3R) family of PDZ adaptor proteins.15 Surprisingly, the effect of Gucy2c activation on CFTR stimulation was modulated by the presence of NHERF1,16, 17 whereas its effect on NHE3 inhibition required the presence of the NHERF2, both in heterologous expression systems,18 as well as in murine intestine.17, 19
The dependency of Gucy2c-mediated NHE3 inhibition on NHERF2 is surprising, because it is far less abundant in the small intestinal epithelium than its homologues NHERF1 and NHERF3-5, which also bind to and regulate NHE3 activity.20-23
An additional aspect of NHE3 regulation is the membrane lipid environment, and the association of NHE3 with cholesterol and sphingolipid-enriched membrane rafts “lipid rafts.”24-26 Interestingly, the NHERFs associate differentially with the lipid raft and the non-raft fraction of the brush border membrane, with NHERF2 being highly raft-associated, whereas NHERF1 and NHERF3 are not.27
In this study, we addressed the question whether the cGKII may be targeted to membrane microdomains in the small intestinal brush border membrane, and whether this association is altered by guanylate cyclase activation. We also wanted to know whether the lipid raft association of NHERF2 may facilitate an interaction between NHE3 and cGKII. We, therefore, gavaged nhe3−/−, nherf2−/−, and cgkII−/−, and their respective WT littermates, with the Gucy2c agonist linaclotide, harvested the small intestine at defined time points after gavage, isolated the siBBM, separated the detergent-resistant (DRM) and detergent-soluble fractions of the siBBM by gradient centrifugation, and studied the lipid raft and non-raft-associated proteins by Western Blot analysis. As another method of studying Gucy2c-induced NHE3 trafficking, the shift of the NHE3 immunofluorescence along the microvillar axis, the terminal web region, and intracellular pools was assessed by confocal microscopy.
2 RESULTS
2.1 Antibody specificity
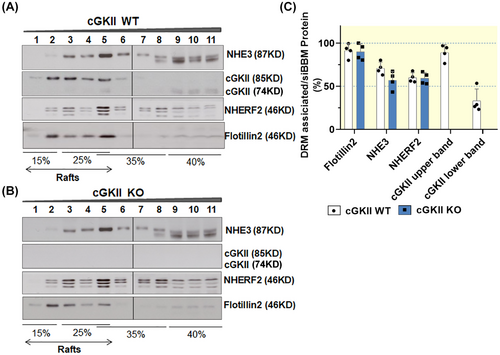
The specificity of anti-NHE3 and anti-cGKII antibodies was tested by Western Blot analysis of siBBM isolated from nhe3−/− and cgkII−/− mice and their respective WT littermates. The results are shown in Figure 1. Anti-NHE3 antibody detected a band of ~87 KD in siBBM of WT mice, which was completely absent in nhe3−/− siBBM (Figure 1A). In the nhe3−/− siBBM, a broad band appeared at a lower size (~72 KD), which is non-specific and will also appear at long exposure times in WT siBBM (Figure 1A, see also Figures 3 and 4). In addition, with longer exposure a faint band appeared in the nhe3−/− siBBM in the same size range than the NHE3 band in the WT (~87 KD), indicating that a 100% separation of specific and non-specific signals is not possible. The anti-cGKII antibody detects two bands in the siBBM from WT mice, a larger band of ~85 KD and a smaller band of ~74 KD, both of which are absent in the siBBM from the cgkII−/− mice, therefore, both represent cGKII entities (Figure 1B).

2.2 NHE3, NHERF2, and the upper band of cGKII co-assemble in lipid rafts in murine siBBM
As described in the method section, the detergent-resistant (“lipid raft”) associated proteins were identified in a “floatation assay.” The detergent solubilized siBBM was mixed with Optiprep to a final concentration of 40% and placed at the bottom of a step gradient for ultracentrifugation. As lipid rafts are detergent-resistant membrane domains with light density, lipid rafts will float to the lighter density fractions. The lipid raft marker Flotillin2 was distributed in fractions 1–5 (15% to 25% ~ 35% interface), thus, fractions 1–5 contain the lipid raft-associated proteins, while fractions 6–11 contain non-raft-associated proteins (Figure 2).
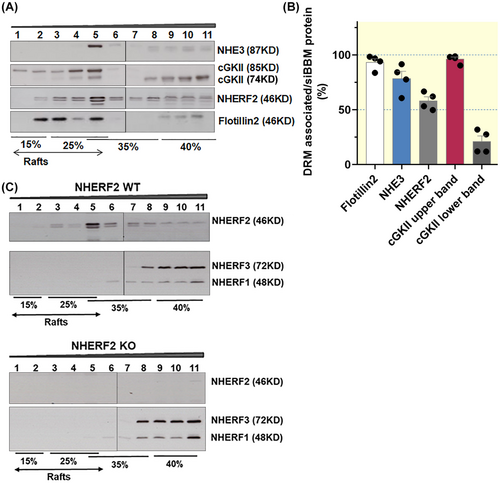
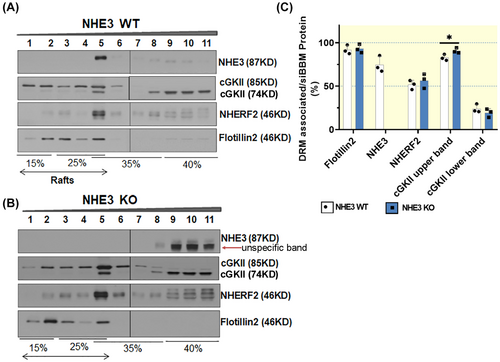
As shown in Figure 2, siBBM NHE3 was strongly lipid raft associated (78% ± 7%) (Figure 2B). We had not realized this high percentage of lipid raft association of siBBM NHE3 previously, because we had no knowledge of the non-specificity of the lower size band in the non-raft fractions.27 However, it is very clear that long exposure times of the Western blots with the fractions isolated from the floatation gradient reveal this non-specific band (clearly seen in the lipid raft isolation from the nhe3−/− siBBM) (Figure 3A–C).
As previously observed, NHERF2, which is detected in 2–3 bands, is distributed in the raft and non-raft fractions, with >50% being lipid raft associated. The anti-NHERF2 antibody has been studied in siBBM from our mouse strains before, and is known to also detect NHERF1, albeit with much lower affinity.27 However, as shown previously, NHERF1 is virtually not present in the lipid raft fractions of murine siBBM (Figure 2C). Therefore the 2–3 bands detected with the anti-NHERF2 antibody in the lipid raft fraction (all of which are absent in the nherf2−/− siBBM lipid raft fractions shown in Figure 2C) represent NHERF2. Faint NHERF1 bands can be seen directly above the upper NHERF2 band in some of the non-raft membrane fractions. Western blot analysis of the lipid raft floatation fractions with the antibodies specific for NHERF1, 2, and 3, respectively, confirms the previous finding that only NHERF2, but not NHERF1 and NHERF3, is associated with the lipid raft fraction in siBBM27 (Figure 2C).
The cGKII with larger molecular size was nearly completely lipid raft associated (97% ± 1%), while cGKII with lower molecular size was strongly non-raft associated (79% ± 7% in the non-raft fraction) (Figure 2A,B). Since N-myristoylation has been shown to enhance membrane association of cGKII, we assume that the lipid raft-associated, larger variant is the myristoylated cGKII. Whether the smaller, non-raft-associated band represents the enzymatically inactive, GKII-inhibitory, alternatively spliced, slightly shorter variant,28 or a partially degraded cGKII, is not clear (Figures 2A, 3A,B, and 4A,B). As displayed in Figure 2A, cGKII, NHERF2, and NHE3 co-assemble in fraction 5 of the floatation gradient.
2.3 Role of NHE3, NHERF2, and cGKII in influencing the lipid raft association of each protein in murine siBBM
The NHERF2 and cGKII bands appear more prominent in the nhe3−/− siBBM-derived lipid raft fractions, but for methodological reasons, we only quantify the distribution of each studied protein in the gradient fractions, not between WT and KO Western blots. The bargraphs indicate the percentage of each studied protein that is found in the lipid raft (DRM) fraction. The distribution of NHERF2 within the gradient fractions was not shifted, while the lipid raft association of cGKII (upper band) increased (Figure 3A–C).
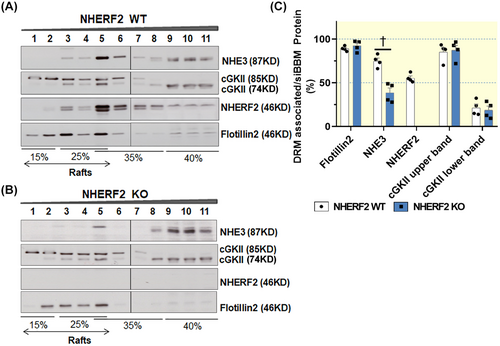
The association of NHE3 with the lipid raft fraction of siBBM decreased significantly in nherf2−/− mice (38% ± 6%) compared with the WT littermates (75% ± 4%), suggesting that NHERF2 targets NHE3 to lipid rafts (Figure 4A–C). The association of cGKII with the lipid rafts was not different between nherf2−/− and WT littermates (Figure 4A–C).
NHE3 as well as NHERF2 association with the lipid raft and non-raft fractions of siBBM was not significantly different between cgkII−/− and WT littermates (Figure 5A–C).
2.4 Linaclotide application accelerated the small intestinal transit, increased the stool water content, and resulted in a time-dependent decrease in NHE3 siBBM abundance
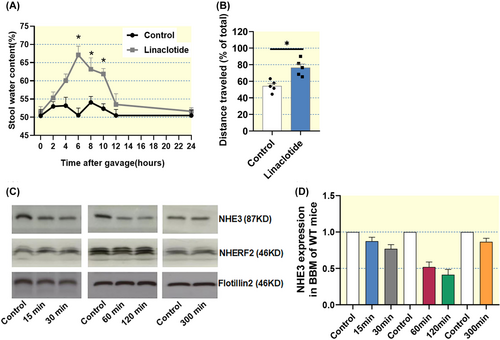
A major goal of the project was to study the physiological significance of lipid raft association of NHERF2 and NHE3 and its potential regulatory significance during Gucy2c signaling in vivo. Therefore, the optimal timing to sacrifice the mice and excise the small intestine after oral application of the Gucy2c agonist linaclotide needed to be determined. Figure 6A illustrates the stool water content of mice treated with linaclotide (200 μg/kg body weight by gavage), in the subsequent hours after the gavage. Stool water content started to increase significantly at 3–4 h post gavage and had normalized at 12 h post gavage. We also mixed the linaclotide with a tracer (charcoal powder, later microcrystalline cellulose powder) to estimate the small intestinal transit time. The total intestine was removed at different time periods post gavage with vehicle or linaclotide, the total intestine was inspected and the location of the tracer was noted (Figure 6B, results from 1 h post gavage, shows the percent of total intestinal length that had been passaged by the tracer). The above experiments suggested that a time of 1 or 2 h after gavage may be optimal to assess the effects of oral linaclotide application on NHE3 complexome formation, because the tracer had moved through the total length of the small intestine post linaclotide gavage. To further validate this notion, the small intestine of WT mice was excised at different time points (15 min, 30 min, 1 h, 2 h and 5 h) after linaclotide treatment, siBBMs were isolated, and Western blot analysis was performed to assess the NHE3, NHERF2, and cGKII membrane expression. A linaclotide-induced reduction of NHE3 membrane expression was seen as early as 15 min, was maximal after 2 h, and had almost returned to normal 5 h after linaclotide application (Figure 6C,D). Therefore, the small intestine was excised at 1 and 2 h post gavage for siBBM isolation, and lipid raft floatation assay. A small part of the jejunum was used for the immunohistological determination of NHE3 trafficking along the microvillar-terminal web axis of the siBBM.
2.5 Linaclotide application resulted in the redistribution of NHE3 to the terminal web region and a more intracellular location
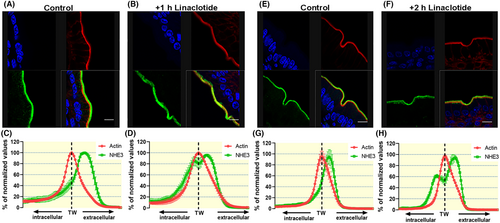
A segment of the small intestine (jejunum) was removed and fixed for immunohistochemical analysis as described in Methods. Figure 7A,B display confocal images of NHE3 and F-actin in the brush border membrane, gavaged with vehicle or with 200 μg/kg body weight linaclotide, excised at 1 h post gavage. Figure 7C,D shows the distribution of NHE3 and F-actin along an axis perpendicular to the siBBM, with the peak location set to 100% for each of the two proteins. The peak of F-actin marks the terminal web zone (TW),29 and it is obvious that in the vehicle-treated WT mice, the majority of the NHE3 immunostaining is more extracellular than the F-actin peak. After linaclotide treatment, a redistribution of the NHE3 immunofluorescence to the terminal web zone and even to a more intracellular location was observed (green and red immunofluorescence largely overlap in Figure 7C, green curve shifted to left in Figure 7D). The NHE3 and F-actin distribution at 2 h after linaclotide gavage are shown in Figure 7E–H.
2.6 Linaclotide application decreased NHE3 lipid raft abundance and increased cGKII lipid raft abundance
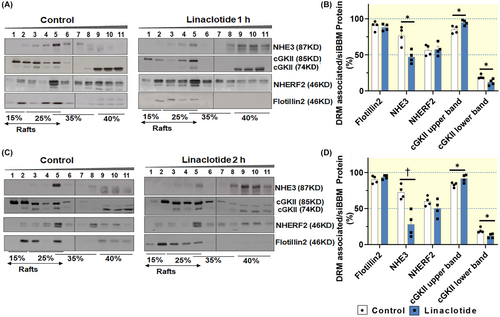
The small intestine was removed at 1 and 2 h after oral linaclotide application, siBBM was isolated followed by floatation density gradient centrifugation. As shown in Figure 8A–D the percentage of raft-associated NHE3 had decreased significantly both at 1 and 2 h after linaclotide application compared to vehicle treatment, while the percentage in the non-raft fractions had increased. In addition, the percentage of non-raft-associated cGKII had decreased significantly, while the raft-associated percentage of cGKII had increased. In summary, the shift of NHE3 from a lipid raft to a non-raft fraction was stronger at 2 h post gavage, while the close association of the cGKII to the rafts was persistent at 2 h post gavage.
2.7 Loss of linaclotide-induced NHE3 lipid raft and siBMM redistribution in cgkII−/− mice at 1 h post gavage
Western blot analysis did not show a reduction of NHE3 in the lipid raft fraction after linaclotide compared to vehicle treatment in the absence of cGKII expression (Figure 9A,B), but these blots are difficult to evaluate because of a rather prominent double band with NHE3 immunoreactivity in the non-raft fraction (in a slightly lower size range than the raft-associated NHE3). The cgkII−/− mice is the only strain on the C57B/6 background, used in this study. In a previous study, in which more of the mouse strains were on the C57B/6 strain, we had also seen this double band, and also quantified the lower band as NHE3. Since strains differ in subtle aspects of intestinal physiology, it is feasible that the prominent lower band is more visible in that strain (see also Figure 5). We quantified the upper band as NHE3 in the present study. This upper band with NHE3 immunoreactivity occasionally runs at a slightly lower size in the non-raft fractions also in the experiments with FVB/N mice (i.e., see Figures 2 and 8C).
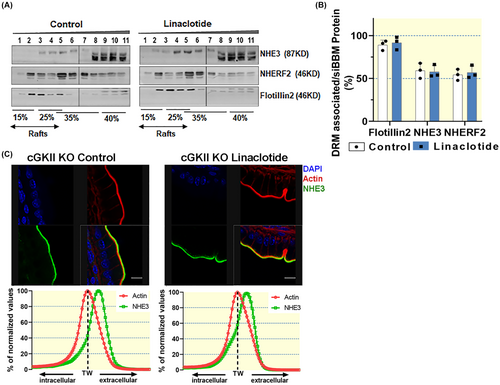
Lack of cGKII expression did not cause redistribution of NHE3 in the brush border membrane (Figure 9C). This confirms previous observations of the essential role of the cGKII for mediating Gucy2c activation-associated NHE3 inhibition in murine small intestine.14
2.8 Strong reduction of linaclotide-induced NHE3 lipid raft and siBMM redistribution in nherf2−/−mice at 1 h post gavage
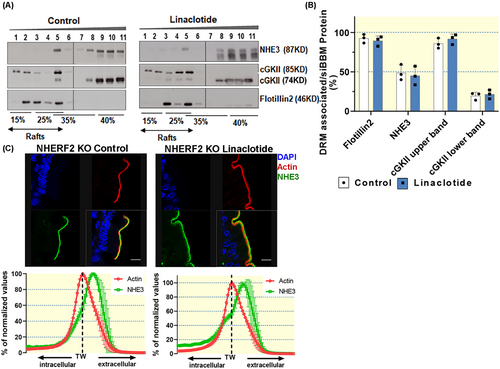
In the absence of NHERF2, the association of NHE3 with the lipid raft fractions was reduced, and was not significantly influenced by linaclotide application in vivo (Figure 10A,B). The membrane redistribution of NHE3 after linaclotide gavage was also assessed in nherf2−/− and WT small intestine (Figure 10C). The percentage of NHE3 immunostaining that redistributed from the microvillar (extracellular) to a more intracellular location after linaclotide gavage was reduced in nherf2−/− versus WT small intestine (compare Figure 10C with Figure 7D,H).
3 DISCUSSION
This study assessed the dynamic association of three key components of Gucy2c-mediated inhibition of small intestinal fluid absorption, namely the sodium/hydrogen exchanger NHE3, the PDZ adaptor NHERF2, and the cGMP-dependent kinase cGKII, with the lipid raft platforms in the small intestinal brush border membrane (siBBM) during receptor mediated activation of Gucy2c in vivo. The lipid raft association of NHE3 has been described before, and evidence for a functional role of NHE3 lipid raft association has been provided both in rabbit ileal BBM in vitro30 and murine jejunal BBM in vivo,27 as well as in heterologous expression systems.25 Lipid raft association of NHE3 is essential both for the PI3-kinase-induced increase of NHE3 in the BBM,30 as well as the carbachol-induced recycling of NHE3.26 Phosphorylation of NHE3 at serin19 increases lipid raft association of NHE3.26
We previously observed that the presence of the PDZ adaptor NHERF2 significantly increases the localization of NHE3 in the siBBM lipid rafts.27 Based on these observations, we asked the question whether the preferential raft association of NHERF2 might be important in its contribution for the NHE3 inhibition by Gucy2c activation in vivo. The pharmacological development of linaclotide, a hybrid design based on the structures of the STa peptide STp, and the endogenous guanylin and uroguanylin peptides, provided a reliable tool to activate intestinal Gucy2c in vivo.31, 32 Experiments in nhe3−/−, cgkII−/−, and nherf2−/− mice and respective WT littermates demonstrated that the lipid raft association of cGKII was independent of NHERF2 expression, whereas that of NHE3 was not. The lipid raft association of NHERF2 was independent of both NHE3 and cGKII expression. This suggests that NHERF2 is intimately associated with the lipid raft fraction of the small intestinal membrane (possibly by binding to other, raft-associated proteins), and that its presence targets NHE3 to the raft fraction.
The larger cGKII entity is also intimately linked to the raft fraction, but in a NHERF2-independent fashion. Because cGKII is known to undergo lipid modification, namely myristoylation, which is required for its presence at the apical membrane,33 the larger, lipid raft-associated cGKII entity is likely the myristoylated form. We do not know the molecular entity of the smaller cGKII. Myristoylation does not increase the size of cGKII sufficiently to explain the difference in molecular weight. However, a smaller splice variant has been described to be co-expressed with cGKII in human, rat and mouse tissues that also express the longer variant, which inhibits both cGKII and cGKI.28 Possibly, the lipid raft association of cGKII removes myristoylated cGKII from the inhibitory effect of the splice variant and is another mode of activation, in addition to the cGMP binding. Although cGKII has been reported to bind to NHERF2, when both are co-expressed in PS120 fibroblasts,18 the lipid raft association of endogenous cGKII in the murine siBBM requires neither NHERF2 nor NHE3.
We next searched for potential changes in the lipid raft association of NHE3, NHERF2, and cGKII during in vivo activation of Gucy2c by oral application of linaclotide. To allow for physiological conditions during the linaclotide Gucy2c interaction, we defined a dose of linaclotide that resulted in a transient increase in stool water, used this dose to determine the small intestinal transit time, and assessed the presence of NHE3 in the siBBM after 15 and 30 min, 1, 2 and 5 h post-vehicle or post-linaclotide gavage. A significant decrease in siBBM NHE3 was observed at 1 h and slightly more so at 2 h post-linaclotide gavage, with a return to vehicle-treated control levels at 5 h post gavage (Figure 6). Immunohistochemical assessment of the localization of NHE3 in relation to F-actin, which is most strongly localized in the terminal web region29 demonstrated that the majority of NHE3 immunofluorescence was right-shifted in comparison to the F-actin distribution in vehicle-gavaged mice, indicating a predominantly microvillar location of NHE3 (Figure 7). In the linaclotide-gavaged mice, the NHE3-mediated immunofluorescence had shifted to the terminal web region and to some extent even more intracellularly than the F-actin distribution. It has been previously shown that in rat proximal tubule after an increase in blood pressure (which results in pressure natriuresis), the trafficking of NHE3 is from the tip and axis of the microvilli to the microvillar base in the terminal web region.34 Our data suggest that siBBM NHE3 also traffics in part to the base of the microvilli. Correspondingly, the siBBM-associated NHE3 was redistributed to the non-raft fraction (Figure 8). A similar observation has been made by Riquier et al, who demonstrated that the trafficking of NHE3 to the base of the microvilli was associated with less detergent insolubility, that is, more non-raft association.35
In addition to the NHE3 redistribution within the siBBM from a raft to a non-raft fraction, a part of NHE3 leaves the siBBM (Figure 6C). The strong lipid raft association of NHERF2 did not change significantly, in contrast to that of its ligand NHE3.18, 36 The raft association of NHERF2, which is not an integral membrane protein, may be due to its binding to other lipid raft-associated siBBM proteins, which do not traffic out of the siBBM in an Gucy2c-dependent manner (i.e., Slc26a3). In contrast, the lipid raft association of the larger band of cGKII increased in the linaclotide gavaged versus vehicle gavaged siBBMs, and this was so in the rafts both 1 and 2 h post gavage. This suggests that Gucy2c activation promotes the lipid raft association of cGKII, where it may come in close contact and phosphorylate NHE3, resulting in its membrane redistribution.
We next determined the dependency of the linaclotide-induced redistribution of NHE3 on the presence of cGKII and NHERF2. For these experiments, the siBBMs were prepared 1 h post gavage. In the absence of cGKII expression, the linaclotide-induced NHE3 redistribution from the lipid raft to the non-raft fraction of the siBBM was abolished, as was the linaclotide-induced shift of the NHE3 localization from the microvillar to the terminal web position. These findings are consistent with the strong dependency of Gucy2c-dependent inhibition of murine small intestinal sodium absorption on the expression of cGKII.14 The data suggest that the cGMP-activated, lipid raft-associated cGKII phosphorylates the raft-associated NHE3, which results in both a loss of the lipid raft association of NHE3 and its movement to the terminal web, which may be two manifestations of the same event, as discussed above.35 In addition, a large fraction of NHE3 leaves the siBBM region altogether (Figure 6C). However, neither NHERF2 nor cGKII appear to co-traffic with NHE3 during the NHE3 redistribution. After cGKII-mediated phosphorylation, NHE3 may associate with other NHERFs, myosins, etc., that facilitate the movement along the microvillar axis and into the recycling as well as the degradation pathways.
In the absence of NHERF2 expression, the percentage of lipid raft-associated NHE3 was reduced, and not significantly different between vehicle and linaclotide-exposed siBBMs (Figure 10). The percentage of NHE3 which shifted from the microvillar to the terminal web position was also reduced, but not completely absent, like in the case of cGKII deletion. This suggests that a minor part of the cGKII-dependent NHE3 trafficking by Gucy2c activation is not NHERF2 dependent.
NHERF2 has previously been recognized to have a much slower diffusion coefficient in the membrane of opossum kidney (OK) cells, a feature that is dependent on a unique motif in the C-terminus.37 This motif was important for the formation of larger protein complexes and was important for Ca2+ mediated inhibition and LPA-associated mobility into the microvilli. Although the authors considered a lipid raft association of NHERF2 as a potential explanation for its low diffusion coefficient, they did not find such an association. Lissner et al., using different cell lines, preparation techniques and lipid raft markers, found a stronger raft association of NHERF2 than of NHERF1.38 Using a similar detergent solubilization and raft floatation technique for the separation of lipid rafts from the non-raft fraction in murine small intestinal mucosa, Sultan et al. also observed a much stronger association of NHERF2 to the lipid rafts than for NHERF1 or PDZK1 and, importantly, the raft association of NHERF2 was important for that of NHE3.27 The current study confirms these results.
Our experimental approach of isolating the siBBM after in vivo stimulation of a receptor-mediated signaling event has advantages and disadvantages: An advantage is that it studies the native epithelium in a near-physiological setting. This bears the disadvantage that the control, that is, the vehicle gavaged mice, do not represent an ideal “resting state,” because the gastrointestinal system is constantly under neurohormonal influence, and because vehicle-gavage will also stimulate the GI tract as well as the central nervous system of the mice. Indeed, we observed a high percentage of myristoylated cGKII in the vehicle-gavaged animals, which may be due to the release of endogenous guanylin and/or uroguanylin. However, the small intestinal enterocytes of our linaclotide-treated animals are not all in the “fully stimulated state,” because of issues with linaclotide stability, receptor accessibility, and the time course of the stimulatory events. We chose the time points of 1 and 2 h post gavage for sacrifice and siBBM preparation, because this was the time in which the relatively lowest amount of NHE3 was observed in the siBBM membrane. However, not all enterocytes will be stimulated at the same time.
Another asset of our study is that we isolate the siBBM first, before detergent treatment and lipid raft floatation. This ensures that the lipid rafts in organellar and basolateral membranes, which constitute a large fraction of the total lipid rafts of the cell, are excluded from the gradient. This may be the reason why we are able to demonstrate the strong NHERF2 as well as NHE3 lipid raft association in the siBBM.
Our findings add another piece to the complicated puzzle how guanylate cyclase C activation results in changes in the fluid status of the gut. It is, to our knowledge, the first study exploring the dynamic changes in the association of NHE3 with lipid rafts after stimulating the guanylate cyclase C in vivo. The results suggest that the raft-associated NHERF2 tethers NHE3 to the rafts, where it can interact with larger entity of cGKII, which is exclusively lipid raft associated. This function of NHERF2 is not shared by NHERF1 or 3, and explains its unique importance for Gucy2c-mediated NHE3 inhibition. In vivo, Gucy2c activation is associated with a significant reduction of raft-associated NHE3, as well as a significant shift of the NHE3 localization from the microvillar to a terminal web location. Both of these events are dependent on NHERF2 expression as well as on cGKII expression. While NHERF2 does not change its raft association during guanylate cyclase C activation, a small but significant increase in raft-associated cGKII was observed.
4 MATERIALS AND METHODS
4.1 Reagents and antibodies
The following antibodies were used: rabbit polyclonal anti-rat NHE3 (Alpha diagnostic) (1:2000); mouse flotillin2 antibody (Santa Cruz Biotechnologies) (1:2000), rabbit anti-NHERF1 (Ab5199) and anti-NHERF2 (Ab 2170) antibodies (gift from Prof. Chris C. Yun, Emory Univ., Atlanta) (1:10 000 and 1:5000, respectively); rabbit anti NHERF-3 and cGKII antibody (gift from Prof. Hugo deJonge, Erasmus MC, Rotterdam) (1:2000). The anti-rabbit and anti-mouse, HRP-conjugated secondary antibodies were used at a dilution of 1:10 000 (Abcam).
4.2 Mouse strains
CgkII−/− (C57BL6/N-Prkg2tm1Pfe) mice were generated as described in Pfeifer et al.13 and bred on the C57B/6 background in the animal facility of the Pharmacological Institute of the Technical University of Munich, and at the Hannover Medical School animal facility. Nherf2−/− (FVB/N-Slc9a3r2gt(OST2298)Lex) mice strain were originally generated from Lexicon genetics clone OST2298 in the laboratory of Chris Yun and were bred at the Hannover Medical School animal facility as described previously.16 Nhe3−/− (FVB/NSlc9a3tm1Gas) mice strain was originally generated in the laboratory of Gary Shull39, and were bred at the Hannover Medical School animal facility as described.40 All strains except the cgkII−/− strain were congenic on the FVB/N background. Age- and sex-matched wild-type mice from the respective strain were used as controls. The animals were kept under standardized light and climate conditions with access to chow and water ad libitum. Animals were fasted from midnight to approx. 7–8 a.m. at the latest, before gavage with 200 μg/kg linaclotide (because gavage into a full stomach may compromise the animals´ health, and may retain the linaclotide in the stomach). Longer periods of fasting may negatively affect regulatory aspects of intestinal transport physiology.41 Animal experiments were performed following approved protocols of the Hannover Medical School and the local authorities for the regulation of animal welfare. The animal experimentation permission had the number 33.19-42502-04-14/1605. The linaclotide dosage was similar to that previously applied to mice in in vivo studies.42 We had applied different doses starting from 5 μg/kg body weight, and had used a dose that resulted in a significant but reversible increase of stool water content, as shown in the results section.
4.3 Assessment of stool water content and small intestinal transit time
The small intestinal transit time was determined as described in Refs. [42, 44], with modifications. We did not use rhodamine-labeled dextran in the gavage fluid, because we needed to have the whole length of the small intestine intact for the siBBM preparation, but mixed a very small amount of powdered charcoal as tracer with the gavage fluid, which is well visible by eye. Because of a potential linaclotide binding to charcoal and the discolorment of scraped membranes, we later used microcrystalline cellulose, which is inert, and could be well visualized in the backlit preparation table. The mice were sacrificed at defined time periods, the whole gastrointestinal tract was removed, and the length of the total intestine through which the charcoal/cellulose had traveled was measured.
4.4 Isolation of brush border membrane from murine small intestine
Isolation of siBBM as well as the subsequent lipid raft isolation was performed as reported previously, with minor modifications.27 In brief, small intestinal segments were flushed with cold PBS, opened longitudinally, and the mucosa was harvested by scraping with a glass slide and homogenized in 3 mL of buffer A (270 mM mannitol, 12 mM Tris, 16 mM HEPES, 1 mM EGTA, 1.006 mM CaCl2, pH 7.4, 40 μg/mL PMSF, 20 μg/mL leupeptin, 20 μg/mL pepstatin A, 20 μg/mL antipain, 1 mM DTT, 4 mM benzamidin). The post-nuclear homogenate was prepared by using 20 up and down strokes in a motorized glass potter (Potter S, Braun-Melsungen, Germany). This procedure was repeated within 5 min interval on ice, followed by centrifugation at 2000 g for 10 min at 4°C. The supernatant was collected, samples taken for homogenate analysis, and 1 M MgCl2 was added to a final concentration of 10 mM with 20 min of mixing and centrifuged at 3000 g for 15 min. Supernatant was centrifuged at 30 000 g for 30 min. The pellet was potterized and suspended in Buffer B (270 mM Mannitol, 12 mM Tris, 16 mM HEPES, pH 7.4, 40 μg/mL PMSF, 20 μg/mL Leupeptin, 20 μg/mL Pepstatin A, 20 μg/mL Antipain, 1 mM DTT, 4 mM Benzamidin). 1 M MgCl2 precipitation and centrifugation at 3000 g for 15 min was repeated. Supernatant was centrifuged at 30 000 g for 30 min. The pellet was re-suspended in TN buffer (50 mM Tris-Cl, 150 mM NaCl, pH 7.4, 40 μg/mL PMSF, 20 μg/mL leupeptin, 20 μg/mL pepstatin A, 20 μg/mL antipain, 1 mM DTT, 4 mM benzamidin) using a 25G needle. This was the siBBM which was used without freezing for isolation of DRMs. Before loading the siBBM onto the Optiprep gradient, the protein concentration was determined using the Bradford assay as described.27 A small amount of BBM was stored at −80°C for running as a control on PAGE.
4.5 Isolation of detergent-resistant membrane from siBBM
For isolating lipid rafts, we followed the procedure as described earlier,27 with slight modification: siBBM containing 1 mg protein was treated with Triton-X-100, final concentration 1%, in TN buffer, up to a volume of 1 mL; for 30 min with gentle mixing on an orbital rotator at 4°C. The sample was adjusted to 40% by using 2 mL of 60% OptiPrep (Axis-Shield, PROGEN Biotechnik, Heidelberg). A step gradient was generated by using the 3 mL of 40% OptiPrep as the cushion at the tube bottom, and successive layers with decreasing concentrations of OptiPrep—3.5 mL of 35%, 2.5 mL of 25% and 2 mL of 15% OptiPrep/TN were layered on top of each layer. Centrifugation was carried out in SW-41 Ti Beckman Coulter rotor at 170 000 g, for 4 h. One-milliliter fractions were collected from the top and precipitated with 2 volumes of ice cold acetone, stored at −20°C overnight. The precipitated protein pellets were resuspended in 100 μL SDS-PAGE sample buffer and heated at 65°C for 15 min. Equal volumes of each fraction were analyzed by SDS-PAGE, followed by Western blotting.
4.6 Immunoblot analysis
Due to low protein concentration of the proteins after the floatation assay, the proteins were loaded on a SDS-PAGE (10-15 %) using 10 well combs to ensure loading of higher sample volumes. For this reason two SDS-PAGE gels had to be used per floatation assay, with one gel contaning fractions 1 to 6 and a second gel containig fraction 7 to 11. Positive and negative antibody control was run along the proteins in each gel, as well as protein size marker. Each of the analyzed fractions had the same protein concentration, determined previously with BCA protein assay (Thermo Scientific). The two gels were transfered to two PVDF membranes (GE healthcare Life Sciences). Blots were blocked for 1 h and first incubated with primary antibodies overnight at 4°C, washed with TBST buffer and incubated with the respective secondary antibodies for 1 h at room temperature. Blots were developed by using ECL reagent (GE healthcare Life Sciences), by placing the membranes on the same X-ray film so that both membranes containing the different fractions (fraction 1 to 11) have equal exposure times. The signals were quantitated by ImageJ software for gel analysis. Exposure times varied from 10 s for flotillin to up to 1 min for NHE3 band visualization. For the visualization of several proteins of similar size, such as cGKII and NHE3, the membrane was stripped and re-exposed to the second primary antibody. For stripping of the PVDF membranes stripping buffer (1% SDS, 62.5 mM M Tris HCl, pH 6.8, 0.8% β-mercaptoethanol in distilled water), was pre-heated at 50°C and added to the membrane. The membrane was incubated at 50°C for up to 45 min with some agitation, followed by extensive washing with water and TBST prior re-blocking. When Western blots from knockout and WT mice were compared, the antibody against the protein that was knocked out was the first antibody to which the blot was exposed (to make sure that no error in mouse assignment and distribution has occurred during the genotyping and the subsequent experimental handling). Because the blots were stripped and re-exposed to the next antibody, we only compared the band densities in the different fractions within each blot, not between blots from different experimental groups.
4.7 NHE3 distribution along the terminal web-microvillar axis in the murine BBM
In order to estimate the Gucy2c activation-induced NHE3 redistribution from a microvillar body to a terminal web location, the NHE3 and F-actin distribution in the jejunal BBM was analyzed by immunofluorescent analysis as previously reported.19, 45 The distribution of NHE3 and of F-actin perpendicular to the microvillar-terminal web-cytoplasm axis was analyzed by ImageJ as described before in Refs. [19, 45]. The peak value of the F-actin signal was taken as the terminal web region.29 Immunofluorescence to the right side of the F-actin peak is localized toward a more extracellular (i.e., the microvilli) location than the terminal web, immunofluorescence to the left side of the F-actin peak is located more intracellular. For plotting the NHE3 signal, a minimum of five regions were studied from each histological section. The graph shows the average of the intensity profiles. The peak of each intensity curve was set to 100%.
4.8 Statistical analyses
For each siBBM preparation followed by lipid raft floatation, the small intestinal mucosa from three mice was pooled. Each lipid raft preparation was repeated at least three times. Results are expressed as mean ± SEM, with the number of experiments (mice or WT and KO pairs) performed in parenthesis. Differences between experimental groups were evaluated by using unpaired Student's t test or by ANOVA with post hoc analysis for multiple comparisons. Data were considered to be significant when p < 0.05.
AUTHOR CONTRIBUTIONS
Katerina Nikolovska: Writing – original draft; writing – review and editing; formal analysis; visualization. Min Luo: Conceptualization; investigation; methodology; validation; data curation; writing – original draft; visualization; formal analysis; software. Yongjian Liu: Conceptualization; investigation; writing – original draft; methodology; validation; visualization; software; formal analysis; data curation. Brigitte Riederer: Conceptualization; investigation; methodology; validation; visualization; data curation; formal analysis. Enrico Patrucco: Investigation; methodology; data curation. Franz Hofmann: Writing – review and editing; resources. Ursula Seidler: Conceptualization; investigation; funding acquisition; writing – original draft; writing – review and editing; project administration; resources; supervision.
ACKNOWLEDGMENTS
This project was funded by the DFG Sachbeihilfe SE460/21-1 and SE 460/22-1, and by the Volkswagen Stiftung grant Z1953. We are grateful to the animal caretakers of the MHH institute for animal research and the TUM pharmacological institute for mouse breeding. Animal experiments were performed following approved protocols of the Hannover Medical School and the local authorities for the regulation of animal welfare. The animal experimentation permission had the number 33.19-42502-04-14/1605. We are grateful to the group of Hugo deJonge for sharing the anti-cGKII antibody, and to the group of Chris Yun for sharing the anti-NHERF2 antibody. Open Access funding enabled and organized by Projekt DEAL.
CONFLICT OF INTEREST STATEMENT
The authors have no conflict of interest to declare.
Open Research
DATA AVAILABILITY STATEMENT
The data that support the findings of this study are available from the corresponding author upon reasonable request.


