Acidosis-induced activation of distal nephron principal cells triggers Gdf15 secretion and adaptive proliferation of intercalated cells
Abstract
Aim
Type A intercalated cells of the renal collecting duct participate in the maintenance of the acid/base balance through their capacity to adapt proton secretion to homeostatic requirements. We previously showed that increased proton secretion stems in part from the enlargement of the population of proton secreting cells in the outer medullary collecting duct through division of fully differentiated cells, and that this response is triggered by growth/differentiation factor 15. This study aimed at deciphering the mechanism of acid load-induced secretion of Gdf15 and its mechanism of action.
Methods
We developed an original method to evaluate the proliferation of intercalated cells and applied it to genetically modified or pharmacologically treated mice under basal and acid-loaded conditions.
Results
Gdf15 is secreted by principal cells of the collecting duct in response to the stimulation of vasopressin receptors. Vasopressin-induced production of cAMP triggers activation of AMP-stimulated kinases and of Na,K-ATPase, and induction of p53 and Gdf15. Gdf15 action on intercalated cells is mediated by ErbB2 receptors, the activation of which triggers the expression of cyclin d1, of p53 and anti-proliferative genes, and of Egr1.
Conclusion
Acidosis-induced proliferation of intercalated cells results from a cross talk with principal cells which secrete Gdf15 in response to their stimulation by vasopressin. Thus, vasopressin is a major determinant of the collecting duct cellular homeostasis as it promotes proliferation of intercalated cells under acidosis conditions and of principal cells under normal acid-base status.
1 INTRODUCTION
The renal tubule is made of a succession of segments endowed with specific properties for solute transport and regulation. Conversely to the initial nephron segments, each made of a single cell type, the terminal segments of the nephron, ie the connecting tubules and collecting ducts, are made of principal cells and type A and type B intercalated cells (PCs, AICs and BICs respectively) with both common and specific transport properties. PCs can reabsorb sodium and water and secrete potassium, AICs can secrete protons and sodium, whereas BICs can secrete bases and reabsorb sodium. The homeostatic control of the kidney function relies on the coordinated endocrine, paracrine, autocrine and neural regulations of the different transport systems in the different cell types. On the long term, it also relies on the homeostatic control of the size of the different cell populations.
As a matter of fact, although the highly differentiated epithelial renal cells display a low rate of renewal,1 cell proliferation can be reset in response to epithelium damage,2-5 a process which represents a major contribution to post-injury repair. Proliferation of kidney epithelial cells may be induced also in absence of tubular damage during physiologic adaptations of the tubular transport capacity; it participates then in a homeostatic process in which the kidney is thought to adapt its structure and cell composition to cope with its transport workload. For example, dehydration and high plasma levels of vasopressin induce cell proliferation and the subsequent lengthening of the loops of Henle and collecting ducts, allowing kidneys to increase their urine concentrating ability and to preserve water.6, 7 A unique feature of the adaptive proliferation of kidney epithelial cells is that it does not require their prior de-differentiation: fully polarized cells are subject to mitosis,8, 9 thereby increasing the tubular function without transiently altering its barrier function. The factors that promote such adaptive proliferation of kidney cells and their signalling mechanisms remain poorly understood. Characterizing them should open the way to kidney tissue engineering and new therapeutic strategies to restore specific impaired tubular functions.
AICs of the collecting duct display this dual ability to increase their individual acid-secreting capacity and to proliferate in order to maintain acid/base balance. In response to an acid load, AICs initially increase proton secretion by targeting H-ATPase and the  exchanger AE1 to the apical and basolateral cell membrane respectively.10 The activation of H-ATPase is thought to reduce the intracellular ATP/AMP concentration ratio, which activates AMP-activated protein kinase.11 In turn, AMPK inhibits H-ATPase activity,11, 12 a mechanism thought to protect cells against metabolic stress. The existence of this AMPK-dependent feedback inhibition of H-ATPase implies that adaptation to a sustained acid load requires additional mechanisms to maintain a high rate of proton secretion. The adaptive enlargement of the AICs population, which has been reported several decades ago,13 supports this long-term adaptation to acid load. Thus, blockade of AIC proliferation in acid-loaded mice is associated with an impaired ability to maintain their acid/base balance.8 We reported previously that acid load induces an early (days 1-3) proliferation of AICs in mouse outer medullary collecting ducts,14 which is dependent on the production of growth/differentiation factor 1515 by OMCD cells and the subsequent induction of cyclin d1 expression through a PI3 kinase/Akt-dependent pathway, and a late proliferation (days 3-15), associated with cell hypertrophy, which is independent of Gdf15 and depends on cyclin d3 expression.8 Gdf15, a distant member of TGFβ super-family, is synthesized as a signal peptide-containing precursor molecule and is secreted upon cleavage of the pro-peptide.16 It has pleiotropic effects involved in physiological and pathophysiological processes including macrophage activation, haematopoiesis, iron metabolism, pregnancy, control of appetite, neurotrophicity and neuroprotection.15 More recently, the interest for Gdf15 arose from the observation that its circulating level is positively correlated with neoplastic progression of several cancers, and Gdf15 is now considered as a tumour suppressor.17 In fact, Gdf15 is one of the main targets of the tumour suppressor p53.18
The aims of this study were to decipher the molecular mechanisms underlying acid load-induced secretion of Gdf15 and its mechanism of action on AIC proliferation. Because Gdf15 is a paracrine/autocrine factor, we first searched for the cellular origin (PCs and/or AICs) of acid load-induced Gdf15. Gdf15 can be produced by PCs since vasopressin (AVP) increases Gdf15 expression in mCCD cells, a mouse PCs line,19 but whether it is also produced by AICs remains unknown. Regarding the sensing mechanism that couples acidosis with Gdf15 production, the G protein- and adenylyl cyclase-coupled receptor Gpr420 appears as a good candidate since the stimulation of acid secretion and the increase in the number of AICs induced by acid load are blunted in the collecting duct of Gpr4−/− mice.21, 22 The exact cellular expression of Gpr4 is not known. Alternatively, AVP might be a candidate because AVP plasma level increases in NH4Cl-loaded animals23 and AVP induces proliferation in collecting duct.6 However, AVP-stimulated proliferation was reported to be confined to PCs and not AICs.6
2 RESULTS
2.1 Gdf15 is produced by principal cells through activation of vasopressin receptor
We first determined the cellular origin of Gdf15 within OMCDs. In absence of commercially available anti-Gdf15 antibody usable for immuno-labelling, we evaluated the expression of Gdf15 mRNAs in AICs isolated from the kidney medulla of B1-EGFP mice,24 which specifically express EGFP in AICs. We first verified that indeed all EGFP-positive cells in OMCDs were labelled with anti-AE1 antibody and that all EGFP-negative ones were not (Figure 1A), confirming the absence of BICs in the OMCD. Accordingly, EGFP-positive cells isolated from kidney medulla expressed AE1 mRNA, whereas EGFP-negative cells did not (Figure 1B). EGFP-positive cells, ie AICs, did not express Gdf15 mRNAs, whereas EGFP-negative cells did (Figure 1B), indicating that Gdf15 is produced and secreted by PCs and triggers proliferation of AICs via a paracrine action.
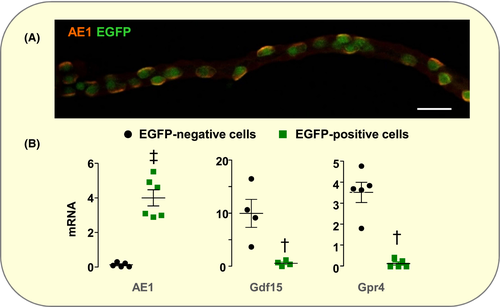
Gpr4 is expressed in PCs and not in AICs (Figure 1B) suggesting that it might be involved in acid load-induced production of Gdf15. In agreement with the absence of increase in the number of AICs,21, 22 we observed that their proliferative indexes, ie the percentage of AICs and the number of AIC doublets, did not increase in the OMCD of acid-loaded Gpr4−/− mice (Figure 2A). However, acid-induced stimulation of Gdf15 expression was not altered in Gpr4−/− mice (Figure 2B). These findings indicate that Gpr4 is not involved in the sensing of acid load that triggers Gdf15 secretion by PCs but that it is necessary for sensitizing AICs to the proliferative action of Gdf15. Under basal conditions, Gpr4−/− mice displayed a moderate respiratory acidosis attested by lower pH (in pH unit ±SE; Gpr4−/−: 7.30 ± 0.01, n = 11; WT: 7.34 ± 0.01, n = 33; P < .05) and higher pCO2 (in mm Hg ± SE; Gpr4−/−: 56.6 ± 1.6; WT: 49.5 ± 1.2; P < 0.005) than WT mice. This hypercapnia likely results from the presence of Gpr4 in retrotrapezoid nucleus where it participates in CO2 stimulation of breathing.25 This is corroborated with DISEASES database (https://diseases.jensenlab.org/) showing that in human Gpr4 is associated with congenital central hypoventilation syndrome (Omim #209880).
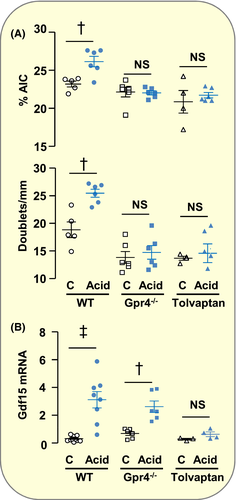
Within the collecting duct, the adenylyl cyclase-coupled type 2 AVP receptors (Avpr2) are expressed exclusively in PCs.26 To evaluate the role of Avpr2 in acid load-induced production of Gdf15, mice were treated with the Avpr2-specific antagonist Tolvaptan. Urine osmolarity from Tolvaptan-treated mice was markedly decreased (in mOsm/kg ±SE; Control: 1722 ± 115, n = 9; Tolvaptan: 597 ± 68, n = 6; P < .001) but did not reach iso-osmolarity, indicating that Avpr2 blockade was not complete. Despite its partial effect, treatment with tolvaptan abolished acid load-induced stimulation of Gdf15 expression (Figure 2B) as well as AICs proliferation (Figure 2A). Thus, AVP via its adenylyl-cyclase coupled Avpr2 receptors is a main trigger of acid load-induced Gdf15 production in PCs.
This finding raises the question of whether AVP pathway is activated by acidosis itself or by the osmotic load associated with the NH4Cl treatment. To address this question, we evaluated the respective roles of acidosis and osmotic load on Gdf15 production. For this purpose, we compared urinary excretion of Gdf15 in NH4Cl-, HCl-, and NaCl-loaded mice. Gdf15 was detectable in the plasma of WT but not Gdf15−/− mice (in pg/mL ±SE; WT, 178 ± 36, n = 6; Gdf15−/−, 0.1 ± 0.2, n = 3) demonstrating the specificity of the assay. Within 3 days of NH4Cl-treatment, the urinary excretion of Gdf15 in WT mice doubled (in pg/day ±SE; Control, 1038 ± 272; NH4Cl, 2193 ± 386; n = 6; P < .05), whereas its plasma concentration did not increase (in pg/mL ±SE: basal, 153.2 ± 28.3, n = 6; NH4Cl-load, 89,8 ± 21.3, n = 6; NS). This suggests 1. the renal origin of urinary Gdf15, and 2. that Gdf15 is secreted at least in part at the apical pole of tubular cells. Within 3 days of HCl-load, urinary excretion of Gdf15 also doubled (in pg/day ± SE: Control, 912 ± 105; HCl, 1896 ± 155; n = 5; P < .001), whereas it did not increase in response to a high sodium diet (in pg/day ± SE: Control, 1519 ± 111; NaCl, 1116 ± 185; n = 6; NS). Note that the osmotic load was higher in NaCl-loaded mice than in HH4Cl-loaded mice, as attested by the higher increase in Na+ excretion (2232 ± 191 µmol Na+/day) than in  excretion (1293 ± 72 µmol
  /day), respectively, induced by the two treatments.
2.2 Proliferative and anti-apoptotic roles of p53
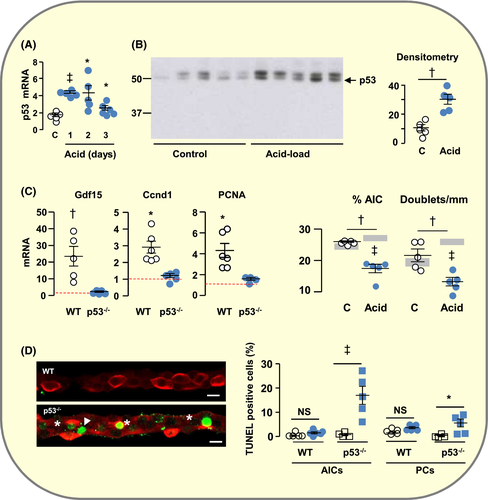
Because acid load increases the expression of p53 mRNAs in OMCD prior to increasing Gdf15 expression8 and because Gdf15 promoter contains p53 response elements and is a main target of p53,18 we evaluated the involvement of p53 in acid load-induced expression of Gdf15 and in proliferation of AICs.
We confirmed that acid load increases p53 mRNAs in OMCDs (Figure 3A) and found that it increased also the nuclear protein abundance of p53 (Figure 3B). In p53−/− mice, acid load-induced expression of Gdf15, cyclin d1 (Ccnd1) and PCNA mRNAs and proliferation of AICs were abolished (Figure 3C,D). Not only the percentage of AICs and the number of AIC doublets did not increase in acid loaded p53−/− mice but also they decreased significantly, suggesting that acid load induces death of AICs in p53−/− mice. TUNEL showed that indeed acid load-induced apoptosis of AICs in p53−/− mice but not in WT mice (Figure 3E). Altogether these findings reveal paradoxical proliferative and anti-apoptotic roles of p53 in the adaptation to acid loading.
2.3 Role of AMPK in acid-induced expression of p53 and Gdf15 and proliferation of AICs
Because AMPK is known to activate p5327, 28 and to participate in the renal adaptation to an acid load11, 12, we investigated its possible involvement in acid-induced expression of p53 and proliferation of AICs. Immuno-histochemistry on medullary sections of snap-frozen kidney indicates that acid-loaded mice showed increased phosphorylation of AMPK on Thr172, a site common to the α1 and α2 isoforms of the catalytic subunit of AMPK (Figure 4A). Acid load also induced the phosphorylation of the AMPK target acetyl-CoA carboxylase,29 mainly in AICs (Figure 4B).
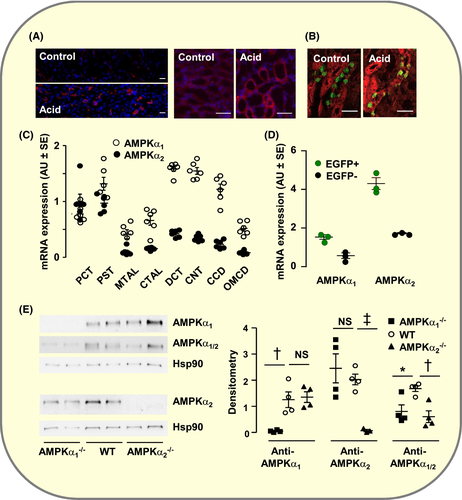
Although a previous report failed to show the expression of AMPK α2 in rat kidneys,30 AMPKα1 and AMPKα2 mRNAs were detected along the whole nephron, and within the kidney medulla, they were expressed both in EGFP-positive and -negative cells (Figure 4C,D). The expression of AMPKα1 and AMPKα2 in OMCD was confirmed by western blot (Figure 4E). Importantly, genetic deletion of either AMPKα1 or AMPKα2 did not alter significantly the expression level of the remaining isoform in OMCDs (Figure 4E). This absence of compensatory adaptation suggests that the two isoforms of AMPK catalytic subunit play non-redundant functions and it allowed determining these functions using isoform-specific knockout animals.
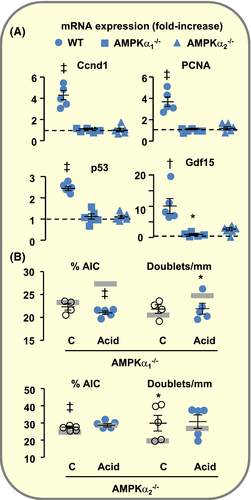
Genetic deletion of either AMPKα1 or AMPKα2 prevented the induction of p53 expression by acid loading and markedly reduced that of Gdf15 (Figure 5A). Accordingly, the over-expression of Ccnd1 and PCNA mRNAs (Figure 5A) and the proliferation of AICs were blunted (Figure 5B). It is noteworthy, however, that under basal conditions, OMCDs from AMPKα2−/− but not AMPKα1−/− mice displayed a higher number of AICs than WT mice. Despite this high abundance of AICs, AMPKα2−/− mice showed an impaired ability to maintain acid/base homeostasis in response to acid loading as their blood pH was lower than in WT mice (pH in Units ±SE: WT, 7.12 ± 0.01 (n = 33); AMPKα2−/−, 7.05 ± 0.01 (n = 9); P > .025), suggesting that the acid secreting capacity of individual AICs was impaired in these animals. Alike Gpr4−/− mice, AMPKα1−/− mice, but not AMPKα2−/− mice, displayed a marked hypercapnia (pCO2 in mm Hg ± SE: WT, 49.5 ± 1.2 (33); AMPKα1−/−, 67.8 ± 5.1 (9), P < .001; AMPKα2−/−, 49.3 ± 1.8 (11), NS). This is likely related with the role of AMPKα1 in the control of ventilation.31 Altogether these findings demonstrate that the two isoforms of AMPK catalytic subunit participate in acid load-induced expression of Gdf15 and proliferation of AICs but play different roles.
2.4 Molecular cascade linking Avpr2 activation with Gdf15 expression
Avpr2 is coupled to cAMP-dependent activation of protein kinase A which is known to phosphorylate and activate Na,K-ATPase in collecting duct PCs.32 Na,K-ATPase is the main ATP consumer in PCs and its activation may, therefore, be responsible for the activation of AMPK. We, therefore, investigated whether cAMP-dependent activation of Na,K-ATPase is a pre-requisite to acid load-induced expression of Gdf15.
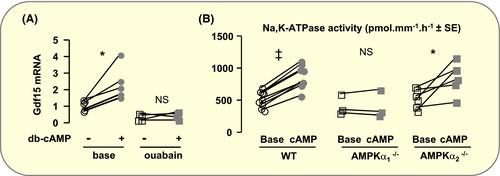
In vitro incubation of OMCDs from WT mice with a membrane permeant analogue of cAMP increased significantly the expression of Gdf15 mRNAs within 3 hours, and this effect was abolished in the presence of the Na,K-ATPase inhibitor ouabain (Figure 6A). We confirmed that cAMP increases Na,K-ATPase activity within 15 minutes and found that this effect was suppressed in OMCDs from AMPKα1−/− but not AMPKα2−/− mice (Figure 6B). Altogether, these results indicate that AMPKα1 is necessary for cAMP-dependent activation of Na,K-ATPase. Therefore, activation of AMPKα2 occurs beyond the stimulation of Na,K-ATPase in the signalling cascade linking cAMP to Gdf15 expression.
2.5 Effects of Gdf15 on AICs
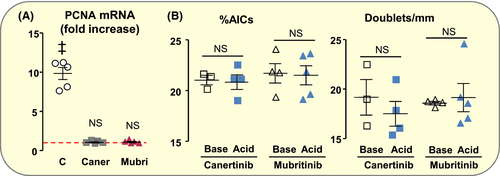
The nature of Gdf15 receptor has remained elusive even though some studies suggested the involvement of EGF/ErbB receptor family.33, 34 Recently, however, several groups identified GFRAL, an orphan receptor of the GDNF receptor family, and the tyrosine kinase co-receptor Ret as the receptor of Gdf15 in the brain.35 Confirming a recent report,36 PCR analysis failed to show expression of GFRAL mRNAs in OMCD and in whole kidney (data not shown). We, therefore, evaluated the involvement of ErbB receptors in acid load-induced proliferation of AICs. Canertinib, a non-selective inhibitor of ErbB1, 2 and 4,37 and Mubritnib, a selective ErbB2 inhibitor,38 abolished acid load-induced over-expression of PCNA mRNAs (Figure 7A) and fully prevented acid load-induced proliferation of AICs (Figure 7B). This indicates that ErbB2 mediates the proliferating role of Gdf15 in AICs.
One of the functions of p53 is to control the progression of the cell cycle through the checkpoint at the G1-S transition via the induction of anti-proliferative genes. We found that acid load also induced the expression of anti-proliferative genes in OMCDs, and that this effect was blunted in p53−/− mice (Figure 8A), suggesting that besides its proliferative role through induction of Gdf15 in PCs, p53 also plays its classical role of cell cycle gatekeeper in AICs. Interestingly, acid-induced expression of p53 was reduced in Gdf15−/− mice and that of its anti-proliferative target genes was abolished (Figure 8A). Altogether, these results reveal dual roles of p53 in the control of AICs proliferation and a cross talk between p53 and Gdf15: On the one hand, acid load increases p53 expression which in turn induces Gdf15 expression in PCs. On the other hand, Gdf15 or the subsequent entry of AICs in the cell cycle triggers the expression of p53 and of anti-proliferative genes which negatively control the progression of AICs cycle. This raises the question of the mechanisms that relieve this blockade and allow the cell cycle to progress towards mitosis.
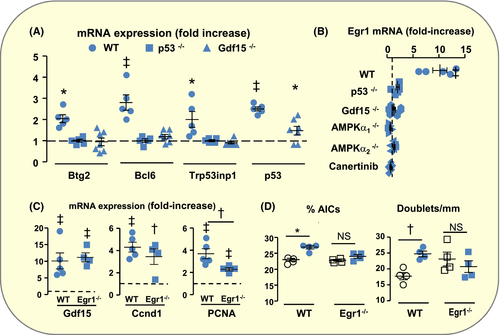
Among many functions, early growth response protein 1 (Egr1) is involved in the control of cell cycle progression through the restriction point at the G1-S transition.39 Because a former transcriptome analysis revealed an over-expression of Egr1 in OMCDs from acid-loaded mice,14 we investigated the role of Egr1 in acid-induced proliferation. We confirmed the over-expression of Egr1 mRNAs in OMCDs from acid-loaded mice and found that it was abolished in p53−/−, Gdf15−/−, AMPKα1−/−, AMPKα2−/− and canertinib-treated mice (Figure 8B), suggesting that it is related to the cell cycle entry. Genetic deletion of Egr1 did not prevent acid-induced expression of Gdf15 and Ccnd1 but reduced that of PCNA (Figure 8C) and blunted the proliferation (Figure 8D), indicating that the absence of Egr1 does not alter cell cycle entry but blocks its progression towards mitosis.
3 DISCUSSION
This study shows that acid load-induced production of Gdf15 in collecting duct originates from PCs through the activation of Avpr2 vasopressin receptor and a signalling cascade involving the two isoforms of AMPK catalytic subunit, Na,K-ATPase and p53 (Figure 9). In turn, Gdf15 induces proliferation of AICs via the activation of ErbB2 receptors.
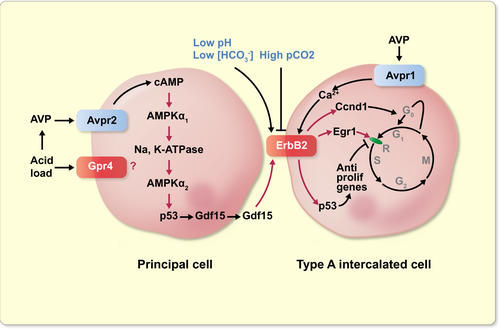
That AVP and PCs participate in the control of acid-base homeostasis represents a paradigm shift since up to now AVP and PCs were known to participate in sodium, potassium and water homeostasis only. A similar paradigm shift was attained when intercalated cells, initially thought to participate exclusively in the control of acid-base homeostasis, were shown to transport sodium.40, 41 Given the plurality of ion transport capacities of the different the collecting duct cells, the independent control of the excretion of sodium, chloride, potassium and acid is possible only if regulations of the transport activities in the different cell types are coordinated, ie if the different cell types communicate with each other. Autocrine/paracrine factors are key modulators of kidney function.42 A paracrine cross talk between type B intercalated cells and principal cells via prostaglandin E2 has been demonstrated previously; it is responsible for the salt-losing nephropathy associated with distal tubule acidosis.43 In the present report, we describe a cross-talk mechanism between PCs and AICs via Gdf15 which is requisite for acid-base homeostasis.
The plasma concentration of AVP in acid-loaded mice was not determined in the present study. However, it has been reported that feeding mice with a NH4Cl-rich diet increased the plasma concentration of AVP and the mRNA level of the preprohormone in the brain.23 The trigger of increased AVP secretion (acidosis and/or osmotic load) remains debated.23, 44 Importantly, it has been shown that AVP release by supra-optic and paraventricular nuclei is stimulated by decreasing blood pH or increasing blood pCO2 through the direct stimulation of central and peripheral chemoreceptors.29 Importantly, present results showed that AVP-induced secretion of Gdf15 is independent of the osmotic load associated with the NH4Cl treatment, and reversely that an osmotic load without associated acidosis does not stimulate Gdf15 production.
Avpr2 is coupled to plasma membrane adenylyl cyclase and generation of cAMP which in turn induces Gdf15 expression (Figure 6A). Curiously, acid-activated Gpr4 is also expressed in PCs (Figure 1B) and is coupled to cAMP signalling20 but it does not participate in the control of Gdf15 expression, since acid load-induced expression of Gdf15 was abolished in tolvaptan treated but not in Gpr4−/− mice (Figure 2B). This suggests the presence of different cAMP compartments within PCs, as reported in other cell types.45 Also puzzling is the fact that acid load-induced expression of acid/base transporters in AICs and proliferation of AICs are blunted in Gpr4−/− mice [21 and Figure 2A], although Gpr4 is not expressed in AICs (Figure 1B). This suggests that genetic deletion of Gpr4 indirectly alters AICs functions, possibly through a humoral effect (see below).
The role of PCs in Gdf15 secretion appears no longer paradoxical if one considers that Gdf15 is not exclusively involved in acid/base homeostasis but more generally if it is responsible for the cellular homeostasis of the collecting duct, ie the percentage of its different constitutive cell types. Gdf15 would control the proliferation of AICs and/or PCs, depending on the physiological conditions: in the context of metabolic acidosis, Gdf15 mainly stimulates the proliferation of AICs,8 whereas in absence of acidosis, ie in response to dehydration or administration of AVP, it mainly triggers the proliferation of PCs in the collecting duct.6 This pre-supposes that metabolic acidosis sensitizes AICs and desensitizes PCs to the proliferating action of Gdf15, and that dehydration desensitizes AICs to Gdf15. The mechanism of AICs sensitization during acidosis has not been investigated. However, it has been reported that CO2, pH and  independently modulate the phosphorylation of ErbB2 in the proximal tubule,46 and may thereby alter its sensitivity and/or its response to its substrate. Activation of ErbB2 by low pH or
  may be responsible for the sensitization of AICs to Gdf15. Conversely, inhibition of ErbB2 by high pCO2 could explain the resistance of AICs to Gdf15 observed in hypercapnic Gpr4−/− mice. Sensitization of ErbB2 and AICs to Gdf15 may also be accounted for the over-expression of vasopressin V1 receptors (Avpr1) in AICs reported during acidosis47: Avpr1 is coupled to calcium signalling and Ca-calmodulin increases ErbB2 phosphorylation and activity.48 Synergistically, activation of Avpr1 in AICs also stimulates H+ secretion.49
Our results show that, besides the role of AMPK in the control of acid/base balance through its action on H-ATPase in AICs,12 the two isoforms of AMPK catalytic subunit are necessary for the induction of p53 and Gdf15 expression in PCs but play different roles. AMPKα1 is involved upstream the activation of Na,K-ATPase, whereas AMPKα2 is involved downstream (Figure 9). Activation of AMPK by cAMP has been reported previously in renal tubule cells50; it is possibly mediated via Epac and activation of CaMKKβ.51 Although AMPK reduces Na,K-ATPase activity in many tissues,52 an apparently paradoxical stimulatory effect was reported in skeletal muscle cells.53 Activation of AMPKα2 following stimulation of Na,K-ATPase may lead to a feedback inhibition of the pump and to the limitation of energy expenditure, the classical role of AMPKs. Opposite roles of the two AMPK catalytic unit isoforms were already reported in retinal pigmented epithelial cells.54 In turn, activation of AMPKα2 may induce p53 expression through phosphorylation of transcription factors.55-57 Induction of p53 expression may also stem from its AMPK-dependent activation because p53 trans-activates its promoter.58, 59 Several AMPK-dependent pathways can account for p53 activation, including phosphorylation of p53,60 acetylation of p5361 secondary to phosphorylation and inhibition of ACC or of the deacetylase sirtuin 1,27 or phosphorylation and inhibition of the p53 inhibitory protein MDMX.62, 63
Growth factors are necessary at the beginning of the cell cycle to induce the G0-G1 transition and the metabolic adaptations allowing the duplication of cellular components, and also to trigger a p53-dependent negative control on the cell cycle progression at the G1-S transition. They are also necessary at the end of the G1 phase to relieve this p53-dependent blockade of the cell cycle and to induce the expression of Egr1 which controls the S phase entry independently of the p53 gating.39 Based on this model, Gdf15 can be considered as a growth factor rather than a tumour suppressor in AICs since it triggers cell cycle entry through the induction of Ccnd1,8 it promotes the implementation of the G1-S checkpoint through the induction of p53 (Figure 8A) and it participates in the relief of this checkpoint through the induction of Egr1 (Figure 8B).
This study also reveals dual roles of p53: in response to its induction by AMPK in PCs, it exerts a proliferative action via the induction of Gdf15 (Figure 3C,D), whereas through its induction by Gdf15 in AICs (or the subsequent entry in the cell cycle) it induces anti-proliferative genes (Figure 8A). This raises the question of whether AMPK and Gdf15 induce the expression of the same isoforms of p53. Interestingly, it has been reported that the human Δ133p53 isoform which lacks the N-terminal domain of p53 antagonizes the pro-apoptotic effect of full-length p53.64 Our results also suggest that p53 exerts an anti-apoptotic role (Figure 3E). However, this last effect is likely indirect. Deletion of Gdf15 abolishes the early Gdf15-dependent phase of acid-induced AICs proliferation and anticipates the late one.8 Late Gdf15-independent proliferation of AICs is associated with marked cellular hypertrophy,8 which may be a stimulus of apoptosis.65, 66 The early induction of Ccnd3 observed in OMCDs from acid-loaded p53−/− mice (data not shown) suggests that the late proliferative/hypertrophy phase is anticipated, which might have been the signal for apoptosis.
Because cell proliferation is an energy-consuming process and a potential source of genetic alteration, it should logically be down-regulated by AMPK and p53, the main function of which is to protect cells against metabolic and genotoxic stresses respectively. Nonetheless, the proliferative effects of AMPK and p53 uncovered in this study also appear teleologically sound since they protect AICs against the damages that would result from the prolonged activation of H-ATPase necessary to achieve body homeostasis in response to a sustained acid load. Indeed, proliferation of AICs allows distributing proton secretion over a larger number of cells and thereby decreases the workload and energy expenditure of individual cells. Within this process, AMPKα1 appears as a molecular switch that turns off the energy consumption of individual cells and turns on cell division. Whether this function is specific to AICs or whether it may apply to other renal tubular cells or other quiescent cells/tissues that can adaptively proliferate, such as hepatocytes, remains to be explored. Interestingly, hepatocyte proliferation induced by liver mass reduction is associated with increased Gdf15 production and is delayed in AMPKα1−/− mice.67, 68
4 METHODS
4.1 Animals
Experimental protocols were approved by the Darwin's Ethic Committee and the French Ministère de la Recherche (Projects # 6532 & 7651) and by the Massachusetts General Hospital Subcommittee on Research Animal Care. All experiments were performed on male mice weighing 20-30g. A colony of Gdf15−/− (C57BL/6J background) is maintained in our animal facility since 10 years by breeding Gdf15+/− heterozygous mice. Ancestor mice were generated and provided by SJ Lee.67 A colony of p53−/− mice (C57BL/6J background) was established by breeding p53+/− heterozygous mice kindly provided by JP de Villartay (INSERM U768l); they derive from a colony generated by Jacks.69 A colony of Gpr4−/− mice (C57BL/6J background) was established by breeding Gpr4+/− heterozygous mice kindly provided by L Yang (East Carolina University); they derive from a colony generated by O Witte.70 Egr−/− and Egr+/+ mice (C57BL/6J background) were provided by S. Laroche (CNRS UMR 8195); they derive from the colony generated by P. Topilko.71 Colonies of AMPKα1−/− and AMPKα2−/− (C57BL/6J background) were generated by B. Viollet72, 73 and bred at Cochin Institute. B1-EGFP mice expressing enhanced green fluorescent protein in intercalated cells under the promoter of the V-ATPase B1 subunit24 were provided by R Chambrey (Centre de Recherche des Cordeliers); they derive from the colony generated by S Breton (Massachusetts General Hospital/Harvard Medical School). Control (WT) mice were either commercial C57BL/6J mice (Charles River) or littermate homozygous +/+ mice from the different strains; there was no difference between these mice and results were pooled. Animals were fed ad libitum standard or NH4Cl-rich jelly diets (6 mL water or 0.7 mol/L NH4Cl, 0.2 g agar, 5 g A04 chow (SAFE, France)) and had free access to tap water. Animals were studied 1 to 3 days after the onset of NH4Cl feeding. Some animals were treated with Tolvaptan (SelleckChem, 25mg/kg/day through subcutaneous osmotic pump (Alzet 2001)), an antagonist of vasopressin V2 receptor (Avpr2) or with the ErbB antagonists Canertinib (Selleckchem, 60 mg/kg/day by intraperitoneal injection started the day before acidosis) or Mubritinib (Selleckchem, 8 mg/kg/day given twice daily by gavage). Acid-base blood parameters were analysed (ABL 30, Radiometer or Epoc, Epocal) on blood samples collected from the retro-orbital sinus (90 µL heparinazied capillary tubes) on non-anesthetized mice.
In some mice, acidosis was induced by feeding them a HCl-enriched diet (6 mL 0.4 mol/L HCl, 5 g A04 chow) and, in another group, a NaCl load was induced (NaCl 8% in food). These animals, as well as a group of WT and Gdf15−/− NH4Cl-loaded mice, along with their controls, were placed on individual metabolic cages and urine was collected daily. Blood was collected (retro-orbital puncture in 90 µL heparinazied capillary tubes) for determination of acid-base blood parameters. Gdf15 concentration was determined by ELISA (rat/mouse Gdf15 quantikine ELISA kit, MGD150, R&D Systems) according to the manufacturer's protocol.
4.2 Microdissection of OMCD
OMCDs were dissected from liberase-treated kidneys as previously reported.74 Briefly, the right kidney was perfused in situ via the abdominal aorta with 5 mL of dissection solution (Hank's solution supplemented with 1 mmol/L glutamine, 1 mmol/L pyruvate, 0.5 mmol/L MgCl2, 0.1% bovine serum albumin, 20 mmol/L HEPES, pH 7.4) containing 0.012% liberase (Blendzyme 2; Roche Diagnostics, Meylan, France). Thin pyramids were cut from the kidney, incubated in dissection solution containing 0.005% liberase for 20-25 minutes at 30°C, and thoroughly rinsed in dissection solution. For RNA extraction, all media were prepared and used in an RNase-free environment, and for western blot analysis anti-proteases (Easypack, Roche) were added during microdissection. OMCDs were dissected within the outer medulla (outer and inner stripe). In some animals, the left kidney was quickly removed and frozen in liquid nitrogen just after anaesthesia. In others, it was perfused with 4% paraformaldehyde, included in OCT and frozen in liquid nitrogen.
4.3 Isolation of AICs
AICs were isolated as previously described75 from B1-EGFP transgenic mice which express EGFP under the promoter of the V-ATPase B1 subunit.24 Briefly, after anaesthesia, the blood was flushed out, kidneys were excised and their medulla was dissected, sliced and minced in RPMI 1640 medium containing collagenase type I (Invitrogen, 1.0 mg/mL), collagenase type II (Sigma-Aldrich,1.0 mg/mL) and hyaluronidase (Sigma-Aldrich, 2 mg/mL), and digested for 45 minutes at 37°C. Following digestion, the mixture was passed through a 70µm nylon filter. The filter was rinsed with 5-7 mL of RPMI 1640 medium containing 10% FBS. The tissue mixture was centrifuged at 500 g for 10 minutes and the supernatant was removed. The pellet was suspended for 4 minutes in 5 mL ACK lysis buffer (Lonza, Colmar, France) in order to lyse remaining red blood cells. Cell preparations were then washed twice with calcium free-PBS (dPBS), re-suspended in 1 mL dPBS and passed through the 35 µm cell strainer cap of 5 mL tubes. The samples were directly submitted, to FACS. After sorting, GFP-negative cells were centrifuged 5 minutes at 850 g and the pellet was suspended in 350 µL RNA lysis buffer (RNeasy Micro Kit, Qiagen) with β-mercaptoethanol. GFP-positive cells were directly collected in the same lysis buffer added with RNA carrier. Samples were stored at −80°C until RNA extraction according to the manufacturer's protocol.
4.4 Immuno-labelling of AICs on isolated OMCDs
AICs were characterized by the presence of the kidney anion exchanger kAE1 (Slc4a1) at their basolateral pole. Pools of 15-20 short (0.2-0.4 mm) OMCDs were transferred to Superfrost Plus glass slides, rinsed twice with Ca2+- and Mg2+-containing PBS, and fixed for 15 minutes with paraformaldehyde (4% in Ca-Mg-PBS). Afterwards, they were rinsed once with Ca-Mg-PBS and twice with PBS, incubated 20 minutes in 100 mmol/L glycine in PBS, rinsed with PBS, permeabilized for 30 sec with 0.1% triton X-100 in PBS and rinsed twice in PBS. Antigen unmasking was achieved by incubation for 5 minutes in SDS 1% followed by three rinsing. After blocking with PBS containing 1% BSA for 30 minutes at room temperature, slides were incubated overnight in a humidified chamber at 4°C with the primary antibody (anti-AE1 1/500; gift from CA Wagner) diluted in PBS-BSA 1%. Slides were rinsed once with PBS-Tween 0.05% and twice with PBS and incubated 1h in the dark with the secondary antibody (TRITC-coupled anti-rabbit IgG, 1/500, Jackson ImmunoResearch) and DAPI (1/1000, Sigma Aldrich). After rinsing in the dark, slides were mounted with Vectashield and observed by confocal microscopy (x25, slice spacing 1.3 µm, Zeiss observer.ZI, LSM710).
4.5 Index of AIC proliferation
Because AICs account for less than 5% of medullary cells and because their acid-induced proliferation is a rare event, quantification of such events by counting Ki67- or PCNA-positive AICs on kidney sections is fastidious and time consuming.8 We, therefore, developed an alternative method based on the assumption that, shortly after mitosis, daughters AICs remain contiguous. We, therefore, quantified the number of doublets of AICs (AE1-positive cells) per unit tubular length. Because acid load induces preferential proliferation of AICs in OMCD,8 it increases their proportion; we, therefore, also quantified the percentage of AICs.
Images of AE1-labelled OMCDs acquired by confocal microscopy were processed using ImageJ: the image of an undamaged OMCD portion (length ~200-300 µm) was selected and straightened along the tubule axis. A 3D construct was generated from all stacks with the possibility to rotate the reconstructed tubule around its longitudinal axis (Figure 10A). This allowed determining the length of the tubule and visualizing the relative position of AE1-positive cells (adjacent or separated). The total numbers of nuclei (DAPI staining), AICs (AE1 staining) and AICs doublets were counted. Five to eight tubules per animal were analysed and mean values were calculated. Data are means from several mice.
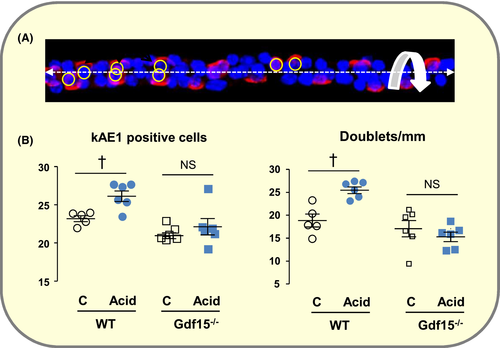
Using this method we confirmed previous observations based on Ki67 labelling on kidney sections8: Acid loading increased the number of AICs doublets and the percentage of AICs in OMCD from WT but not Gdf15−/− mice (Figure 10B). Calculations show that the increased number of AICs present in doublets in acid-loaded WT mice (13.4 AICs/mm) is similar to the number of Ki67-positive cells calculated from data previously published8 and from the number of AICs counted in this study (15 AIC/mm). These data validate the use of the number of AICs doublets as a quantitative index of their proliferation.
4.6 TUNEL assay on isolated OMCDs
Apoptotic cells were identified by TUNEL (DeadEndTM Fluorometric TUNEL system, Promega) in combination with kAE1 labelling. The AE1 labelling was performed as described above except for the fixation with PFA (25 minutes at 4°C), the absence of glycine incubation step and for the triton permeabilization step (0.2%, 5 minutes). After the secondary antibody labelling, the TUNEL assay was performed as recommended by the manufacturer and briefly described here. Slides were incubated 10 minutes at room temperature in Equilibrium Buffer, then 1h in a humidified chamber at 37°C in rTdT enzyme mix, rinsed twice for 15 minutes at room temperature in the dark in SCCx2 and thrice in PBS. Slides were mounted with Vectashield and observed on confocal microscope (x25, Zeiss observer.ZI, LSM710). Microscopic images were processed as described in the Method section to determine the number of kAE1-positive and -negative cells (ICs and PCs respectively) and the number of TUNEL-positive AICs and PCs.
4.7 mRNA extraction and RT-PCR analysis
RNAs were extracted using an RNeasy micro-kit (Qiagen) according to the manufacturers’ protocols, from isolated AICs or from pools of ~50 OMCDs, the total length of which was determined by image analysis (Visilog, Noesis). RNAs were reverse transcribed using the first-strand cDNA synthesis kit for RT-PCR (Roche Diagnostics), according to the manufacturer's protocol. Real-time PCR was performed on a LightCycler (Roche Diagnostics) with the LightCycler FastStart DNA Master SYBR Green 1 kit (Roche Diagnostics) according to the manufacturer's protocols, except that the reaction volume was reduced 2.5-fold. Specific primers (Table 1) were designed using LightCycler ProbeDesign 2 (Roche Diagnostics) or Primer 3 (free online software).
| Gene | Forward | Reverse |
|---|---|---|
| AE1 | 5′-ctctccattggtttctctgttac-3′ | 5′-ggagggaaccgatgacg-3′ |
| AMPKα1 | 5′-gggaaatgtaaggtgggc-3′ | 5′-tacagtttgatgtgagggt-3′ |
| AMPKα2 | 5′-tttgaaatgtgcgccagtc-3′ | 5′-gggaatgttcacaccaactt-3′ |
| Aqp2 | 5′-ctctccattggtttctctgttac-3′ | 5′-ggagggaaccgatgacg-3′ |
| Bcl6 | 5′-tttgtacatacctgtaatgtgtcctca-3′ | 5′-aggagtcaaacattcccaaaga-3′ |
| Btg2 | 5′-acgggaagagaaccgac-3′ | 5′-aaccagtggtgtttgtaatgat-3′ |
| Ccnd1 | 5′-agcggtagggatgaaa-3′ | 5′-ccatctgaatgcgtg-3′ |
| Gdf15 | 5′-gagctacggggtcgcttc-3′ | 5′-gggaccccaatctcacct-3′ |
| Gpr4 | 5′-ttctggtgccatctttgtgc-3′ | 5′-gggaacatcacaggagaca-3′ |
| PCNA | 5′-tgcatcgtgaatcggg-3′ | 5′-acgtgagacgagtcca-3′ |
| p53 | 5′-aggttcgtgtttgtgc-3′ | 5′-cgaagcgtttacgccc-3′ |
| Trp53inp1 | 5′-aggcaggaagagaagttactat-3′ | 5′-cctcacaaatcacggtttgg-3′ |
PCR was performed with cDNA quantity corresponding to 0.1 mm of OMCD. No DNA was detectable in samples that did not undergo reverse transcription, and in blanks run without cDNA. In each experiment, a standardization curve was made using serial dilutions of a standard cDNA stock solution made from whole-kidney RNA. The amount of PCR product was calculated as per cent of the standard DNA (arbitrary unit/mm tubule length). Means from several animals were used for statistical comparison between control and acid loaded animals. Results are presented as acid-induced changes in mRNA levels.
4.8 In vitro effect of cAMP on Gdf15 expression and Na,K-ATPase activity
For measurement of Gdf15 mRNA expression, pools of ≈50 OMCDs were transferred on a bacteriological slide, incubated 3h at 37°C in absence or presence of 1 mmol/L dibutyryl-AMPc (db-cAMP) diluted in dissection buffer. Then, tubules were transferred in RNA lysis buffer (RNeasy micro kit, Qiagen) with β-mercaptoethanol and stored at −80°C until RNA extraction according to the manufacturer's instructions. For Na,K-ATPase activity, pools of 5 OMCDs were transferred in a bacteriological slide and incubated for 15 minutes at 37°C with or without 1 mmol/L db-cAMP in the absence or presence of 1 mmol/L ouabain. Tubules were, then, transferred in a 96-wells microplate and proceeded for Na,K-ATPase measurement as previously described.76
4.9 Immuno-histochemistry on kidney sections
Eight-μm cryosections of snap-frozen kidneys were transferred to Superfrost Plus glass slide and rinsed with Ca-Mg-PBS. For phospho-AMPK labelling, slides were fixed 30 minutes with 4% paraformaldehyde in Ca-Mg-PBS rinsed in PBS, treated for 3 minutes with 0.1% triton X-100 in PBS, rinsed twice with PBS, incubated for 4 minutes with 1% SDS in PBS and rinsed thrice with PBS. For phospho-ACC labelling, slides were incubated in citrate buffer (10 mmol/L, pH 6.0) for 10 minutes at 95°C and then for 30 minutes at room temperature and treated with triton as above. After blocking 30 minutes at room temperature in PBS containing goat serum (5%) and 1% BSA, slides were incubated overnight at 4°C with either anti-phosphoThr172-AMPK antibody (Cell Signaling, 1:200) or anti-phospho-ACC antibody (Thermo Scientific, 1:400), rinsed once with PBS-Tween 0.05% and twice with PBS. Slides were incubated in the dark for 1h at room temperature with TRITC-coupled anti-rabbit IgG (Jackson Immunoresearch, 1:500). After rinsing, slides were mounted with Vectashield and observed on a confocal microscope (Zeiss observer Z1, LSM 710).
4.10 Preparation of nuclear extracts and p53 immuno-blotting
After anaesthesia, kidneys were quickly removed and transferred in PBS with protease inhibitor (Complete Tablets, EDTA-free, Easy-pack, Roche). The medulla was dissected, minced and centrifuged for 5 minutes at 500g. The supernatant was carefully removed and cytoplasmic and nuclear protein extracts were prepared according to the manufacturer protocol (NE-PER Nuclear and Cytoplasmic Extraction Reagents, Thermo Scientific). Protein concentration was measured using the classical Bradford method. Twenty μg of nuclear protein was solubilized at 95°C for 5 minutes in Laemmli buffer and stored at −20°C until use. Proteins were separated by SDS-PAGE on 10% polyacrylamide gel and electro-transferred on nitrocellulose membrane (Bio-Rad). After blocking for 1h at room temperature in TBS-Tween 0.1% containing 5% non-fat dried milk, the membrane was incubated overnight at 4°C with anti-p53 antibody (Cell Signaling, 1:1000 in TBS-Tween 0.1% containing 5% non-fat dried milk), rinsed three times with TBS-Tween 0.1% and incubated 1h at room temperature with horseradish peroxidase-linked anti-mouse antibody (1:10,000, Bio-Rad). After rinsing three times, the membranes were revealed by an enhanced chemiluminescent detection kit (Pierce ECL Western Blotting Substrate, Thermo Scientific). Densitometry of the different bands was quantified using ImageJ.
4.11 Western blot analysis of AMPK on isolated OMCDs
Pools of 200 OMCDs were rinsed with BSA-free dissection medium. The tube was centrifuged, the supernatant was removed and the tubules were disrupted in lysis buffer containing protease inhibitors (Easypack, Roche). Proteins were separated by SDS-PAGE and transferred to a nitrocellulose membrane. Blots were probed successively with antibodies against either AMPKα1 or AMPKα2, total AMPKα and Hsp90 (Cell Signaling). Horseradish peroxidase-conjugated anti-IgG (Cell Signaling Technology) was used as secondary antibody. Membranes were developed using a chemiluminescence system (ECL detection reagent). Densitometry analysis was done using ImageJ.
4.12 Statistics
Statistical analysis was performed using Prism 8. For normally distributed data, we used Student's t-test (either unpaired or paired as appropriate) when comparing two groups or ANNOVA when comparing more groups. When data distribution was not normal (~5% of the groups), we used non-parametric tests, either Mann-Witney (unpaired data) or Wilcoxon (paired data) when comparing two groups of Kruskal-Wallis when comparing more groups.
ACKNOWLEDGEMENTS
Authors are grateful to S. Breton (Massachusetts General Hospital, Harvard Medical School, Boston) for her support in isolation of AICs, to S. Laroche (CNRS UMR 8195, Orsay, France), J.-P. de Villartay (INSERM U768l, Paris, France) and O. Witte (University of California) for providing Egr1−/−, p53−/− and Gpr4−/− mice, respectively, to CA Wagner (Institute of Physiology, Zurich, Switzerland) for giving the anti-AE1-antibody, and to A. Edwards (Centre de Recherche des Cordeliers) for constructive reading of the manuscript. We also thank the genotyping and biochemical facility (Centre de Recherche des Cordeliers) for mice genotyping.
CONFLICT OF INTEREST
Authors declare that they have no conflict of interest.
Open Research
DATA AVAILABILITY STATEMENT
The data that support the findings of this study are available from the corresponding author upon reasonable request.


