Structure–function correlation of retinal photoreceptors in PRPH2-associated central areolar choroidal dystrophy patients assessed by high-resolution scanning laser imaging and microperimetry
Abstract
Purpose
High Magnification Module (HMM™, Heidelberg Engineering, Heidelberg, Germany) imaging is a novel technique, designed to visualize the retina at a cellular level. To assess the potential of HMM™-based metrics as endpoints for future trials, we evaluated correlations between structural HMM™ cone metrics, spectral-domain OCT (SD-OCT, Heidelberg Engineering, Heidelberg, Germany) and retinal sensitivity on microperimetry (MP, MAIA, CenterVue, Padova, Italy) in healthy subjects and p.(Arg142Trp) PRPH2-associated Central Areolar Choroidal Dystrophy (CACD) patients.
Methods
We projected a default 10° MP grid on composite HMM™ images and performed automated cone density (CD), intercell distance (ICD) and nearest neighbour distance (NND) analysis at stimuli located at 3° and 5° retinal eccentricity. We manually measured intrasubject outer retinal thickness on SD-OCT in absolute and relative scotomas, located outside of focal atrophy.
Results
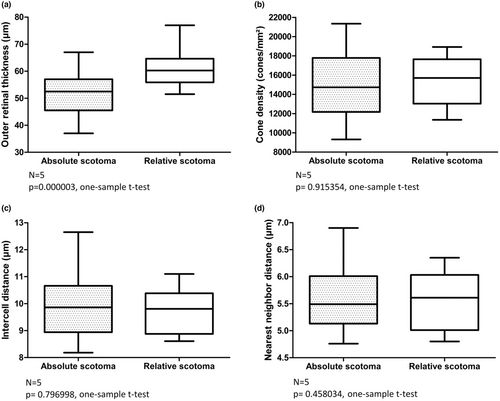
We included 15 CACD patients and five healthy subjects. We found moderate-to-strong correlations of HMM™ metrics and MP sensitivity at 3° eccentricity from the fovea. We found the outer retina at the locations of absolute scotomas to be statistically significant thinner (p = 0.000003, one-sample t-test), as the outer retinal thickness at locations of relative scotomas. Interestingly, HMM™ metrics of these areas did not differ significantly.
Conclusions
We found significant correlations between structural photoreceptors metrics on HMM™ imaging and retinal sensitivity on MP in healthy subjects and CACD patients. A multimodal approach, combining SD-OCT, MP and HMM™ imaging, allows for detailed mapping of retinal photoreceptor integrity and restitution potential, important data that could serve as biomarkers in future clinical trials.
1 INTRODUCTION
Sensitive monitoring of therapeutic effectiveness in inherited retinal diseases (IRDs) is critical for the clinical development of novel interventions (Thompson et al., 2020). Currently, the FDA and EMA favour functional and patient experience data as endpoints in therapeutical trials (Gordon et al., 2019; Thompson et al., 2020). Unfortunately, monitoring visual function for safety and efficacy in low-vision patients is difficult. Retinal imaging may be utilized as an additional endpoint to improve monitoring of therapeutic effectiveness (Csaky et al., 2017). It is important that the selection of such imaging techniques is based on the affected cellular target structure of the IRD in question. Since most IRDs are considered to be photoreceptor dystrophies, establishing correlations between photoreceptor structure and function may result in highly sensitive imaging biomarkers (Bird, 1995).
In PRPH2-related IRDs the abnormal expression of the protein may predominantly affect cones or may result in malfunction of both photoreceptor systems depending on the specific mutation. In dominantly inherited central areolar choroidal dystrophy (CACD), for instance, the p.(Arg142Trp) mutation largely affects the cones resulting in a dystrophy that is typically confined to the macula, whereas the p.(Arg172Trp) mutation affect both cones and rods leads resulting in a CACD phenotype that also involves the peripheral retina beside the macula (Boon et al., 2009; Michaelides et al., 2005).
Adaptive optics (AO) is a technology developed for astronomical telescopes where the image quality is improved by reducing the incoming wavefront distortions by deforming a mirror. Retinal imaging of IRDs via adaptive optics enables the visualization of structural, cellular alterations, which presumably underlie retinal dysfunction (Katie et al., 2017; Gill et al., 2019). Anatomical changes of the cone photoreceptor mosaic can be quantified via several metrics, such as cone density (CD), intercell distance (ICD) and nearest neighbour distance (NND). The cellular nature of these biomarkers facilitates early detection of disease progression and could theoretically be used to measure treatment efficacy of novel therapies in clinical trials (Kortüm et al.; Talcott et al., 2011). Although cellular biomarkers may be sensitive enough to monitor photoreceptor changes in a short time span, the relative high costs and technical complexity of AO currently limits widespread usage of cone metrics as trial endpoints (Burns et al., 2019; Gill et al., 2019).
The High Magnification Module (HMM™ Heidelberg Engineering, Heidelberg, Germany) is a novel imaging modality that makes single cell imaging broadly available by equipping a scanning laser ophthalmoscope with an exchangeable lens. It is relatively low tech, does not involve complex AO systems and offers an increased magnification of commonly used infrared (IR) fundus images. We recently were able to show that HMM™ imaging and computer-assisted analysis of HMM™-based cone metrics can be performed in a reliable manner and that may be used as feasible endpoints in trials (Mulders, Dhooge, et al., 2021; Mulders, Klevering, et al., 2021).
In order to assess this potential of HMM™-based cone metrics, we evaluated correlations between automatically calculated HMM™ cone density and spacing metrics and retinal sensitivity on microperimetry (MP) in healthy subjects and p.(Arg142Trp) PRPH2-associated CACD patients.
2 MATERIALS AND METHODS
We conducted this study according to the tenets of the Declaration of Helsinki and participants provided written informed consent before inclusion in the study. Our study population consisted of CACD patients with a c.424C > T p.(Arg142Trp)) mutation in the PRPH2 gene and healthy participants from the biobank of the department of Ophthalmology, Radboud University Medical Center. We performed all study measurements on both eyes of all participants.
2.1 Microperimetry and imaging protocol
We conducted MP testing via Macular Integrity Assessment (MAIA; CenterVue, Padova, Italy), utilizing a default grid covering the central 10 degrees of the macula. Testing was performed using a 4–2 strategy with a stimulus duration of 200 ms. Stimulus size of the MP was equal to the diameter of a Goldmann II stimulus (0.431 degree × 0.291 mm = 125 μm). We included subjects with fixation during MP examination stable enough to allow reliable results, that is, stable to relative unstable fixation (Alexander et al., 2012). Participants with false-positive responses of more than 25% during the examination were excluded from this study (Wu et al., 2013). We performed HMM™ imaging according to a previously described imaging protocol (Mulders et al. 2021). In brief, we entered corneal curvature measurements (Nidek Tonoref II, NIDEK CO., LTD. Gamagori, Japan) in the system prior to imaging and used external illumination to induce pupil constriction. We used Spectralis™ HMM™ to capture 8 × 8 degrees ART™ images at the central, superior, inferior, temporal and nasal gaze direction, by correspondingly adjusting the preinstalled fixation light and scanning direction of Spectralis™. If participants used corrective glasses, these were worn during HMM™ imaging. HMM™ images of various gaze directions were aligned and stitched together in Fiji, using OCT cube overlay to mark the anatomical location of the fovea on composite HMM™ images via BigWarp plugin. Concentric circles ranging from one to ten degrees were automatically drawn and centred on the fovea, using the Concentric Circles plugin. Patients also underwent 30 degrees autofluorescence (AF) imaging (Spectralis™, Heidelberg Engineering GmbH, Heidelberg) to identify regions of retinal pigment epithelium (RPE) atrophy. In addition, we evaluated retinal structure on high-resolution 10 × 10 degrees OCT-scans (Spectralis™, Heidelberg Engineering GmbH, Heidelberg), with a distance between B-lines of 6 μm. We manually measured intrasubject outer retinal thickness on SD-OCT in absolute and relative scotomas, located outside of focal atrophy. We defined outer retinal thickness as the distance between RPE/Bruch membrane and external limiting membrane (ELM) (Staurenghi et al., 2014).
2.2 Image processing
We placed an AF-based mask over the composite HMM™ images to ensure that automated cone analysis was not conducted within atrophic areas, because of the unfavourable signal-to-noise ratio and lack of unambiguous cone mosaics in these regions (Chen et al., 2011; Mulders, Dhooge, et al., 2021; Mulders, Klevering, et al., 2021). We created the AF-masks via the Regionfinder™ software (Heidelberg Engineering, Heidelberg, Germany), which allows semiautomated demarcation of retinal pigment epithelium (RPE) atrophy on AF imaging (Schmitz-Valckenberg et al., 2011). We aligned the AF-based masks and composite HMM™ images in Fiji via BigWarp Plugin, using major blood vessels as reference points.
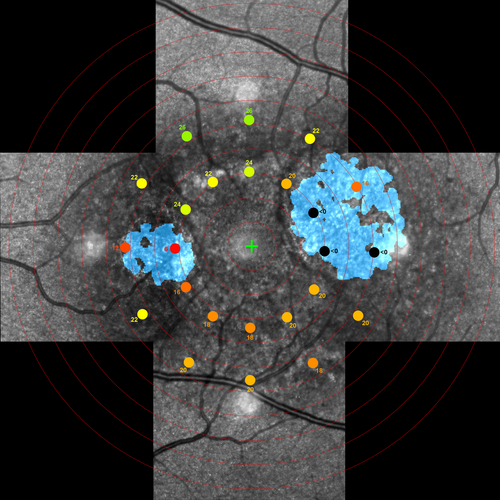
Likewise, we used the BigWarp plugin to align AF-masked HMM™ composite images with MP stimulus maps (Figure 1). After projecting all MP stimulus locations on the masked composite HMM™ image, we selected all stimuli located at approximately 3 and 5 degrees of foveal eccentricity. We fitted the largest possible square ROI within the circular stimuli, to ensure all analysed cones were located within the stimulated retinal area. This resulted in ROIs of ~85 × 85 μm. To enhance cone signals in ROIs, we utilized a previously described high-pass HMM™ filter (Mulders, Dhooge, et al., 2021; Mulders, Klevering, et al., 2021). Cones located on the edge of the ROI were automatically excluded from analysis. Also, ROIs containing blood vessels were excluded from analysis.
We performed computer-assisted cone density (CD), intercell distance (ICD) and nearest neighbour distance (NND) measurements according to previously described protocols (Mulders, Dhooge, et al., 2021; Mulders, Klevering, et al., 2021). We calculated CD by dividing the number of maxima within a ROI by the size of the corresponding ROI in mm2 and Delaunay triangulation was performed to analyse ICD and NND.
2.3 Statistical analysis
We averaged cone metrics and retinal sensitivity of both eyes of each participant if located at similar quadrants, based on eccentricity (3 or 5 degrees) and meridian (superior, inferior, temporal or nasal). To identify potential relationships between CD, ICD, NND and macular sensitivity at each retinal quadrant, we pooled data from the patients and healthy subjects and calculated Pearson's correlation coefficients. All manual outer retinal thickness measurements on SD-OCT were conducted twice by the same grader and Bland–Altman analysis was performed to assess measurement reliability. We used the average thickness of both measurements for our final analysis. Normality of data was assessed via Kolmogorov–Smirnov test.
3 RESULTS
3.1 Patients
We included 15 CACD patients with a p.(Arg142Trp) mutation in the PRPH2 gene. The left eye of CACD patient 9 was excluded due to amblyopia. Mean (95% CI) age of the patients was 57.8 (52.7–62.9) years. As controls, we included five healthy subjects with a mean (95% CI) age of 51.4 (46.9–55.9) years. We processed a total of 936 ROIs, of which 724 were located at 3 or 5 degrees. Of 724 ROIs, we excluded 233 ROIs due to co-location with a blood vessel and 5 ROIs because of projection outside of the range of our composite HMM™ image. Finally, 41 of the remaining 486 ROIs were co-located with RPE atrophy considering the AF-based masks. We eventually included a total of 445 ROIs in our automated analysis.
3.2 Structure–function analysis
All correlations between CD, ICD, NND and macular sensitivity reached statistical significance at 3 degrees and are presented in Table 1. In the inferior meridian at 3 degrees, data of 11 CACD patients and five healthy subjects were available. In the nasal meridian at 3 degrees data of 14 patients and 5 healthy subjects were available. And in the temporal and superior meridian at 3 degrees data of 15 CACD patients, and five healthy subjects were available. With exception of the inferior meridian with a Pearson r of 0.484 (p = 0.049228) and −0.574 (p = 0.015396) for respectively CD and ICD, correlations between structural HMM™ metrics and macular sensitivity at 5 degrees eccentricity from the fovea failed to reach statistical significance. Data of 11 CACD patients and four healthy subjects were available at 5 degrees in the inferior meridian. In the nasal meridian at 5 degrees data of 13 CACD patients and five healthy subjects were available. In the superior and temporal meridian at 5 degrees data of 12 CACD patients and five healthy subjects were available.
| Inferior meridian | Nasal meridian | Temporal meridian | Superior meridian | |
|---|---|---|---|---|
| Cone density | 0.740 (p = 0.001045) | 0.705 (p = 0.001090) | 0.648 (p = 0.003623) | 0.517 (p = 0.023469) |
| Intercell distance | −0.794 (p = 0.000240) | −0.713 (p = 0.000891) | −0.664 (p = 0.002674) | −0.483 (p = 0.036010) |
| Nearest neighbour distance | −0.569 (p = 0.021397) | −0.621 (p = 0.005941) | −0.632 (p = 0.004879) | −0.473 (p = 0.040851) |
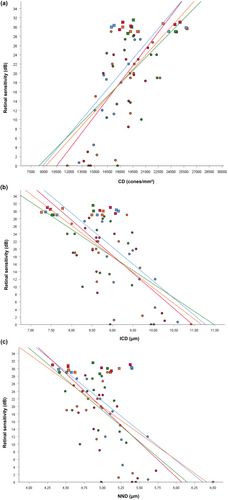
Figure 2 illustrates the correlations between structural cone metrics and retinal sensitivity at 3 degrees eccentricity for each meridian. Although we identified similar Pearson correlation coefficients with respect to CD and ICD within meridians located at 3 degrees, Pearson's r of NND had consistently the lowest size.
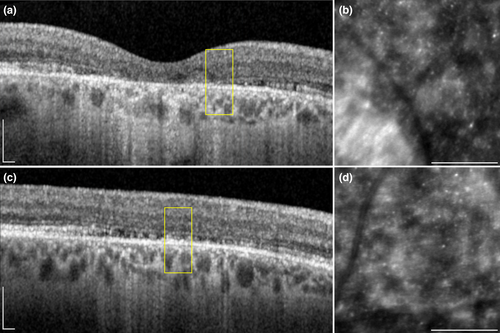
We identified 27 ROIs in five subjects (CACD 4, 9, 10, 12 and 13) with an absolute scotoma on MP that was located outside an area of focal retinal atrophy. On OCT scans, we observed a variable degree of disruptions in the outer retinal layers of each area with absent sensitivity on MP (Figure 3). We found the outer retina at the locations of absolute scotomas to be statistically significant thinner (p = 0.000003, one-sample t-test), as the outer retinal thickness at locations of relative scotomas in the same subjects at the same retinal eccentricities (figure 4). Our relative scotomas displayed a mean (95% CI) retinal sensitivity of 13.0 (6.8–19.2) dB. On average, outer retinal thickness in absolute scotomas was 8.59 (95% CI: 5.71–11.47) μm thinner than relative scotomas. We found no significant intersession differences in manual thickness measurements (p = 0.443407, one sample t-test). The Bland–Altman plot of intersession outer retinal thickness measurements is depicted in Figure S1. Interestingly, we identified no significant difference with respect to CD, ICD and NND in absolute scotomas and relative scotomas (one sample t-test; p = 0.915354, p = 0.796998 and p = 0.458034, respectively). We were unable to include ROIs located at 3 degrees eccentricity in the right eye of CACD10 in aforementioned analysis due to the absence of a relative scotoma at the same eccentricity.
We found 15 ROIs in 5 subjects (CACD1, 5, 10, 11 and 15) which were located at least partly within focal atrophy according to our AF-mask, but nonetheless displayed a mean (95% CI) retinal sensitivity of 11.3 (8.1–14.6)0. Unfortunately, evaluation of HMM images in atrophic lesions was hindered by a highly reflective retinal surface and by lack of unambiguous cone mosaics in the montage of these regions. Although the outer retinal layers on OCT were clearly affected in all ROIs, we were able to observe remnant retinal structures overlying the RPE.
4 DISCUSSION
In this study, we compared retinal photoreceptor metrics on HMM™ imaging and OCT to retinal microperimetry sensitivity in patients with CACD. We found a moderate-to-strong correlation between structural metrics on HMM™ imaging and retinal sensitivity on microperimetry at 3 degrees retinal eccentricity. HMM™-based metrics CD and ICD showed the strongest correlations with retinal sensitivity. Previous AO studies have evaluated cone structure and function in retinal dystrophies. Similar to our present study, Choi et al. demonstrated a strong linear relationship (R2 = 0.75) between retinal sensitivity and cone density using AO (Choi et al., 2006). Likewise, Foote et all found cone spacing with AO was negatively correlated with retinal sensitivity in a variety of IRDs (Foote, De la Huerta, et al., 2019; Foote, Rinella, et al., 2019). The apparent similarities in structure–function correlations between HMM™- and AO-based structural metrics present additional affirmation that dots of inconsistently increased reflectivity as seen on HMM™ imaging originate from photoreceptor cells. Also, the correlation of HHM™ measurements and retinal sensitivity at 3 degrees retinal eccentricity is comparable to the correlations found with AO.
In addition, we identified absolute scotomas on MP located outside of focal retinal atrophy. In areas corresponding to these absolute scotomas, outer retinal thickness on OCT was significantly thinner compared to areas corresponding to relative scotomas within the same subject, while CD, ICD and NND on HMM™ imaging did not differ significantly. These results help to further understand the origin of the signals detected by HMM™ imaging. The correlations between HMM™-based structural metrics and retinal function support the hypothesis that focally increased signals on HMM™ imaging originate from photoreceptors. It, however, is unclear whether these signals reflect the outer or the inner parts of retinal photoreceptors, or both. Histopathological studies on retinas of PRPH2 patients and Prph2 mouse models demonstrated shortened, whorl-like cone outer segments structures (Cheng et al., 1997; Wickham et al., 2009). Disturbance of outer segment morphogenesis may result in an increased phagocytosis by RPE cells and simultaneous occurrence of lipofuscin accumulation and focal atrophy of the photoreceptor–RPE functional unit in PRPH2-associated CACD (Boon et al., 2009; Smailhodzic et al., 2011). The findings on OCT show a significant reduction of outer retinal thickness in absolute scotomas, located outside of focal atrophy and we also observed loss of the outer segment layer on OCT. Presumably, the cone outer segments in these areas have been completely phagocytosed by RPE cells resulting in an absolute loss of sensitivity. If the outer segments are atypical but nonetheless present, cone function is not completely precluded but the affected retinal area will probably depict a relative scotoma (Farjo et al., 2006). Combining this information, we hypothesize that because intrasubject cone metrics in absolute and relative scotomas did not differ significantly, photoreceptor signals on HMM™ imaging do not solely originate from cone outer segments. Most likely the inner/outer segment junctions and/or cone inner segments also contribute to the HMM™ ‘cone’ signal. A recent paper suggests that parafoveal cones can be difficult to distinguish from rods on both confocal AOSLO and HMM™ imaging due to a less uniform intensity profile (Wynne et al., 2022). Since p.(Arg142Trp) PRPH2-associated CACD is considered a macula dystrophy involving the cones, rods may remain mainly unaffected in areas outside of atrophy (Boon et al., 2009). Therefore, we expect that signals of both photoreceptors types were detected in apparently unaffected areas on HMM™ imaging.
Unfortunately, we could not reproduce the strong correlation between retinal sensitivity and HMM™ cone metrics at 3 degrees of retinal eccentricity, on the measurements at 5 degrees. Here, we were unable to find statistically significant correlations between all but two HMM™-based cone metrics. An explanation could be found in the increase in receptive field size of retinal ganglion cells with increasing eccentricity. At 5 degrees eccentricity, Ricco's area of complete physiological summation is approximately 0.95 degrees in diameter (and only 0.70 degrees at 3 degrees) (Jung & Spillmann, 1970). The diameter of our default MP stimulus is not even half that size (0.431 degrees) meaning that our ROI's consequently include only approximately a quarter of the cone population that provide input to retinal ganglion cells receptive fields at 5 degrees (assuming an homogenous distribution of cones in retinal ganglion cells receptive fields). Likewise, larger retinal ganglion cells receptive field size in the superior meridian might explain the lower correlations we found in this meridian at 3 degrees (Drasdo et al., 2007). In order to prevent underestimation of cone responsiveness, we believe that future cone structure–function studies should actively match the stimuli size and ROIs to the theoretical receptive field size.
In 15 ROIs in five subjects, we detected residual retinal sensitivity in areas with RPE atrophy. Previous reports have shown surviving cones in these areas (Chen et al., 2011; Chui et al., 2011; King et al., 2017). The residual retinal sensitivity in these atrophic areas could then be explained by residual cone photoreceptors that may not be visible on HMM™ due to their optical properties or insufficient optical resolution to visualize those pathologically affected surviving cone photoreceptors. These suggests that MP testing could give more accurate results on retinal health than AF or HMM™ imaging alone, particularly in atrophic areas.
In conclusion, we found significant correlations between structural metrics on cone photoreceptors using HMM™ imaging and retinal sensitivity on MP in healthy subjects and p.(Arg142Trp) PRPH2-associated CACD patients. HMM™ imaging is a low-tech and affordable technique, at least compared to AO, that provides direct measurements on structural cone qualities. A multimodal approach, combining SD-OCT, retinal MP and HMM™ imaging, allows for detailed mapping of retinal photoreceptor integrity and restitution potential, important data that could serve as biomarkers in future clinical trials.
FUNDING INFORMATION
Financial support was provided by Stichting AF Deutman Oogheelkunde Research Fonds (SAFDOR), Nijmegen, The Netherlands and Stichting UitZicht, Ede, The Netherlands. The funding organizations had no role in the design or conduct of this research.
CONFLICT OF INTEREST STATEMENT
The authors have no proprietary or commercial interest in any materials discussed in this article.
MEETING PRESENTATION
Part of this material has been presented at the ARVO 2022 conference.


