Retinal microvasculature in pituitary adenoma patients: is optical coherence tomography angiography useful?
Our work was presented at Club de Neuro-Ophtalmologie Française, Lausanne, 24 January 2019, and at Société Française d'Ophtalmologie, Paris, 13 May 2019.
This research did not receive any specific grant from funding agencies in the public, commercial or not-for-profit sectors. It received a non-financial support from Optovue Fremont, California, USA: the authors thank Optovue for having made available us the use of the Optovue Avanti device.
Support for English language editing: Sophie Pegorier.
Abstract
Purpose
To examine retinal vascular changes in the peripapillary and macular areas in patients with pituitary adenoma (PA) using optical coherence tomography angiography (OCTA).
Methods
Cross-sectional, retrospective study of 17 consecutive PA patients and 16 healthy subjects. All patients underwent a neuro-ophthalmological examination to assess the presence of optic neuropathy (ON). Static automated perimetry (SAP), macular and optic disc structural OCT [retinal nerve fibre layer (RNFL) and ganglion cell complex (GCC) thicknesses] and OCTA were performed. Pituitary adenoma (PA) patients with ON were compared to those without ON and to healthy subjects.
Results
Optic neuropathy (ON) was found in 16 eyes of nine PA patients. Peripapillary vessel density (ppVD) and macular vessel density (VD) in the superficial vascular plexus were significantly decreased in PA eyes with ON, compared to healthy eyes (45.21 ± 5.69 versus 50.52 ± 2.14% and 43.79 ± 5.03% versus 48.96 ± 2.94%, respectively). No significant difference in VD was observed in the macular deep vascular complex (DVC) between groups. Pituitary adenoma (PA) patients with ON had a mean ppVD reduction by 10.51% compared to healthy subjects. RNFL and GCC thicknesses were significantly reduced in PA eyes with ON compared to the other groups. Peripapillary VD (ppVD) significantly correlated with RNFL thickness and SAP mean deviation.
Conclusions
Optical coherence tomography angiography showed a significant decrease in ppVD and superficial macular VD in PA eyes with ON compared to healthy eyes, according to RNFL and GCC thinning. Together with the absence of DVC alterations, it may provide further insights into neurovascular coupling.
Introduction
Pituitary adenomas (PA) are benign lesions accounting for 10–15% of all intracranial tumours (Lake et al. 2013). The estimated prevalence of PA in the overall population is 16.7%, and this percentage increases up to 22% when incidental microadenomas detected by magnetic resonance imaging (MRI) are taken into account (Ezzat et al. 2004; Fernandez et al. 2010).
Pituitary adenoma (PA) can compress the anterior visual pathway causing visual disturbances such as decrease in visual acuity (VA) and visual field defects (Zargar et al. 2004; Fernández-Balsells et al. 2011; Lopes 2017). Damages to the optic chiasm result in a retrograde degeneration of the retinal nerve fibre layer (RNFL) which can be objectively evaluated by optical coherence tomography (OCT) (Kanamori et al. 2004; Monteiro et al. 2004). Previous studies have shown a RNFL loss in PA patients with chiasmal compression (Monteiro et al. 2004; Johansson & Lindblom 2009).
Recently, OCT macular segmentations have allowed acute measurements of the macular ganglion cell complex (GCC) thickness, which correlate better with visual field defects than RNFL measurements in patients with chiasmal compression (Akashi et al. 2014; Horton 2017; Banc et al. 2018). The GCC analysis provides very useful information because it may also detect compressive chiasmopathy without visual field defects visible on standard automated visual field testing (Blanch et al. 2018).
Previous studies have shown that in patients with PA compressing the visual pathways, a visual field recovery may be achieved after surgery although optic atrophy and OCT changes may persist (Newman et al. 2016). The consequences of PA compression on the visual pathways are not fully understood, and the vascular consequences remain to be clarified, with a particular attention to the neurovascular coupling.
The introduction of OCT angiography (OCTA) in clinical practice allows a non-invasive assessment of the vasculature within the macula and the optic nerve (Jia et al. 2012; Bonnin et al. 2015; Wylęgała 2018). Many studies using this device have shown a strong correlation between vascular and structural damages, both in normal eyes (Kurihara 2016; Liu et al. 2017) and in diabetic retinopathy (Moran et al. 2016).
To our knowledge, no study has previously explored the retinal microvasculature in PA patients using OCTA.
The aim of this study was to assess the peripapillary and macular vessel densities (VD) measured using OCTA in a cohort of PA patients with optic neuropathy (ON).
Methods
This observational, retrospective, cross-sectional study was conducted in the Ophthalmology Departments of Pitié-Salpêtrière Hospital and Lariboisière Hospital in Paris. The study was conducted in accordance with the tenets of the Declaration of Helsinki, and a written informed consent was obtained from all participants. All study-related data acquisitions were approved by the Ethics Committee of the French Society of Ophthalmology (IRB 00008855 Société Française d'Ophtalmologie IRB#1).
Subjects
All consecutive patients with a confirmed diagnosis of PA consulting between January and May 2018 were included.
Inclusion criteria were PA confirmed using MRI, age >18 years, and absence of any other brain or cerebrovascular disease, having performed all required examinations with good quality images. Exclusion criteria were any previous treatment for PA, presence of any other ophthalmological disorder and systemic disease [diabetes, high blood pressure (HBP)] that could affect the visual field or cause vascular alterations. Optic neuropathy (ON) was defined based on the clinical examination, including pupil examination, best-corrected VA measurement, fundus and particularly optic nerve examination, applanation tonometry, static automated perimetry (SAP), structural OCT and OCTA.
A group of healthy subjects composed of volunteers from our clinics who signed an informed consent was used as a control group. Subjects were asked to report their clinical history and those suffering from systemic diseases such as diabetes or HBP, or from ocular diseases such as glaucoma, any maculopathy or with a history of previous surgery were excluded.
Brain imaging
All patients underwent brain MRI with high-resolution coronal T2-weighted and fat-suppressed T1-weighted with gadolinium injection (T1 IV+) sequences focused on the pituitary region. Manual segmentation of PA was performed by an experienced neuroradiologist.
Functional parameters
Static automated perimetry (SAP) was performed with the Humphrey Field Analyzer (Carl Zeiss Meditec, Jena, Germany) using the Swedish Interactive Threshold Algorithm Standard strategy, program 24-2. Mean deviation (MD) values were used for the analysis. Reliability criteria were fixation losses ≤20%, and false positives and false negatives rates ≤33%.
Optical coherence tomography
The OCT scanning protocol was performed as follows: after pupil dilation, the macular cube scan was performed using the Cirrus high-resolution Spectral-Domain-OCT system (Carl Zeiss Meditec, Dublin, CA, USA); it included the macular thickness analysis and the ganglion cell layer analysis. The ganglion cell layer analysis algorithm was included in the Cirrus HD-OCT 6.0 software (Carl Zeiss Meditec, Dublin, CA, USA): it detected and measured the macular ganglion cell-inner plexiform layer (IPL) thickness within a 6 × 6 × 2-mm elliptical annulus area centred on the fovea. The algorithm has been previously detailed (Mwanza et al. 2011).
The RNFL thickness was acquired using the RTVue XR Avanti OCT device (AngioVue; Optovue, Inc., Fremont, CA, USA).
Optical coherence tomography angiography (OCTA)
The OCTA angiograms were obtained using the RTVue XR Avanti. 4.5 × 4.5-mm HD angio-disc and 3 × 3-mm angio-retina scans, respectively, centred on the optic nerve head and on the fovea.
The AngioVue software automatically provided VD parameters which correspond to the proportion of the scanned area occupied by the large vessels and capillaries defined as pixels with decorrelation values, acquired by the split-spectrum amplitude-decorrelation angiography algorithm, above the threshold level.
The software (version 2017.1.0.151; Optovue, Inc) automatically provided papillary VD for the whole en face area (wVD, whole en face image VD) and the peripapillary VD (ppVD). The peripapillary region is defined by a 0.75-mm-wide elliptical annulus extending from the optic disc margin (inner elliptical contour) and was used to determine the ppVD. Sectorial division into eight sectors (supero-nasal, nasal-superior, nasal-inferior, inferior-nasal, inferior-temporal, temporo-inferior, temporo-superior and supero-temporal) was performed, and VD was provided for each sector. Vessel density (VD) in the radial peripapillary capillary layer, that spreads between the internal limiting membrane (ILM) and the RNFL posterior boundary, was analysed in the peripapillary area (ppVD) and in the whole image.
The automated segmentation of the superficial vascular plexus (SVP) and deep vascular complex (DVC) was used for measuring VD in the macular region using the predefined boundaries provided by Optovue: the SVP was comprised between the ILM and 9 μm above the junction between the IPL and the inner nuclear layer (IPL–INL), while the DVC was comprised between 9 mm above the IPL–INL junction and 9 μm below the outer plexiform layer and outer nuclear layer junction; there was no overlap between the two slabs.
Vessel density (VD) and retinal thickness values were recorded for the whole 3 × 3-mm area and in the parafoveal area (an annulus of 1.5-mm in radius with an inner radius of 0.5 mm centred on the fovea). Regional segmentation of parafoveal annulus into superior and inferior hemispheres was obtained directly from the system.
Poor quality scans (defined as Quality Index < 7/10, or saccade or blinking artefacts) were excluded from the analysis.
Statistical analysis
Continuous variables did not meet the normality requirements for the Shapiro–Wilk test and were thus analysed using a Mann–Whitney or Wilcoxon test when appropriate. Dichotomic variables were analysed using a chi-square or Fisher exact test. Linear correlations between two continuous variables were tested using the Pearson's linear coefficient r with the relative probability of r = 0. A p value <0.05 was considered significant.
The SPSS program package version 19.0 (SPSS, Inc., Chicago, IL, USA) was used for statistical analysis.
Results
General characteristics
Nineteen consecutive PA patients and 17 healthy subjects met the inclusion criteria. Two PA patients were excluded due to coexisting diabetes or systemic HBP. Among the remaining 17 patients, one patient was one-eyed (because of trauma), and three eyes of three patients were excluded because of insufficient quality of OCTA images (excessive segmentation errors). Only 30 eyes of these 17 patients were finally included. The reasons for exclusion of healthy eyes were a poor image quality (two eyes of one subject) and the presence of myopic anisometropia (>6 D) in two eyes of two subjects, so that only one eye was considered for these subjects. Finally, 30 eyes of 16 healthy subjects were included in the study.
Table 1 summarizes the demographics, and structural and functional characteristics of PA patients with and without ON and healthy subjects.
| PA, overall (group 1) | PA with ON (group 1A) | PA without ON (group 1B) | Healthy subjects (group 2) | p value (1 versus 2) | p value (1A versus 2) | p value (1B versus 2) | p value (1A versus 1B) | |
|---|---|---|---|---|---|---|---|---|
| Eyes (n) | 30 | 16 | 14 | 30 | ||||
| Participants (n) | 17 | 9 | 8 | 16 | ||||
| Age (years, mean ± SD)* | 54.43 ± 16.55 | 51.25 ± 15.19 | 58.07 ± 17.83 | 42.83 ± 12.85 | 0.033 | 0.288 | 0.013 | 0.204 |
| Sex (M/W %)† | 82/18% | 100/0% | 62/38% | 62/38% | 0.31 | 0.07 | 0.99 | 0.16 |
| Visual acuity LogMAR mean ± SD (Snellen)* | 0.02 ± 0.02 (20/21,5) | 0.01 ± 0.02 (20/21) | 0.02 ± 0.09 (20/21,5) | 0.00 ± 0.00 (20/20) | 0.028 | 0.19 | 0.05 | 0.75 |
| Parafoveal retinal thickness (μm, mean ± SD) | 313.79 ± 19.02 | 310.50 ± 13.27 | 318.40 ± 25.10 | 330.62 ± 10.78 | <0.001 | <0.001 | 0.01 | 0.143 |
| RNFL (μm, mean ± SD)* | 98.13 ± 19.85 | 84.13 ± 14.51 | 114.36 ± 10.90 | 109.20 ± 11.31 | 0.017 | <0.001 | 0.19 | <0.001 |
| GCC (μm, mean ± SD)* | 74.89 ± 10.81 | 66.64 ± 7.06 | 83.14 ± 6.81 | 82.20 ± 4.03 | 0.001 | <0.001 | 0.32 | <0.001 |
- * Mann–Whitney test.
- † Chi-square test.
- GCC = ganglion cell complex, RNFL = retinal nerve fibre layer, SD = standard deviation.
No significant difference in image quality was found between PA eyes and healthy eyes (p = 0.113).
Three out of the 17 PA patients (18%) had prolactin-secreting adenoma, two (12%) had growth hormone-secreting adenoma, two patients (12%) had gonadotroph adenoma (secreting biologically active gonadotropins) and two patients (12%) had adrenocorticotropic hormone-secreting adenoma. The remaining patients (45%) had non-secreting adenoma. The mean PA volume was 10.8 ± 14.2 cm³ (range: 0.021–63.1 cm3).
Based on neuro-ophthalmological examinations, ON was identified in nine out the 17 PA patients (53%). In all PA patients with ON, ON was present in both eyes. Similarly, in all PA patients without ON, ON was absent in both eyes.
Pituitary adenoma (PA) eyes with ON had a significantly different SAP MD compared to PA eyes without ON (mean ± standard deviation: −8.11 ± 8.55 and −1.03 ± 1.11 dB, respectively, p < 0.001).
Two patients underwent Goldmann visual field perimetry, because SAP could not be performed.
The mean PA volume was larger in PA patients with ON than in PA patients without ON (15.3 ± 17 cm3 versus, 4.7 ± 3.5 cm3, p = 0.13).
The RNFL thickness was significantly reduced in PA patients with ON compared to healthy subjects (p < 0.001). The GCC was thinner in PA patients with ON as compared to both PA patients without ON and healthy subjects (p < 0.001). However, no significant difference in RNFL and GCC thicknesses was found between PA patients without ON and healthy subjects.
Peripapillary VD
Mean VD values in the disc scan for each group are presented in Table 2.
| PA, overall (group 1) | PA with ON (group 1A) | PA without ON (group 1B) | Healthy subjects (group 2) | p value (1 versus 2) | p value (1A versus 2) | p value (1B versus 2) | p value (1A versus 1B) | |
|---|---|---|---|---|---|---|---|---|
| Macular SVP parafoveal VD (%) | 44.87 ± 5.68 | 43.79 ± 5.03 | 46.37 ± 6.45 | 48.96 ± 2.94 | 0.004 | <0.001 | 0.40 | 0.15 |
| Macular DVC parafoveal VD (%) | 52.30 ± 3.83 | 52.78 ± 3.28 | 51.64 ± 4.60 | 53.53 ± 4.10 | 0.16 | 0.28 | 0.24 | 0.54 |
| Disc whole image VD (%) | 46.12 ± 4.35 | 43.96 ± 4.14 | 48.59 ± 3.17 | 48.58 ± 2.18 | 0.01 | <0.001 | 0.91 | 0.002 |
| Disc ppVD (%) | 47.81 ± 5.31 | 45.21 ± 5.69 | 50.78 ± 2.78 | 50.52 ± 2.14 | 0.02 | <0.001 | 0.69 | <0.001 |
- DVC = deep vascular complex, ppVD = peripapillary VD, SVP = superficial vascular plexus, VD = vessel density.
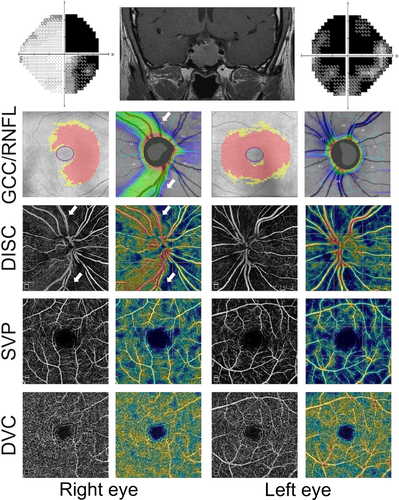
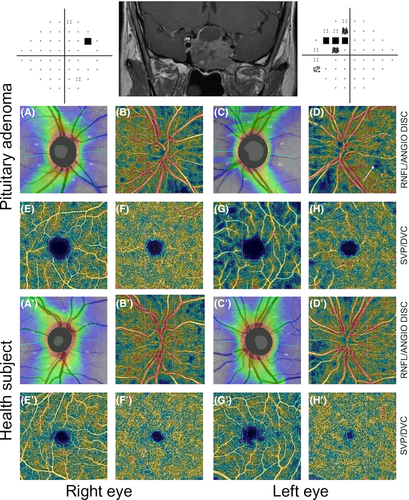
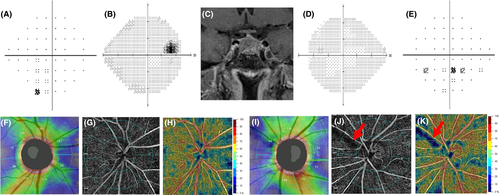
Pituitary adenoma (PA) eyes with ON showed a reduced VD compared to both PA eyes without ON and healthy eyes, in the 4.5 × 4.5-mm whole image (p < 0.001) and in the peripapillary annulus (p < 0.001; Table 2). Figure 1 shows an example of bilateral compressive ON resulting in a decrease in ppVD in both eyes, predominantly in the left eye, where the visual field alteration was more severe. Figure 2 shows another case of bilateral compressive ON, with a slighter alteration of ppVD.
Statistically significant differences were found between healthy eyes and PA eyes with ON, with a mean ppVD reduction by 10.51%. In PA eyes without ON, no statistically significantly reduced ppVD was observed compared to healthy eyes (Table 2).
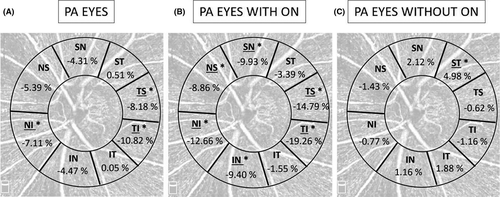
Figure 3 shows the mean percentage of ppVD reduction compared to healthy eyes in each sector analysed in the three groups. In PA patients with ON, the ppVD was significantly reduced in the nasal-superior (43.25 ± 6.68% versus 47.46 ± 3.40%, p = 0.021), nasal-inferior (40.39 ± 6.30% versus 46.24 ± 4.43%, p = 0.001), temporal-inferior (42.24 ± 7.78% versus 52.32 ± 3.57%, p < 0.001) and temporal-superior (45.56 ± 5.87% versus 54.65 ± 3.78%, p < 0.001) sectors.
Macular VD OCTA parameters
Mean VD values in the SVP and DVC for each group are presented in Table 2.
Pituitary adenoma (PA) eyes with ON showed a reduced parafoveal VD in the SVP compared to healthy eyes (p < 0.001). Pituitary adenoma (PA) eyes without ON showed a lower parafoveal SVP VD compared to healthy eyes, although the difference did not reach statistically significance (46.37 ± 6.45% versus 48.96 ± 2.94%, respectively, p = 0.40). p values derived from the comparisons of PA subgroups (with and without ON) versus healthy eyes in the parafoveal sectors are shown in Fig. 4.
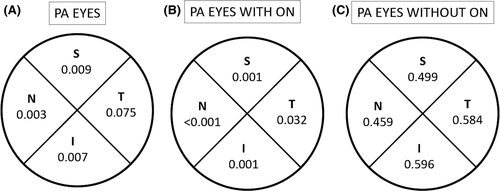
No statistically significant difference in the parafoveal VD in the DVC was found between groups (Table 2). Figures 1 and 2 show a VD decrease in the SVP in cases of compressive ON, whereas in the DVC, VD was not impaired.
Correlations between the VD and structural and functional parameters
Correlations between the VD and the structural and functional parameters are reported in Table 3.
| Optical coherence tomography angiography vessel density | RNFL (μm) | GCC (μm) | MD (dB) | |||
|---|---|---|---|---|---|---|
| r | p | r | p | r | p | |
| Whole image papillary VD (%) | 0.73 | <0.001 | 0.63 | <0.001 | 0.84 | <0.001 |
| Peripapillary VD (%) | 0.76 | <0.001 | 0.68 | <0.001 | 0.92 | <0.001 |
| Temporo-inf ppVD (%) | 0.64 | <0.001 | 0.60 | <0.001 | 0.62 | <0.001 |
| Nasal-inf ppVD (%) | 0.65 | <0.001 | 0.39 | 0.006 | 0.70 | <0.001 |
| Parafoveal VD in the SVP (%) | 0.58 | <0.001 | 0.25 | 0.12 | 0.42 | 0.08 |
- GCC = ganglion cell complex, MD = SAP mean deviation, p = p-value, ppVD = peripapillary vessel density, RNFL = retinal nerve fibre layer, SVP = superficial vascular plexus, VD = vessel density.
- Bold values are statistically significant values (p < 0.05).
A direct concordance between the decreased light sensitivity on SAP and the reduced VD on OCTA was also found in the qualitative analysis, especially in eyes with advanced damage (Fig. 1): the qualitative analysis of OCT-A images showed a reduced VD which corresponded to areas presenting with a decreased light sensitivity on visual field examination.
Discussion
In this study, we examined the pattern of ppVD and macular VD in PA patients compared to healthy subjects. Previous studies based on OCT imaging have shown RNFL abnormalities in PA eyes; however, OCTA parameters in the posterior pole, including the optic nerve head, had not yet been assessed.
We found that the ppVD and the superficial macular VD were significantly decreased in PA patients compared to healthy subjects. Pituitary adenoma (PA) patients with ON presented a mean reduction in ppVD by 10.51% and a mean reduction in VD in the SVP by 8.35% compared to healthy subjects.
Previous studies have assessed RNFL and GCC thicknesses in PA patients (Kanamori et al. 2004; Monteiro et al. 2004; Glebauskiene et al. 2018). In most of these studies, the mean RNFL and GCC thicknesses were reduced in PA patients compared to normal controls and most PA patients had a compression of the anterior visual pathways. However, no subgroup analysis of patients with and without compressive ON has systematically been performed. Our results confirmed a significant decrease in RNFL and GCC thicknesses in PA patients with ON, compared to healthy subjects.
Optical coherence tomography angiography (OCTA) provides new information such as the quantification of the decrease in ppVD and macular VD before treatment. The ppVD was 45.21 ± 5.69% and 50.52 ± 2.14% in PA eyes with ON and healthy eyes, respectively (p < 0.001). The superficial macular VD was also reduced in PA eyes with ON compared to healthy eyes (mean VD in the SVP: 43.79 ± 5.03% versus 48.96 ± 2.94%, p < 0.001). On the contrary, the DVC was not altered in PA patients.
Chiasmal compression predominantly affects the crossed nerve fibres subserving the nasal hemiretina, which results in bitemporal hemianopia. Visual pathway lesions induce damage to the axons of retinal ganglion cells, that form the RNFL, visible on fundus ophthalmoscopy, but also measured by OCT through the RNFL thickness. When the optic chiasm is directly compressed or its blood supply system is altered by PA, axonal injury and dysfunction and/or ganglion cell apoptosis may occur (Danesh-Meyer et al. 2006; Moon et al. 2011) resulting in RNFL and GCC thinning.
Several stages occur successively in case of anterior visual pathway compression. First, the compression causes a physiological conduction block, resulting in visual field impairment. If decompression is achieved at this early stage, the restoration of signal conduction allows normalization of the visual field as early as 1 week later. If compression persists, reversible or irreversible axonal damage will progress, as well as visual dysfunction. If decompression surgery is performed at this stage, the physiological conduction block is reversed in these axons that remain intact. In case of persistent compression, the effect is a progressive loss of ganglion cells that may be associated with decreased retinal needs and may lead to capillary loss, as shown using OCTA.
Both dead and dysfunctional ganglion cells may cause visual field alterations, whereas OCT parameters (RNFL and GCC thinning) reveal permanent structural changes, such as neuron loss. Optical coherence tomography angiography (OCTA) measurements allow confirming flow decrease related to ganglion cell dysfunction or loss as they show the decrease in VD in the SVP in PA patients with ON. On the contrary, the VD in the DVC, which mainly supplies the INL, is not significantly different between PA patients and healthy subjects.
As OCTA assesses the capillary flow, one part of the VD decrease in the SVP could be only transient, secondary to a transient neuronal dysfunction (Prada et al. 2016). We could assume that the reduction in VD could be associated with a reduced cellular function, occurring before cellular death, showing the importance of OCTA assessment. This point could also explain the poor correlation between the parafoveal VD in the SVP and the GCC layer thickness.
The analysis of the regional ppVD showed a characteristic loss of VD both nasal to the disc and in the papillomacular region with relative sparing of the superior and inferior sectors (Fig. 3A). This result is in line with OCT knowledge. Several studies have shown that the temporal RNFL quadrant was severely affected and that the temporal RNFL showed the strongest correlation with the baseline MD (Cennamo et al. 2015; Danesh-Meyer et al. 2015).
In our study, we compared patients with and without ON. The MD and the mean RNFL thickness were significantly different between these two groups (MD: −8.11 dB and mean RNFL: 84.13 μm in PA eyes with ON; MD: −1.03 dB and mean RNFL: 114.36 μm in PA eyes without ON). The comparison of VD between PA eyes with ON and PA eyes without ON showed a significant mean reduction in ppVD by 10.97%, while no significant difference in parafoveal VD in the SVP was observed between PA eyes with and without ON.
No significant differences in terms of RNFL and GCC thickness or in OCTA parameters were found between PA patients without ON and healthy subjects.
Retinal nerve fibre layer (RNFL) damages have also been observed in PA patients in the absence of visual field defect and even in PA eyes without optic chiasmal compression (Cennamo et al. 2015). It has been assumed that PA might directly damage the RNFL, even in the absence of a compressive effect on the chiasm (Cennamo et al. 2015). Our results highlighted the presence of microvascular damages in PA patients with ON but not in those without ON. These results could be explained by the small sample size and the high variability in tumour size. The same reasons could explain the absence of GCC thinning in PA patients without ON, compared to healthy subjects, as previously suggested (Zhang et al. 2017). Qualitatively, some PA patients with impaired visual field and normal RNFL showed impaired VD on OCTA (Fig. 5). As the follow-up of these patients after PA surgery is still ongoing, we hope to be able to answer this point soon.
We also analysed the correlation between the VD and the RNFL thickness and visual field loss. Our data showed a correlation between the ppVD and the RNFL thickness (r = 0.73). A similar relationship was shown between the ppVD and the visual field MD (r = 0.84). Although significant correlations were observed between the ppVD and both the visual field and structural parameters (i.e. RNFL, GCC), the former correlations were stronger and could be explained by the functional damage (with reduced light sensitivity in the visual field) that could occur before the ability to measure the retinal thinning.
This study has some limitations. It was conducted retrospectively, and the sample size was small. The healthy subjects used for comparisons were significantly younger than PA patients and this could have influenced VD values, as previously reported. Since the difference in mean age between groups was of 12 years, and the mean VD decrease per year (%) has been reported to be of 0.064 in the SVP (Lavia et al. 2019), the age-related differences in VD between groups should be <1% (0.77%). Although the results should be interpreted with caution, the differences in VD in the SVP between PA patients and healthy subjects were greater than expected based only on the age-related differences. This difference could therefore be due to the disease itself rather than to age-related differences only. Moreover, no visual field examination was performed in healthy subjects.
A pretreatment assessment of PA patients by an ophthalmologist is recommended to identify patients with asymptomatic visual defects and to provide information on prognostic factors for recovery such as a decrease in RNFL thickness or retinal ganglion cell loss (Newman et al. 2016). Conducting a longitudinal study based on OCTA in PA patients could help to explain some visual impairments in the postoperative assessment.
In conclusion, OCT studies have already shown the presence of RNFL abnormalities in PA eyes; however, the vascular dysfunction in the posterior pole, including optic nerve head, had not yet been evaluated in these patients. To our knowledge, our study is the first one to show that the ppVD is decreased in PA patients with ON.
Our findings are not yet sufficient to allow recommending the use of OCTA in the routine management of PA in a clinical setting. However, they help to understand the visual loss, by showing a significant decrease in ppVD and macular VD in the SVP in PA patients.
Combining structural OCT with OCTA data could provide deeper insights into the status of PA patients, providing a more accurate and complete approach for the diagnosis of compressive ON. Further studies including a post-treatment assessment are needed to confirm whether these changes in blood supply to the GCC are an early reversible phenomenon or a late irreversible marker of sustained compression.


