Contrast sensitivity measured by two different test methods in healthy, young adults with normal visual acuity
Abstract
Purpose
This study reports contrast sensitivity (CS) reference values obtained by two different test methods in a strictly selected population of healthy, young adults with normal uncorrected visual acuity. Based on these results, the index of contrast sensitivity (ICS) is calculated, aiming to establish ICS reference values for this population and to evaluate the possible usefulness of ICS as a tool to compare the degree of agreement between different CS test methods.
Methods
Military recruits with best eye uncorrected visual acuity 0.00 LogMAR or better, normal colour vision and age 18–25 years were included in a study to record contrast sensitivity using Optec 6500 (FACT) at spatial frequencies of 1.5, 3, 6, 12 and 18 cpd in photopic and mesopic light and CSV-1000E at spatial frequencies of 3, 6, 12 and 18 cpd in photopic light. Index of contrast sensitivity was calculated based on data from the three tests, and the Bland–Altman technique was used to analyse the agreement between ICS obtained by the different test methods.
Results
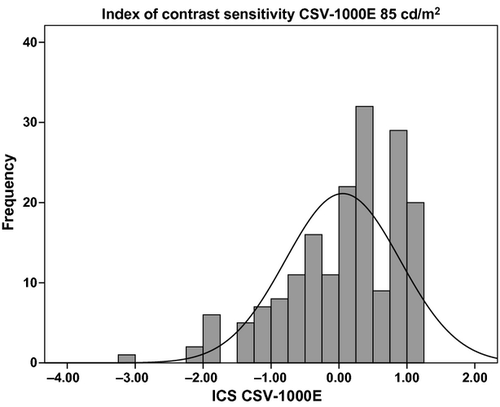
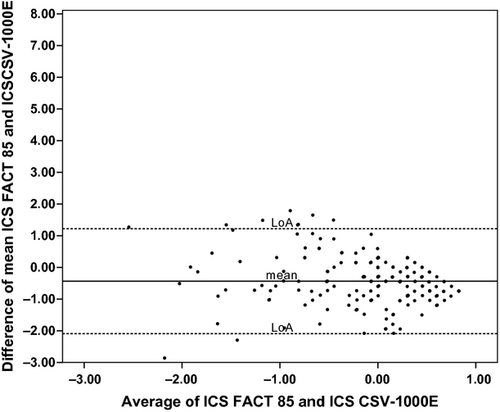
A total of 180 recruits were included. Contrast sensitivity frequency data for all tests were highly skewed with a marked ceiling effect for the photopic tests. The median ICS for Optec 6500 at 85 cd/m2 was −0.15 (95% percentile 0.45), compared with −0.00 (95% percentile 1.62) for Optec at 3 cd/m2 and 0.30 (95% percentile 1.20) FOR CSV-1000E. The mean difference between ICSFACT85 and ICSCSV was −0.43 (95% CI −0.56 to −0.30, p < 0.00) with limits of agreement (LoA) within −2.10 and 1.22. The regression line on the difference of average was near to zero (R2 = 0.03).
Conclusion
The results provide reference CS and ICS values in a young, adult population with normal visual acuity. The agreement between the photopic tests indicated that they may be used interchangeably. There was little agreement between the mesopic and photopic tests. The mesopic test seemed best suited to differentiate between candidates and may therefore possibly be useful for medical selection purposes.
Introduction
Assessment of contrast sensitivity (CS) is now generally believed to give information about the visual capacity beyond that obtained by high-contrast visual acuity tests (HCVA). This has been indicated by among others Ginsburg et al. (1982), who found contrast sensitivity to correlate better than visual acuity in predicting a pilot's ability to detect a small, semi-isolated, air-to-ground target. A review paper by Owsley & McGwin (2010) cites numerous studies reporting significant associations between impaired contrast sensitivity and reduced driving performance.
Contrast sensitivity may be examined by different methods, and this diversity is reflected in the previously published studies on the normal distribution of contrast sensitivity in healthy populations. Grimson et al. (2002) used the small letter contrast test (SLCT) when measuring contrast sensitivity in a group of naval pilot students. They also compared these results with those obtained in aviation and non-aviation personnel aged 21–54 years. Kelly et al. (2012) tested a group of adults (mean age 26.4, SD 4.7) and children using CSV-1000, primarily to find values of repeatability. Using the same test method in a large, randomly selected population of men aged 35–80 years, Sia et al. (2013) found that CS declined with increasing age in all spatial frequencies tested. Franco et al. (2010) used the Bland–Altman technique to compare the CS obtained by CSV-1000 and Vision Contrast Test System 6500(VCTS) in 105 subjects (mean age 21.4 years, SD 1.9) with best-corrected Snellen visual acuity (BCVA) ≥0.8. Hohberger et al. (2007) measured contrast sensitivity in a group of 61 hospital employees and patients aged ≥18 years using the Optec 6500 (Stereo Optical Co., Inc., Chicago, IL, USA) based on the Functional Acuity Contrast Test (FACT). Haughom & Strand (2013) examined aviation pilots aged 17–54 years, assessing their contrast sensitivity on five frequencies in mesopic and photopic light conditions by Optec 6500. They also introduced the term “index of contrast sensitivity (ICS)”, which they believed to be a useful collective descriptor of the different contrast sensitivity frequencies and suggested that ICS may be accepted as a generalized parameter for contrast sensitivity assessment.
The concept of ICS is a follow-up on an idea by Wachler & Krueger (1998) of using and reporting normalized contrast sensitivity values. They stated that difficulties to interpret contrast sensitivity curves might be overcome by reporting the obtained contrast sensitivity as a factor of the population mean for each test frequency. Another solution is to report the area under the curve (AUC) as a measure of contrast sensitivity. One challenge using these methods is to evaluate the impact of each frequency and its importance on visual performance. Previous studies have indicated different clinical significance of the various frequencies. Ginsburg et al. (1982) found the best predictive value at the peak of the contrast sensitivity curve, that is, 6 cpd, while another study (Evans & Ginsburg 1985) stressed the importance of 1.5 and 12 cpd, which seemed to correlate best with the visual performance. Acknowledging the presumed increased importance of 6 cpd and adjacent frequencies, the ICS gives more power to these frequencies (Haughom & Strand 2013).
A review by Owsley & McGwin (2010) on the research performed on contrast sensitivity states that CS screening tests which can be more readily translated into licensing policies need to be developed. As a step towards this goal, this study aimed to present reference CS and ICS values obtained in photopic and mesopic light for a strictly selected population. A further aim was to use the ICS values to analyse the agreement between the Optec 6500/FACT and CSV-1000E contrast sensitivity tests.
Materials and Methods
Subjects
A total of 194 military recruits from the French Air Force and the Royal Norwegian Navy were invited to participate in the study. Fourteen candidates were excluded, as they did not meet one or more of the following inclusion criteria: age 18–26 years, best eye uncorrected visual acuity (BVA) LogMAR 0.00 or better, normal colour vision by Ishihara's test and no previous refractive surgery in either eye. Thus, the study group included 180 subjects.
Measurements
Contrast sensitivity
Binocular contrast sensitivity (CS) was measured by two commercially available tests using sine wave gratings with different spatial frequencies. The Optec 6500/FACT (Functional Acuity Contrast Test) from Stereo Optical, Chicago, USA, was used for mesopic (3 candela/m2 (cd/m2) and photopic (85 cd/m2) measurements with the spatial frequencies of 1.5 cpd (cycles per degree of visual angle) (threshold range 0.045–2.00), 3 cpd (threshold range 0.70–2.20), 6 cpd (threshold range 0.78–2.26), 12 cpd (threshold range 0.60–2.08) and 18 cpd (threshold range 0.30–1.81) in far vision mode. Mesopic CS was first measured after 10-min dark adaptation, and then the test was repeated in photopic light. All the study participants (n = 180) were tested the same examiner. The data obtained were plotted using the EyeView™ software (Vision Sciences Research Corporation, Walnut Creek, CA, USA). The other test used the CSV-1OOOE (VectorVision, Greenville OH, USA) for photopic (85 cd/m2) contrast sensitivity with 2.5-m viewing distance. The test consists of sinoidal grated patches for the frequencies 3 cpd (threshold range 0.70–2.08), 6 cpd (threshold range 0.91–2.29), 12 cpd (threshold range 0.61–1.99) and 18 cpd (threshold range 0.17–1.55). Immediately after the Optec 6500 tests were completed, the CSV-1OOOE test was performed by a second examiner on all participants except one (n = 179). During the tests, the participants were encouraged to respond, but not to guess. A forced choice and a strict time limit were not employed.
The first examiner also measured the BVA of each participant using the Optec 6500/EDTRS chart in far distance mode on a LogMAR scale at photopic light conditions (85 cd/m2). The chart has a minimum resolution at LogMAR −0.20. A third examiner recorded the colour vision using the Ishihara 24-plate pseudoisochromatic test in standardized daylight of 6280 degree K light (Illuminator for Pseudoisochromatic Tests with Easel, Richmond Products, http://www.richmondproducts.com/).
Using the results and median values obtained in our three different contrast sensitivity measurements, the ICS was calculated for each participant. As recommended by Haughom & Strand (2013), ICS was defined as the sum of the residual differences (positive or negative) from the median in each frequency. The differences were weighted according to the presumed clinical importance of each frequency. Thus, 6 cpd was given the highest power (factor 3). The frequencies 3 and 12 cpd received factor 2, while the remaining test frequencies were not weighted. A performance equivalent to the median in all tested frequencies should yield an ICS value of zero.
Statistical analysis
Descriptive statistics for each frequency and ICS for each of the contrast vision tests were provided. Normality of data was assessed by Shapiro–Wilk test and through skewness and kurtosis. The agreement between the different test methods was studied using the technique described by Bland & Altman (1999), which has been recommended when conducting comparative studies of clinical test in ophthalmology (McAlinden et al. 2011). Limits of agreement (LoA) were calculated as ±1.96 standard deviation of the differences of the mean. Paired t-tests were conducted to analyse the mean differences between the ICS tests. PASW statistics 18.0.3 was used for all analyses (Predictive Analytics Software; SPSS, Hong Kong, China).
Research ethics
The study adhered to the Declaration of Helsinki. The participants were informed about the objectives and conditions of the study and had to sign a formula of consent. The Regional Committee for Medical Research Ethics, Western Norway and the Norwegian Social Science Data Services approved the study protocol. The test subjects were not paid for participating in the study, and they could withdraw from the study at any point. Individual data from the study were not revealed to the Armed Forces and could not be used for medical selection of the candidates.
Results
Study population
The study group consisted of 172 male and eight female recruits (47 French and 133 Norwegian) with mean age 20.95 (range 18–25, SD 1.16). The French recruits were slightly older than the Norwegian participants (mean age 21.8 and 20.6 years, respectively), while the BVA did not differ significantly in the two groups. The mean BVA in the whole study group was −0.13 (range −0.20–0.00, SD = 0.05, 75% and 95% percentile −0.11 and −0.14, respectively). Mode was −0.18.
Frequency distribution
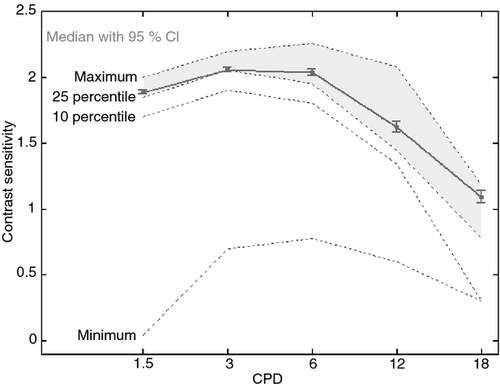
The individual frequency data showed a non-symmetrical distribution for all measurements, evident both by visual inspection of distribution curves (not published) and by statistical evaluation of single frequency data (Table 1). The frequency samples for Optec 6500/FACT at 85 cd/m2 were highly skewed towards the high end of the test range, showing a marked ceiling effect. This was evident for all frequencies except 18 cpd, and most pronounced for the three lowest frequencies (1.5–6 cpd), where all participants scored within the three patches with highest threshold values. At 1.5 cpd, 138 of 180 made the highest score, while 118 of 180 made the maximal score at 6 cpd. Reducing light emission to 3 cd/m2 in the Optec 6500/FACT induced a wider spread of the test results. Still, a ceiling effect existed, most pronounced at the lower frequencies with skewness towards the high thresholds. None of the participants failed the test by not being able to detect the gratings with the lowest level, but the results showed a wider spread in the high frequencies, where only three subjects made highest score at 18 cpd, and ten just made the entry level (Fig. 1). The results obtained in the 179 participants examined by the CSV-1000E test were skewed towards the high-threshold end for all frequencies, most pronounced at 3 and 6 cpd.
| Spatial frequency (cpd) | Optec 6500 FACT 85 cd/m2 | Optec 6500 FACT 3 cd/m2 | CVS-1000E 85 cd/m2 | |||||||||
|---|---|---|---|---|---|---|---|---|---|---|---|---|
| Median | Mode | 95% percentile | Range results | Median | Mode | 95% percentile | Range results | Median | Mode | 95% percentile | Range results | |
| 1.5 | 2.00 | 2.00 | 2.00 | 0.30 | 1.85 | 1.85 | 2.00 | 0.44 | ||||
| 3 | 2.06 | 2.06 | 2.20 | 0.30 | 2.06 | 2.06 | 2.20 | 0.60 | 1.93 | 1.78 | 2.08 | 0.45 |
| 6 | 2.26 | 2.26 | 2.26 | 0.31 | 2.11 | 2.11 | 2.26 | 1.06 | 2.14 | 2.29 | 2.29 | 0.59 |
| 12 | 2.08 | 2.08 | 2.08 | 0.90 | 1.63 | 1.78 | 2.08 | 1.48 | 1.84 | 1.99 | 1.99 | 0.91 |
| 18 | 1.65 | 1.65 | 1.81 | 1.03 | 1.08 | 1.08 | 1.52 | 1.51 | 1.25 | 1.55 | 1.55 | 0.91 |
Index of contrast sensitivity
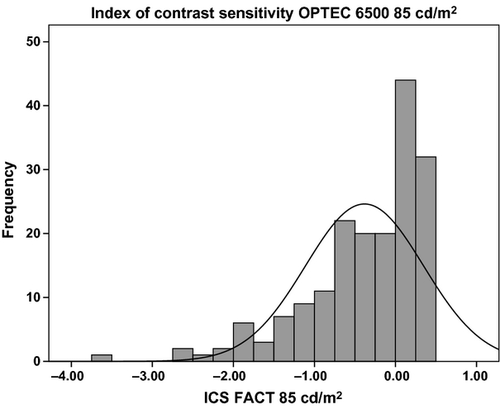
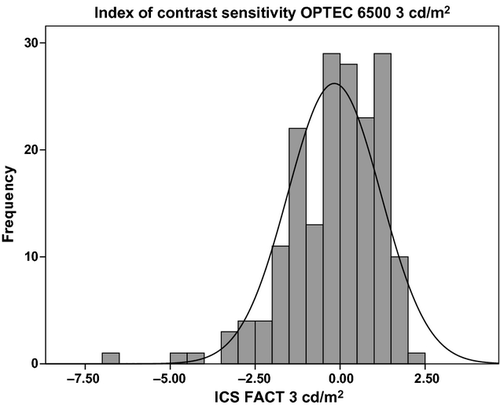
The ICS calculated by all three test methods were considered not normally distributed (Figs 2-4) and by Shapiro–Wilk test (p < 0.001). The median ICS based on FACT 85 cd/m2 (ICSFACT85) was −0.15, with mode 0.16 and 95% percentile 0.45. For ICS calculated from FACT 3 cd/m2 (ICSFACT3), the median was −0.00, mode −0.37 and 95% percentile 1.62. Using CSV-1000E, ICSCSV median was 0.30, mode 1.20 and 95% percentile 1.35. ICS percentiles for all three ICS is presented in Table 2.
| ICS FACT 85 cd | ICS FACT 3 cd | ICS CSV-1000E | |
|---|---|---|---|
| Index of contrast sensitivity | |||
| Median | −0.15 | −0.00 | 0.30 |
| Mean | −0.38 | −0.17 | 0.06 |
| Std. deviation | 0.73 | 1.37 | 0.85 |
| Percentiles | |||
| 10 | −1.47 | −1.73 | −1.19 |
| 25 | −0.74 | −1.04 | −0.45 |
| 50 | −0.15 | 0.00 | 0.30 |
| 75 | 0.16 | 0.88 | 0.75 |
| 90 | 0.30 | 1.33 | 1.05 |
| 95 | 0.45 | 1.62 | 1.20 |
Agreement
The agreement between ICS calculations based on our three test methods were analysed using Bland–Altman plots and by calculating the LoA and by paired sample t-test and Wilcoxon signed-rank test. Wilcoxon signed-rank test did not differ from paired sample t-test (p-values not reported) indicating the ability to use parametric methods to evaluating agreement.
ICSFACT85 compared with ICSCSV showed a mean difference on the average of the two tests of −0.43 with 95% LoA within −2.10 and 1.22. The lower average score on ICSFACT85 was consistent as mean of differences of the pair was significantly different (paired t-test, 95% CI −0.56 to −0.30, p < 0.00). The trend analyses showed a fairly consistent correlation between the two measurements with a near to zero regression line (R2 = 0.03). See Fig. 5.
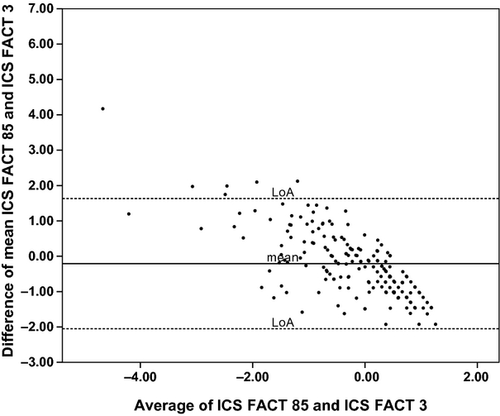
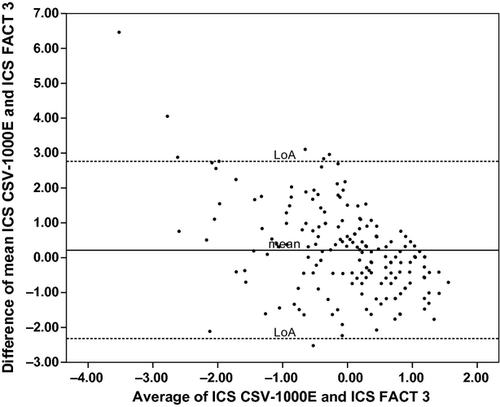
When comparing ICSFACT85 and ICSFACT3, the mean difference was −0.22 (95% CI −0.36 to −0.08, p = 0.002) and LoA were −2.18 and 1.75. There was a marked trend of increasing difference at increased average score (R2 = 0.52). See Fig. 6. ICSFACT3 and ICSCSV showed a significant mean difference of 0.20 (95% CI 0.01–0.40, p = 0.04), but the regression line indicated lack of agreement throughout the test range (R2 = 0.23). The LoA were fairly wide (−2.32 and 2.76), but the clinical implications of this are still to be investigated. See Fig. 7.
Discussion
The purpose of the study was to describe the population norms of contrast sensitivity measured by two different test methods in a young, healthy population selected for duty with high visual demands. Several occupations have strict visual qualification limits with requirements of high visual acuity, both corrected and uncorrected. Applicants for such jobs are typically below 25 years of age and meet visual selection criteria of 1.0 at Snellens table.
The relevance of high-contrast visual acuity measured by Snellen or other equivalent test is debated, and Ginsburg (2003) has argued in detail why CS is more relevant when evaluating visual function. Several different commercial tests are available to test contrast sensitivity, but Amesbury & Schallhorn (2003) states that the clinical relevance of CS is not well understood. In addition, there is little consensus regarding the best method to test CS. Unlike tests for other elements of vision, there are no universally recognized standard test method to measure CS. The CS tests currently available use either gratings or ortotypes as targets. There are a variety of grating charts for CS testing. In this study, we have chosen to evaluate two commercially available systems using charts with sine wave grating in different spatial frequencies, the Optec 6500/FACT and CSV-1000E. In order for these tests to be relevant for interchangeably use and medical selection purposes, they have to yield fairly similar results, and the tests must show relevance to real-life situations.
Previously, normal data for the Optec 6500/FACT and the CSV-1000E have been published by Owsley et al. (1983), Wachler & Krueger (1998), Adams & Courage (2002), Swamy (2002), Hohberger et al. (2007) and Haughom & Strand (2013). These studies had relatively wide inclusion criteria regarding age and/or visual acuity, and none of them estimated agreement with other test methods. Wachler & Krueger (1998), Swamy (2002) and Haughom & Strand (2013) described normality by parametric methods, while Hohberger et al. (2007) used AUC as a measure of CS.
In our strictly selected population, we report CS for each frequency and ICS reference values examined in the tests. The calculated ICS values were used to estimate the agreement between the test methods. All three tests showed skewness of data and a marked ceiling effect. This was most prominent in the photopic tests and in low frequencies. Thus, in FACT 85 cd/m2, 75% of the participants made the highest score at 1.5 and 65% at 6 cpd. In FACT 3 cd/m2, only three made the highest score and ten just made the entry level at 18 cpd. Skewness combined with only minor differences within the study group suggested the use of nonparametric methods for describing normal data (Armstrong et al. 2011). In our study, the population was limited to the age group most relevant for medical selection to positions with high visual demands, and all participants had visual acuity within the limits of acceptance to duty as a naval pilot. Differences regarding both study populations and statistical methods prevent direct comparison between our results and those previously reported.
Percentiles may also describe the levels of achieved score. The skewness and ceiling effect also reduces the usefulness of this method. As shown in Table 1, the 95% percentile was equivalent to highest score and mode for a majority of the frequencies except in the high FACT 3 cd/m2 frequencies. Such a pronounced ceiling effect has previously been claimed to limit the usefulness of CS tests (Pesudovs et al. 2004; Buhren et al. 2006). This is correct if the purpose is to detect subtle loss or change of CS. However, CS tests may conceivably also be used in strictly selected populations to correlate the visual ability of each individual related to task performance, hopefully establishing a CS cut-off value at the lowest acceptable performance. Participants making high visual score must all be expected to be in the high CS performance group. For such selection purposes, the ceiling effect is not as problematic as a marked floor effect would have been. In our study, all participants made the entry level on each frequency and the flooring effect was not present.
The pronounced single frequency ceiling effect will influence ICS by reducing the score in the high performance area. The clinical implication is considered small, as long as the flooring effect is not evident. When calculating ICS for all three tests, the distribution of ICS made it possible to establish useful percentiles in the range from 10 to 100%. ICS normal data have been presented by Haughom & Strand (2013), but their population characteristics differed from ours to such an extent that the value of comparing the study results is low. As they point out, normal data are only relevant for similar populations.
The present study aimed to evaluate whether the three tests can be used interchangeably to measure contrast sensitivity. One method can be used as a substitute for another if they yield similar results. Agreement studies by Pesudovs et al. (2004) compared Vistech and FACT wall charts in a normal population of 33 subjects, testing for intraclass correlation and establishing Bland–Altman limits for each frequency. Similar studies were also published by Hong et al. (2010) and Franco et al. (2010), who looked at agreement and repeatability between Optec 6500/FACT (85 cd/m2) and Vision Contrast Test System 6500 (120 cd/m2). All these studies found low correlations in-between tests. In our study, we have used the calculated ICS values to evaluate the agreement between the examined test methods. By definition, ICS was still not normally distributed, but transformation made the data close enough to normal distribution to allow agreement study by the Bland–Altman method. The method is believed to be fairly robust, and according to Bunce (2009), an inspection of histogram is sufficient to decide this.
The interpretation of the agreement analysis is based on clinical considerations. The relevance of ICS has never been tested in real-life or in simulated situations, and the clinical importance of a difference in mean on average of 0.43, as when comparing ICSFACT85 and ICSCSV, is still open to question. The same considerations must be made when evaluating the 95% levels of agreement. The LoA were fairly wide, −2.20 and 1.34, but the clinical implication of this is still to be investigated. ICSFACT3 agreement to ICSFACT85 and to ICSCSV showed a different pattern. Evidently, the ICSFACT 3 frequently differs from ICSFACT85 and ICSCSV, making it unsuitable to be used interchangeably with the two other tests.
A major difference between the photopic (ICSFACT85 and ICSCSV) and the mesopic (ICSFACT3) test is the spread of results. The photopic tests showed a range of 4.06 and 4.68, compared with 8.97 in the mesopic test. This was partly due to one outlier in the Norwegian cohort. This recruit had low scores on high frequencies in FACT 3 cd/m2, just making the entry level of the test. His visual acuity LogMAR score was −0.04 in one eye and 0.04 in the fellow eye. He did not report any eye condition that could explain the low ICS score. In a review, Fan-Paul et al. (2002) points out the occurrence of dark vision disturbances after refractive surgery, but if this was the case in our study is unknown. Previous refractive surgery was an exclusion criterion in our study, but this was only checked by the obtained self-reports. Another possible explanation is the phenomena of night myopia, which is only partly understood (Artal et al. 2012). The phenomenon is elusive and only present in very low light conditions (<0.02 cd/m2) and up to 30 min of dark adaption. Our participants were not exposed to such conditions, and night myopia therefore probably does explain the reduced mesopic performance of this recruit. The increased range in test results may indicate that mesopic tests are more sensitive to dark vision disturbances then photopic tests.
The lack of objective control of the self-reports may be a weakness in this study. The French cohort was all selected for duty as aviators and had undergone ophthalmological examination at admission to duty. The Norwegian participants were screened by naval physicians prior inclusion in the study, and this cohort thus reflects a less vigorously examined population.
During the study, none of the participants wore corrective lenses. Although visual acuity 0.00 LogMAR is normally not considered an indication for using corrective lenses, it is well known that young adults frequently have a corrected visual acuity better than LogMAR 0.00 (Elliott et al. 1995; Colenbrander 2008) . Haughom & Strand (2013) found that slightly undercorrected myopia decreased the CS performance in both photopic and mesopic conditions. In an ordinary selection process, visual acuity 0.00 LogMAR is sufficient for entering any kind of work in maritime or aviation industry. We might have found even higher levels of CS if we had fitted the study population with optimal corrective lenses, but this would have created a non-realistic setting in our further studies and in relevant use of the data in other settings.
Agreement CS studies often include repeatability studies. The outcomes of these studies have been divergent, but often indicating low repeatability. Pesudovs et al. (2004) found low test–retest repeatability in FACT measured by intraclass correlation coefficient (ICC) and coefficient of repeatability (CoR). There were no significant differences between mean test and retest scores, but the average test–retest ICC was 0.34, and the average CoR was 0.35. Ideally, ICC should be close to one and CoR as near zero as possible. Kelly et al. (2012) investigated CSV-1000 and found estimates for ICC and CoR indicating low repeatability for all frequencies. On the other hand, Pomerance & Evans (1994) found acceptable CoR (mean 0.19) for CSV-1000. Hong et al. (2010) reported acceptable ICC (mean 0.85) for FACT, but poorer results for CoR (0.27). According to Miller (2008), the test–retest reliability should be estimated using a time interval that mirrors the actual use of the test, rather than trying to maximize the value of the coefficient. Our study design did not allow us to do reliability tests in what could be regarded as a relevant timeframe. Pesudovs et al. (2004) and Kelly et al. (2012) discuss in detail possible reasons for the difference in repeatability. They indicate that the main reason may be difference in test procedure. In our study, we asked the candidates not to guess when they could not positively identify the gratings. If the observer suspected guessing, the candidate made another try after the test procedure had been clarified. This was also performed if the results indicated that the candidate had not understood the test procedure. In our study, Optec 6500/FACT and CVS-1000E tests were performed by two different examiners. This may account for test differences due to systematic variations between the observers. Kelly et al. (2012) did not consider interobserver variation to be a major issue, as repeatability of CS data obtained by one or two examiners did not differ significantly. On the other hand, Elliott & Whitaker (1992) found highly significant differences between optometrists measuring both VA and CS. As stated by Miller (2008), increasing number of study participants will decrease the variation due to examiners or subjects. The narrow confidence intervals on the LoA in the present study indicate a low variance. ICC reported in other studies is not valid for use in evaluation of ICS, as these studies are performed on single frequency reports. In further studies using the ICS, it is therefore necessary to establish estimates of the repeatability coefficient.
Conclusion
Reference values for Optec 6500/FACT (85 cd/m2 and 3 cd/m2) and CVS-1000E (85 cd/m2) were established in a young, healthy population with uncorrected visual acuity 0.00 LogMAR or better. The data showed a marked ceiling effect for all frequencies of photopic and most frequencies of mesopic vision. Reference values for ICS based on the frequency data in the same population were calculated, and agreement between ICS for each test was tested. The agreement between the photopic tests was promising, but so far evidence for clinical use of ICS is missing. There was little agreement between mesopic and photopic CS tests. The mesopic test seemed to differentiate better between the candidates and may thus be most useful for medical selection purposes.


