Morphological and functional differences between normal-tension and high-tension glaucoma
Abstract.
Purpose: To compare visual field (VF) and nerve fibre loss in patients with normal-tension (NTG) and high-tension glaucoma (HTG) at an equal level of glaucomatous structural damage of the optic nerve head (ONH).
Methods: In a retrospective, pair-matched, comparative study, 126 eyes with NTG and 126 eyes with HTG were matched according to the same glaucomatous ONH damage based on rim volume, rim area and disc size measured by the Heidelberg Retina Tomograph (HRT III). Visual field by Humphrey perimetry and nerve fibre layer thickness measured by scanning laser polarimetry (GdxVCC) were compared between both groups.
Results: Based on the HRT, NTG and HTG displayed comparable structural damage of the ONH without a statistically significant difference between both groups (mean, NTG/HTG: disc area 2.32/2.32 mm², p =0.342; rim area 1.03/1.00 mm², p = 0.279; rim volume 0.2/0.19 mm³; p = 0.274). Eyes with NTG had significantly less VF damage than eyes with HTG (mean, NTG/HTG: mean deviation (MD) −3.69/−9.77 dB, p = 0.0001; pattern standard deviation (PSD) 4.80/7.17 dB, p = 0.0001). The nerve fibre layer of NTG patients was thicker than that of HTG patients (mean, NTG/HTG: GDx total: 46.9/44.0 μm, p = 0.073; GDx superior: 57.2/49.9 μm, p = 0.0001; GDx inferior: 54.9/49.7 μm, p = 0.001).
Conclusions: At an equal level of glaucomatous structural damage of the ONH indicated by cupping, rim area and rim volume, NTG patients seem to have a less affected visual field and a better preserved nerve fibre layer than HTG patients.
Introduction
Glaucoma encompasses a group of disorders with heterogeneous aetiology and is characterized by progressive damage of retinal ganglion cells, their axons and associated glial cells. Glaucoma causes characteristic morphological changes of the optic nerve head (ONH) resulting in associated defects of the visual field.
Among open angle glaucomas, normal-tension glaucoma (NTG) forms a special entity. Despite modern technologies for the examination of the optic nerve and visual field, functional and morphological differences between NTG and open angle high-tension glaucoma (HTG) is a controversial topic. Previous studies showed that the morphology and function of the ONH in eyes with NTG is identical to those with HTG (Motolko et al. 1982; Lewis et al. 1983; Miller & Quigley 1987; Yu et al. 1997; Iester & Mikelberg 1999; Nakatsue et al. 2004); however, other studies showed contradictory results. Compared with HTG, NTG causes more centrally located visual field defects (Caprioli & Spaeth 1984; Chauhan et al. 1989; Thonginnetra et al. 2010), deeper scotomas (Hitchings & Anderton 1983) and more extensive structural damage of the optic nerve (Caprioli & Spaeth 1985; Gramer et al. 1986; Yamagami et al. 1992; Araie et al. 1993; Eid et al. 1997; Kiriyama et al. 2003).
These controversial findings among various studies may be due to selection bias. Specifically, HTG is detected by higher IOP or visual field defects, whereas NTG, especially in the early stages, is often underdiagnosed due to ‘normal’ pressure values. Furthermore, results of previous studies may be contradictory due to differences in study methodology, for example, including patients at different stages of glaucoma. All these factors make a comparison of study results difficult.
However, if differences in the correlation between clinical and morphological findings are truly present, then different pathogeneses of glaucoma with and without elevated IOD may be hypothesized (Fazio et al. 1990; Van Buskirk & Cioffi 1992; Tomita 2000, Heijl 2011).
To avoid problems when comparing patients at different stages of structural damage of the ONH, in the present study an existing glaucoma database was used to assess visual field and nerve fibre layer in pairs of patients with NTG or HTG, which were matched according to the same extent of structural glaucomatous damage.
Methods
Patients
Inclusion criteria
NTG patients were included if all of the following criteria were met: (i) glaucomatous optic disc appearance based on the presence of neuroretinal rim thinning, notching, excavation, nerve fibre layer defects and an asymmetry of the vertical C/D ratio of more than 0.2 between both eyes, (ii) history of IOP without treatment <22 mmHg, (iii) wide and open angle on gonioscopy, (iv) no other obvious causes for optic nerve damage. HTG patients were included if they met the same criteria, except for the IOP, which needed to be >21 mmHg. Such cases were referred to as high-tension glaucoma (HTG) eyes.
Exclusion criteria
To avoid the influence of possible cerebral lesions (silent infarct) in the visual field (VF) or diminished visual acuity due to opacification of the lens, we excluded patients elder than 65 years of age (Leung et al. 2009). The following exclusion criteria were also applied: (i) best-corrected visual acuity <0.5 (decimal scale), (ii) apparent refractive media opacification, (iii) refractive error exceeding +/− 5D, (iv) concomitant ocular disease, (v) anomaly of the optic pit and micro- or macropapilla (<1.8 or >2.8 mm²), (vi) poor reliability scores in the SAP, which was defined as a false-negative rate >30%, false-positive rate >30% or fixation loss >20%, (vii) surgical procedures within the last 12 months.
The present study was conducted as a retrospective, comparative, case-matched investigation.
Patients’ data were recruited from the glaucoma database of the Department of Ophthalmology at the University of Dresden between 2006 and 2010. The glaucoma database provides data for all glaucoma, ocular hypertensive patients and glaucoma subjects visiting the Department of Ophthalmology at the University of Dresden for a 24-hr IOP profile. IOP measurements are taken at 7.00 a.m, 12.00 p.m, 4.00 p.m, 7 00 p.m (in sitting position) with Goldmann applanation tonometry (GAT) and at 0.00 a.m (in supine position) with Perkins tonometry after 1 hr of rest. The database contains information about each patient′s history, medication, visual acuity, refraction and a complete eye examination including the evaluation of the optic disc.
Additional diagnostic procedures includes pachymetry (IOPac; Heidelberg Engineering, Heidelberg, Germany), optic nerve head topography (HRT III; Heidelberg Engineering GmbH, Heidelberg, Germany), scanning laser polarimetry (GDx-VCC; Zeiss Meditec, Dublin, CA, USA) and a standard automated perimetry 30-2 full threshold program (Humphrey perimetry; Carl Zeiss Meditec, Inc.,).
For the present study, a retrospective analysis of patients with NTG and HTG was performed. One eye of each patient was randomly assigned for further analysis. To provide a reliable case-by-case match of HTG and NTG eyes, an equal optic disc size as measured by HRT III and an equal estimated excavation of the optic disc were chosen. Both parameters were derived from the glaucoma database. In case of multiple data records, a further subanalysis using an equal age distribution in both groups was conducted. As HRT (except from optic disc size), GDx and visual field parameters were not part of the database, these data were collected manually from each patients′ file after the above-mentioned subgroup analyses had been obtained (F.S.). Overall, 126 eyes of 126 patients were matched on a case-by-case basis to 126 eyes HTG eyes according to the same morphological parameters, namely same optic disc size and same optic disc excavation.
Visual field analysis
The visual field (VF) of the subjects was analysed with Humphrey Perimeter program 30-2 (Carl Zeiss Meditec, Inc.,). Only reliable results obtained from the visual field examination were used, as determined by the reliability parameters described above. The mean deviation (MD), pattern standard deviation (PSD) and the probability symbols of the PSD (VF PS <5 to 0.5%) were used to describe the cohort of subjects.
Optic disc analysis
The optic disc of each eye was analysed with hrt running software version 3.1 (HRT III; Heidelberg Engineering GmbH). The optic nerve head analyzer records simultaneous stereoscopic videographic images of the optic disc to determine the disc area, cup-disc ratio, neuroretinal rim area and neuroretinal volume. The optic disc margin outline was drawn with a specialized observer using a computer mouse system and was verified by two of the authors (J.H, N.T). Details of the operational parameters of the instrument have been published previously (Shields et al. 1987; Lusky et al. 1993; Mikelberg 1993).
Nerve fibre layer analysis
The retinal nerve fibre layer of each eye was studied by laser polarimetry on a GDxVCC (Carl Zeiss Meditec). Technical details of the GDxVCC and possible sources of error have been described elsewhere (Weinreb et al. 1995). If polarized light travels faster through tissue in one direction than light polarized in the perpendicular direction, a phase shift occurs between both light beams and is referred to as retardation. Under the assumption that the density of the birefringence structures is homogenous, equal and constant, the phase shift is proportional to the thickness of the birefringence material. The optic axis of retinal birefringence is dependent on the orientation of the retinal nerve fibre, and the magnitude of retardation is correlated to its thickness (Weinreb et al. 1990). The apparatus contains a confocal scanning laser ophthalmoscope with a polarizing and polarization-analysing unit. The summed retardation pattern of the anterior segment and the Henle fibre layer of the macula are used to eliminate the effects of polarization of the anterior segment (Van Blokland & Verhelst 1987). All retardation values were transformed into RNFL thickness values, which were used for the analysis. The following GDx parameters were used in the calculation: superior average (GDx inf) and inferior average (GDx sup). RNFL thickness maps with atypical retardation patterns were not used in the present study (Da et al. 2006).
Statistical analysis
spss (version 17.0, SPSS Science, Chicago, IL, USA) was used for statistical analyses. Visual acuity data were converted to a logarithmic (logMar) scale. Nonparametric tests (Wilcoxon Test) were used to compare morphological and functional variables of the two glaucoma groups. To assess correlations between morphological and functional variables within each group, the Spearman’s correlation coefficient was used. An analysis of covariance was conducted to evaluate the effect of surgical procedures on the visual field, visual acuity and nerve fibre layer. p-values <0.05 were considered statistically significant.
Results
Overall, 126 patients with NTG and 126 patients with HTG were included in the present analysis. The demographic data are shown in Table 1.
| Pairs N | NTG | HTG | p | |
|---|---|---|---|---|
| mean ± SD | mean ± SD | |||
| Age (years) | 126 | 58.2 ± 8.50 | 57.4 ± 5.78 | 0.164 |
| Sex (m/f) | 126 | 52|74 | 63|63 | 0.15 |
| Visual acuity (logMar) | 126 | 0.03 ± 0.07 | 0.08 ± 0.14 | 0.002 |
| Spherical refractive error (dpts) | 126 | −0.28 ± 1.45 | 0.0 ± 1.40 | 0.452 |
| IOP max (mm Hg) | 126 | 18.8 ± 2.04 | 29.6 ± 7.90 | 0.0001 |
| IOP (mm Hg) | 126 | 13.8 ± 2.53 | 15.9 ± 4.64 | 0.0001 |
| Pachymetry (μm) | 126 | 545 ± 35 | 544 ± 35 | 0.716 |
- p-values <0.05 are indicated in bold.
Significant differences between age and gender were not observed between HTG and NTG (p = 0.1.64 and p = 0.15). The maximum untreated IOP and the IOP under treatment were significantly lower in NTG patients compared with HTG patients (p < 0.0001). Visual acuity was significantly better in NTG than in HTG patients (p < 0.002). Except from laser therapy, patients with HTG had more surgical interventions than NTG patients (Table 2). Covariance analysis showed that previous surgical interventions and lasertrabeculoplasty did not have a significant effect on visual field loss (VF MD, all p > 0.05).
| N | NTG | HTG | p | |
|---|---|---|---|---|
| Pseudophakia | 126 | 1 | 8 | 0.020 |
| ALT/SLT | 126 | 15 | 14 | 1.000 |
| CPC | 126 | 2 | 13 | 0.005 |
| Trabeculectomy | 126 | 3 | 16 | 0.005 |
- p-values <0.05 are indicated in bold.
- ALT=Argon laser trabeculoplasty; SLT=Selective laser trabeculoplasty, CPC=Cyclophotocoagulation.
Morphological parameters of the ONH measured by HRT were not significantly different (NTG/HTG: disc area 2.32/2.32 mm², p = 0.342; rim area: 1.03/1.0 mm², p = 0.279; rim volume: 0.2/0.19 mm³, p = 0.274, Fig. 1). However, a statistically significant but clinically not relevant difference in the mean of the estimated cup/disc ratio was observed (NTG/HTG: disc area 0.83/0.85, p = 0.003).
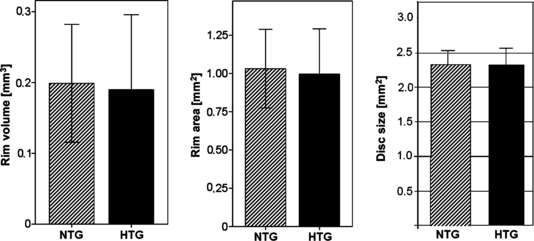
Rim volume, rim area and disc size in NTG and HTG showing no statistically significant difference between NTG and HTG (rim volume: p = 0.274, rim area: p = 0.279, disc size: p = 0.342).
The thickness of the nerve fibre layer as measured by confocal scanning laserpolarimetry GDx showed that NTG patients had a thicker nerve fibre layer compared with HTG (NTG/HTG: GDx total 46.9/44.08, p = 0.073; GDx superior 57.2/49.9 μm, p = 0.0001; GDx inferior 54.9/49.7, p = 0.001; Table 3). Visual field defects in NTG and HTG patients were significantly different. NTG patients had significantly fewer defects (NTG/HTG: VF MD −3.69/−9.77 dB, p = 0.0001; VF PSD: 4.80/7.17 dB, p = 0.0001, Table 3).
| N | NTG | HTG | p | |
|---|---|---|---|---|
| mean ± SD | mean ± SD | |||
| GDx total (μm) | 126 | 46.9 ± 7.6 | 44.08 ± 10.0 | 0.073 |
| GDx superior (μm) | 126 | 57.2 ± 10.4 | 49.91 ± 13.12 | 0.0001 |
| GDx inferior (μm) | 126 | 54.9 ± 10.5 | 49.72 ± 11.94 | 0.001 |
| VF MD (dB) | 126 | −3.69 ± 5.03 | −9.77 ± 7.99 | 0.0001 |
| VF PSD (dB) | 126 | 4.80 ± 4.47 | 7.17 ± 4.41 | 0.0001 |
| VF PS < 5% | 126 | 3.92 ± 2.86 | 4.48 ± 2.80 | 0.088 |
| VF PS < 2% | 126 | 1.98 ± 2.06 | 3.01 ± 2.46 | 0.0001 |
| VF PS < 1% | 126 | 1.55 ± 2.03 | 3.30 ± 2.86 | 0.0001 |
| VF PS < 0.5% | 126 | 6.25 ± 10.55 | 18.04 ± 17.50 | 0.0001 |
- p < 0.05 values are indicated in bold.
- VF MD=Visual field mean deviation; VF PSD=Visual field pattern standard deviation; VF PS=Visual field probability score (<5 to <0.5%).
A significant correlation between the reduction in total nerve fibre layer (GDx total) and rim area was observed in NTG and HTG patients (NTG: R = 0.297, p = 0.006, HTG: R = 0.496, p = 0.0001, Fig. 2).
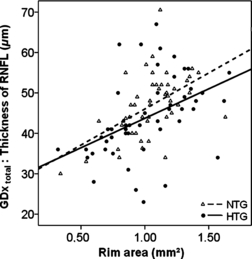
Thickness of total RNFL in μm (GDx total) (ordinate) plotted versus the rim area for NTG and HTG (NTG: R = 0.297, p = 0.006, HTG: R = 0.496, p = 0.0001).
A correlation between the reduction in total nerve fibre layer (GDx total) and rim volume was observed in NTG patients and HTG patients, which statistical significance in the HTG group only (NTG: R = 0.189, p = 0.084, HTG: R = 0.531, p = 0.0001, Fig. 3).
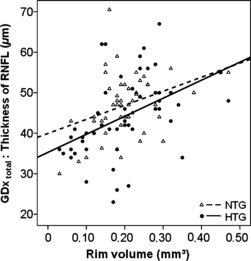
Thickness of total RNFL in μm (GDx total) (ordinate) plotted versus the rim volume in mm3 for NTG and HTG (NTG: R = 0.189, p = 0.084, HTG: R = 0.531, p = 0.0001).
A correlation between the reduction in total nerve fibre layer (GDx total) and reduction in retinal nerve fibre layer (HRT) was observed in NTG patients and HTG patients with statistical significance in the HTG group only (NTG: R = 0.152, p = 0.165, HTG: R = 0.443, p = 0.0001, Fig. 4).
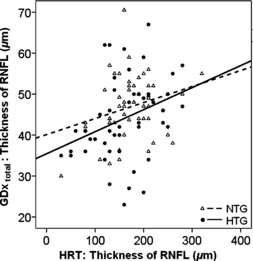
Thickness of total RNFL in μm (GDx total) (ordinate) plotted versus the RNFL (HRT) for NTG and HTG (NTG: R = 0.152, p = 0.165, HTG: R = 0.443, p = 0.0001).
A significant correlation between the reduction in nerve fibre layer (GDx total) and VF damage (MD) was observed in NTG and HTG patients (NTG: R = 0.273, p = 0.011, HTG: R = 0.562, p = 0.0001, Fig. 5).
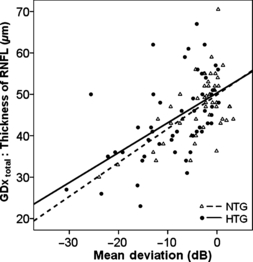
Thickness of the total RNFL in μm (GDx total) (ordinate) plotted versus the mean deviation in dB for NTG and HTG (NTG: R = 0.273, p = 0.011, HTG: R = 0.562, p = 0.0001).
A significant correlation between VF damage (MD) and rim area was observed in NTG and HTG patients (NTG: R = 0.214, p = 0.016, HTG: R = 0.498, p = 0.0001, Fig. 6).
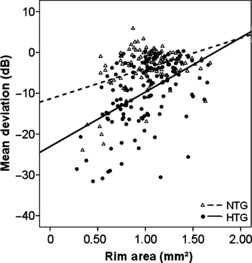
Mean deviation (MD) in dB (ordinate) plotted versus the rim area in mm2 for NTG and HTG (NTG: R = 0.214, p = 0.016, HTG: R = 0.498, p = 0.0001).
A significant correlation between the reduction in retinal nerve fibre layer (HRT) and reduction in MD was observed in NTG and HTG patients with statistical significance in the HTG group only (NTG: R = 0.146, p = 0.102, HTG: R = 0.442, p = 0.0001, Fig. 7).
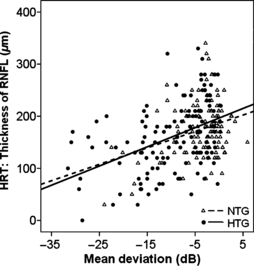
Thickness of the RNFL in μm (HRT) (ordinate) plotted versus the mean deviation in dB for NTG and HTG (NTG: R = 0.146, p = 0.102, HTG: R = 0.442, p = 0.0001).
Discussion
In the present study, structural and functional parameters, namely visual field loss and nerve fibre layer thickness, were compared between NTG and HTG based on the same glaucomatous ONH damage, namely rim volume, rim area and disc size as measured by the HRT. Significant differences in visual field loss and in the thickness of the retinal nerve fibre layer were detected between NTG and HTG patients. Patients with NTG presented a thicker (and better preserved) retinal nerve fibre layer, especially of the superior and inferior bundle compared with HTG patients.
Our findings are consistent with results of recent studies but are in conflict with some others. Chauhan and coworkers demonstrated that NTG caused more localized damage, while a more diffuse damage was observed in patients with HTG (Chauhan et al. 1989). Caprioli and Spaeth showed that NTG patients possessed a deeper slope of scotoma that was closer to fixation than in HTG patients (Caprioli & Spaeth 1984). In contrast, other studies did not reveal significant differences in visual field parameters between HTG and NTG (Motolko et al. 1982; Fazio et al. 1990; Iester & Mikelberg 1999; Nakatsue et al. 2004; Thonginnetra et al. 2010). Kiriyama and colleagues conducted a study in HTG, NTG and ocular hypertensive patients showing that NTG patients had a significantly reduced rim area and a higher cup-to-disc ratio and rim volume than other patients with similar visual field damage (Kiriyama et al. 2003). These results have also been corroborated by other studies (Caprioli & Spaeth 1985; Gramer et al. 1986; Yamagami et al. 1992). Assuming a close correlation between visual field loss, optic disc deterioration and retinal ganglion cell atrophy (Chauhan et al. 2001) at a nearly equal level of structural damage of the ONH, it might be reasonable to hypothesize that patients with NTG have less visual field damage than patients with HTG. We analysed correlations between disc cupping and retinal nerve fibre layer and visual field damage in HTG and NTG. Similar to HTG, increased cupping was significantly correlated to a reduction in nerve fibre layer and greater visual field loss in NTG patients.
Compared to patients with HTG and similar levels of glaucomatous ONH damage, NTG patients presented a more preserved visual field and nerve fibre layer; however, the underlying cause of this result remains unclear. In our opinion, this may be due to differences in the structure of the ONH. The ONH consists of nerve fibres, glial and vascular tissue (Burgoyne & Downs 2008). In the anterior ONH, nerve fibres comprise about 90% of the tissue volume (Radius 1989). Thus, cupping in NTG patients could be due to a loss of glial and vascular tissue rather than a result of nerve fibre loss. The number of nerve fibres in the rim area is substantially higher in NTG than in HTG patients. These results are confirmed by findings of Yamagami et al. demonstrating that patients with NTG possessed significantly smaller rim areas than those with HTG, corresponding to a hemifield without an apparent visual field defect (Yamagami et al. 1992). Consecutively, these results suggest that the number of nerve fibres in patients with NTG or HTG is not different, and that differences in the rim area might be present at very early stages of the disease. Interestingly, in the present study, we observed a significant correlation between GDx thickness of the RNFL and decreasing rim size (p = 0.0001), rim volume (p = 0.0001) and RNFL (p = 0.0001) by HRT in HTG patients which might be the result of a primary damage of nerve fibres. In contrast, in NTG patients, we found a significant weaker correlation between GDx thickness of RNFL with decreasing rim size (p = 0.006), rim volume (p = 0.084) and RNFL thickness by HRT (p = 0.165), which might indicate an early loss of glial and vascular tissue rather than a nerve fibre loss in these patients. Our results are also confirmed by findings of Gramer et al. who suggested that the ONH in NTG may have less connective tissue, or nerve fibre loss in NTG may be preceded by the impairment of connective tissue (Gramer et al. 1986). Further studies are definitely needed to investigate this special topic in more detail.
The present study is limited by its retrospective design. However, we assume that a comparison of pairs of equal structural and functional damage of the ONH on a case-by-case basis between HTG and NTG patients would otherwise not have been possible. Secondly, the use of the GDx as an indirect method to investigate retinal nerve fibre layer might have been imprecise. The use of an OCT device would have certainly provided better data about the nerve fibre layer.
In summary, the results of the present study showed that NTG patients at an equal level of glaucomatous structural damage indicated by cupping, rim area and rim volume, seemed to have a less affected visual field and a better preserved nerve fibre layer than HTG patients.


