Semiautomated quantification of β-zone parapapillary atrophy using blue light fundus autofluorescence
Presented in part at: American Academy of Ophthalmology Annual Meeting, October 2011, Orlando, Florida.
Abstract.
Purpose: To evaluate the reproducibility of measurements of area of β-zone parapapillary atrophy (β-PPA) using blue laser fundus autofluorescence (FAF) and confocal scanning laser ophthalmoscopy reflectance (CSLO) measurements and to assess agreement between the two imaging modalities.
Methods: Sixty-five eyes of 45 patients (mean age, 68.2 ± 11.3 years) with established or suspected glaucoma from the Diagnostic Innovations in Glaucoma Study (DIGS) were prospectively included. FAF scans were obtained with the Spectralis HRA+OCT and CSLO reflectance images with the HRTII (both from Heidelberg Engineering, Heidelberg, Germany). Two masked graders independently measured β-PPA area on 3 consecutive scans using the semi-automated BluePeak RegionFinder software (BPRF) and on CSLO reflectance images using the optic disc contour line. Reproducibility of β-PPA area measurements was assessed using intraclass correlation coefficients (ICC).
Results: Intragrader reproducibility was 0.997 (95% CI, 0.996–0.998) and 0.995 (95% CI, 0.992–0.996) for grader 1 and 2, respectively, using FAF-BPRF, and by CSLO, it was 0.991 (95% CI, 0.986–0.994) and 0.988 (95% CI, 0.982–0.992). Intergrader agreement (ICC) was 0.53 (95% CI, 0.331–0.685) for FAF-BPRF and 0.404 (95% CI, 0.149–0.601) for CSLO (comparison between ICC, p = 0.368). Agreement (ICC) between the two devices was worse for grader 1 (0.356; 95% CI, 0.129–0.549) than grader 2 (0.856; 95% CI, 0.774–0.910) (p < 0.001).
Conclusions: Despite excellent intragrader reproducibility for β-PPA measurements with FAF-BPRF and CSLO, intergrader reproducibility is low to moderate. Measurements of β-PPA area obtained with the two instruments are of moderate agreement and, therefore, are not interchangeable.
Introduction
Glaucoma is a progressive optic neuropathy characterized by structural changes in the intrapapillary and parapapillary region of the optic nerve head, including narrowing of the neuroretinal rim and thinning of the retinal nerve fibre layer (RNFL). (Airaksinen & Drance 1985; Drance 1989; Mansouri et al. 2011) Some patients with glaucoma have partial or complete retinal pigment epithelium disruption and photoreceptor loss with visible sclera and large choroidal vessels in the parapapillary area adjacent to their optic disc (Jonas et al. 1989; Kubota et al. 1993; Lee et al. 2010; Park et al. 2010) know as β-zone parapapillary atrophy (β-PPA). Although nonspecific, β-PPA is more common in patients with glaucoma than in healthy individuals, (Jonas & Naumann 1989; Jonas 2005; Lee et al. 2011) and its presence (Teng et al. 2010) and enlargement has been related to glaucoma progression. (Uchida et al. 1998; Heltzer 1999; Radcliffe et al. 2008; Teng et al. 2010) Therefore, detection of changes in β-PPA may facilitate detection of glaucoma progression.
Despite the demonstrated clinical importance of β-PPA in glaucoma evaluation and treatment, methods for automated and quantitative evaluation of the area of β-PPA and its changes over time are limited. While there is no gold standard for β-PPA assessment, review of colour stereophotographs of the optic disc is commonly used. (Budde & Jonas 2004) Automated alternation flicker has also been described to detect change in β-PPA, in which two serial digital optic nerve photographs are aligned and alternated to detect small structural changes over time. (Vanderbeek et al. 2010) These techniques, however, provide only qualitative measures of β-PPA and are limited by their subjective nature. (Reus et al. 2010) Planimetry techniques to obtain quantitative β-PPA measurements based on optic disc stereophotographs have been proposed but are laborious, particularly in a clinical setting. (Kono et al. 1999; Jonas et al. 2002) Confocal scanning laser ophthalmoscopy (CSLO) with the Heidelberg Retinal Tomograph (HRT; Heidelberg Engineering, Heidelberg, Germany) is currently the only technology that can provide quantitative measurements of β-PPA area in a relatively easy and reproducible manner. (Park et al. 1996; Kono et al. 1999; Teng et al. 2010).
Recent work has focused on the use of the commercially available CSLO to measure fundus autofluorescence (FAF) in vivo. (Laemmer et al. 2007; Schmitz-Valckenberg et al. 2008) The use of autofluorescence for detection of β-PPA has previously been investigated. (Viestenz et al. 2003; Laemmer et al. 2007) The principle is based on the significantly decreased autofluorescence of β-PPA areas in relation to surrounding areas with intact RPE. (Laemmer et al. 2007) However, quantifiable and objective measurements of autofluorescent area were not obtained, and the clinical utility of the technology was limited to subjective assessment with moderate reproducibility. (Lois et al. 1999).
The recently available commercial Blue Peak RegionFinder software (bprf, software version 2.11, Heidelberg Engineering, Heidelberg, Germany) uses a semi-automated procedure to define and measure areas of significantly decreased autofluorescence in blue laser autofluorescence images. The aim of this study was to assess repeatability and reproducibility of the measured area of β-PPA using Spectralis FAF and BPRF and to compare these areas to those obtained with only CSLO scans.
Patients and Methods
This was a cross-sectional analysis of a cohort study. Sixty-five eyes of 45 consecutive patients with established or suspect glaucoma who participated in the Diagnostic Innovations in Glaucoma Study (DIGS) at the Hamilton Glaucoma Center, University of California, San Diego, (UCSD), were selected for this study. Informed consent was obtained from all participants. The University of California, San Diego Human Subjects Committee approved the methodology. The methods described adhered to the Declaration of Helsinki for research involving human subjects.
To be included, subjects had to have visible β-PPA on stereophotography, as assessed by two independent observers at the DIGS baseline visit. β-PPA was defined as an adjacent zone to the optic disc with atrophy of the retinal pigment epithelium and choriocapillaris, thinning of chorioretinal tissues and visible sclera and choroidal vessels. (Jonas et al. 1989) Other inclusion criteria were as follows: best-corrected visual acuity of 20/40 or better, spherical refraction within ±5.0 dioptres (D) or cylinder correction within 3.0 D, open angles on gonioscopy and no other ocular or systemic disease that could affect the optic nerve or the visual field. Eyes with a coexisting retinal disease, uveitis, non-glaucomatous optic neuropathy or history of refractive surgery were excluded. At baseline and at annual follow-up visits, each subject underwent a comprehensive ophthalmologic examination, including review of medical history, best-corrected visual acuity, slit-lamp biomicroscopy, Goldmann applanation tonometry, gonioscopy, dilated fundoscopic examination using a 78-D lens, stereoscopic optic disc photography and standard automated perimetry (SAP) using either 24-2 Full-threshold or Swedish Interactive Threshold Algorithm (Humphrey Field Analyzer; Carl Zeiss Meditec Inc., Dublin, California). For each eye, central corneal thickness (CCT) was obtained during the same visit using an ultrasound pachymeter (Pachette GDH 500; DGH Technology Inc, Philadelphia, Pennsylvania).
Eyes were classified as glaucomatous if they had repeatable (2 consecutive) abnormal SAP test results on the 24-2 program of the Humphrey visual field analyser (Carl Zeiss Meditec). An abnormal SAP result was defined as having a pattern standard deviation outside the 95% confidence limits or a glaucoma hemifield test result outside the reference range, regardless of the appearance of the optic disc. Glaucoma suspects were defined as eyes with abnormal-appearing optic discs (presence of neuroretinal rim thinning or localized or diffuse RNFL defects indicative of glaucoma, that is, glaucomatous optic neuropathy) by masked stereophotograph assessment without repeatable abnormal SAP results. Glaucoma suspects also included eyes with intraocular pressure greater than 22 mmHg but with healthy-appearing optic discs and without repeatable abnormal SAP results. A normal SAP result was defined as a mean deviation and pattern standard deviation within the 95% confidence limits and a glaucoma hemifield test result within the reference range.
Spectralis fundus autofluorescence and blue peak regionfinder
High-resolution in vivo imaging was performed with a combined instrument (Spectralis HRA+OCT; Heidelberg Engineering, Heidelberg, Germany) that records confocal scanning laser ophthalmoscopy (HRA/CSLO) and spectral-domain optical coherence tomography (SD-OCT) simultaneously. A standardized imaging protocol in which the optic disc was centred was followed in all patients for acquisition of blue light FAF images (λ = 488 nm; emission, 500–700 nm; field of view, 30° × 30°; image resolution, 768 × 768 pixels) With the use of two independent pairs of scanning mirrors, eye movements were registered, and image acquisition was automatically corrected. Images comprising a mean FAF intensity were calculated of 100 single frames.
FAF-BPRF images are digital images in which every pixel represents a well-defined value of autofluorescence signal intensity. The BPRF software utilizes a ‘region growing’ algorithm to measure the area of β-PPA, in that once the operator has identified the centre of a region of decreased autofluorescence corresponding to β-PPA, the algorithm grows towards the borders of the region taking into account all pixels with a signal intensity below a certain threshold. This threshold is defined by a parameter referred to as ‘growth power’ with a higher growth power representing a larger enclosed area. The proper adjustment of this parameter allows for precise quantitative measurements of β-PPA area. In addition, defined regions of β-PPA can be applied to subsequent autofluorescence images, allowing for β-PPA progression analysis.
Two trained graders, masked to patients’ clinical history and visual field results, independently quantified β-PPA areas in square millimetres on the FAF images by BPRF image analysis software. Three consecutive scans, obtained on the same date, were selected. Each grader outlined the optic disc margin on the first image under guidance of stereoscopic photographs of the optic disc, to exclude the optic disc region from the measurements. Similar to atrophic areas, blood vessels exhibit low signal intensity in FAF images. For this reason, blood vessels in the peripapillary region were blocked by manually applying linear constraints whenever they interfered with the measurement β-PPA (1, 2). The number, size and location of blood vessel constraints were at the graders’ discretion. The blocking of the blood vessels was automatically exported to the two subsequent scans. For the evaluation of intragrader variability, each grader consecutively measured the β-PPA area three times on the same FAF images. 1, 2 compare measurements with FAF-BPRF and CSLO. Prior to the grading, an independent observer reviewed all scans and excluded those that were poorly centred, poorly focused or poorly illuminated based on qualitative assessment.

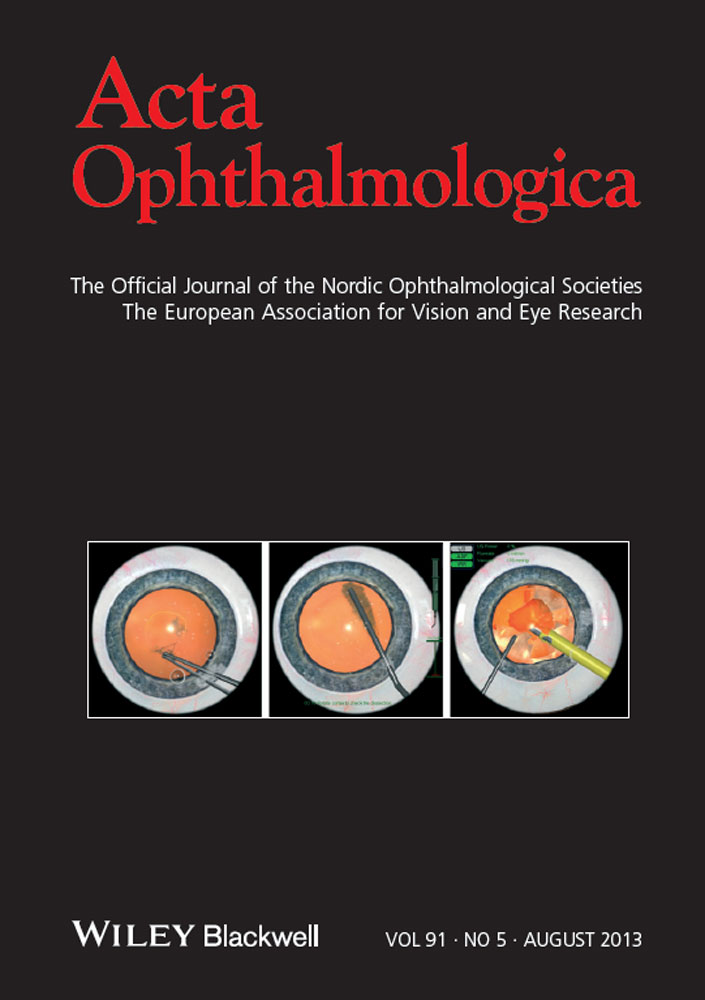
Graded area of hypofluorescence using (A) fundus autofluorescence (FAF) BluePeak RegionFinder software (FAF-BPRF) (image on the left represents the raw FAF-BPRF scan and middle image after manual drawing of an optic disc contour line, vessel blocking and subsequent measurement of the β-zone parapapillary atrophy (β-PPA) and (B) confocal scanning laser ophthalmoscopy (CSLO), green line represents the contour line used for measuring β-PPA and red line is the original reference plane. There is good intragrader agreement within each instrument (grader 1, ICC = 0.83; grader 2, ICC = 0.88) and good intergrader agreement between the two instruments. (FAF-BPRF, ICC = 0.89; CSLO, ICC = 0.82).

Graded area of hypofluorescence using (A) FAF-BPRF and (B) CSLO representing β-PPA. There is good intergrader agreement within the same instrument (FAF-BPRF, ICC = 0.90; CSLO, ICC = 0.77) but poor agreement between the two instruments (grader 1, ICC = 0.49; grader 2, ICC = 0.40).
Confocal scanning laser ophthalmoscopy
Confocal scanning laser ophthalmoscopy images were acquired with the HRT II (Heidelberg Engineering) and analysed using HRT 3 software (Heidelberg Engineering). The HRT CSLO provides topographical measurements of the optic disc and peripapillary retina. Details of the instrument and its principle of use have been described elsewhere. (Zangwill et al. 2005) All images included in the analysis were carefully examined and reviewed by the UCSD Imaging Data Evaluation and Assessment (IDEA) Center staff for proper centring, focus and illumination according to a standard protocol; all mean topography images had a standard deviation of <50 microns. Mean topography images with a standard deviation of ≥50 microns were discarded. We used HRT software version 3.0.6.0 or earlier for image acquisition. Optic nerve reflectance images obtained by HRT were used to evaluate β-zone PPA area. Using the HRT 3 software (version 3.1.2.0), a contour line (normally used for delineating the optic disc margins) was used to outline the margins of β-PPA on the HRT reflectivity images independently by the same two operators with the help of recent optic disc photographs. Using the HRT 3 software (version 3.1.2.0), quantitative assessment of β-PPA was automatically calculated, measuring the area within the delineated contour margin of the β-PPA. Each grader measured the β-PPA area three times on the same CSLO images.
All FAF-BPRF images were baseline images. The CSLO images closest to the FAF-BPRF scans were selected for this study and were obtained no more than 2 years prior to the FAF-BPRF images.
Statistical analysis
To determine the intragrader reproducibility of FAF-BPRF and CSLO β-PPA measurements and agreement between instruments, the intraclass correlation coefficient (ICC) was calculated. Intergrader agreement within each device was also evaluated using ICC. A two-way random effects model, average measure approach was used to calculate ICC so that both subject and grader random effects were taken into consideration. Specifically, there are two machines (FAF-BPRF and CSLO). For each machine, there are two graders. Each grader repeated each measurement 3 times per eye (i.e. 3 measurements). For the intergrader ICC calculations, we used the average of three measurements for each grader. As an example, we considered the average of the measurements of grader 1 for FAF-BPRF versus the average of the measurements of grader 2 for FAF-BPRF when calculating intergrader ICC for FAF-BPRF. For intermachine ICC calculations, we also used the average of the each grader’s measurements. As another example, we considered the average of the measurements of grader 1 for FAF-BPRF versus the average of the measurements of grader 1 for CSLO when calculating intermachine ICC for grader 1. For intergrader ICC and intermachine ICC, we used two-way random effects models for taking both eye and grader random effects into consideration. For intragrader ICC, we used a one-way random effects model. ICC Scores ≥0.75, between 0.40 and 0.75 and ≤0.40 are considered excellent, fair to good and poor, respectively (Landis & Koch 1977). Fisher’s r-to-z transform was used to compare the ICCs from different models. To compare mean differences in graders within each device, mixed effects models were used with eyes nested in subject. Bland–Altman plots were used to visualize the agreement between area of hypofluorescence using FAF-BPRF representing β-PPA and the area of β-PPA in CSLO for graders 1 and 2. A p value < 0.05 was considered statistically significant. All statistical analyses were conducted in R 2.14.0 (http://www.r-project.org).
Results
Sixty-five eyes of 45 patients (17 men and 28 women) with a mean age of 68.2 ± 11.3 years (range, 46–89 years) were enrolled. There were 34 (76%) Caucasians, 9 (20%) African Americans and 2 (4%) Asians. Table 1 shows baseline demographic and clinical characteristics. Of the potential total number of 90 study eyes, 14 were excluded because of poor image quality on FAF images due to advanced cataract, 7 because of lack of patient cooperation with image acquisition and four because of poor dilation.
| Variable | (subjects, n = 45) |
|---|---|
| Age (years) | 68.2 ± 11.3 |
| Gender (% female) | 28 (62%) |
| Ancestry (% European descent) | 34 (76%) |
| CCT (μm) | 557.6 ± 36.3 |
| Axial length (mm) | 24.2 ± 1.2 |
| Last IOP (mmHg) | 16.6 ± 4.7 |
| Last MD (dB) | −1.8 ± 3.7 |
| Last PSD (dB) | 3.0 ± 3.0 |
- CCT, central corneal thickness; dB, decibels; IOP, intraocular pressure; MD, mean deviation.
The mean total area of β-PPA by FAF-BPRF was 1.01 ± 0.80 mm2 (range, 0.11–4.10) (grader 1) and 1.06 ± 0.58 mm2 (range, 0.27–2.47) (grader 2) (p = 0.12). By comparison, the mean total area of β-PPA by CSLO was 0.74 ± 0.43 mm2 (range, 0.10–2.66) (grader 1) and 1.00 ± 0.54 mm2 (range, 0.24–2.96) (grader 2) (p < 0.001, determined from a nested mixed effects model). Measurements of the β-PPA area obtained with the two modalities had fair-to-good agreement (rho = 0.74, Spearman’s rank correlation). Intragrader reproducibility of β-PPA measurements with the same device was excellent. For FAF-BPRF, the intragrader ICCs were 0.997 (95% CI, 0.996–0.998) and 0.995 (95% CI, 0.992–0.996) for grader 1 and 2, respectively. For CSLO, intragrader ICCs were 0.991 (95% CI, 0.986–0.994) and 0.988 (95% CI, 0.982–0.992) for graders 1 and grade 2, respectively. Intergrader reproducibility (ICC) was fair: 0.53 (95% CI, 0.331–0.685) for FAF-BPRF and 0.404 (95% CI, 0.149–0.601) for CSLO (comparison between ICCs p = 0.368). The agreement (ICC) for β-PPA measurements between the two devices was worse for grader 1 (0.356 (95% CI, 0.129–0.549)) than for grader 2 (0.856 (95% CI, 0.774–0.910)) (comparison between ICCs p < 0.001). Results of statistical analysis for evaluation of agreements between instruments (Bland–Altman design) are depicted in Fig. 4.
Two eyes had β-PPAs that were qualified as particularly difficult to identify, and their measurements varied widely between graders and instruments (Fig. 3, highlighted). When the outlier measurements of these two eyes were excluded from the analysis, intergrader agreement (ICC) improved to 0.635 (95% CI, 0.454–0.765) for FAF-BPRF and 0.567 (95% CI, 0.314–0.731) for CSLO (p = 0.560). The agreement (ICC) for β-PPA measurements between the two devices also improved: ICC was 0.673 (95% CI, 0.498–0.793) for grader 1 and 0.842 (95% CI, 0.737–0.905) for grader 2 (p = 0.027).

Plots of measured β-PPA area with FAF-BPRF and CSLO for grader 1 (A) and grader 2 (B). The highlighted circles represent outlier measurements.
Discussion
The present study presents a novel method to measure in a clinical setting the area of β-PPA based on FAF images. Although measurements of β-PPA with the FAF-BPRF provided high intragrader reproducibility (ICCs > 0.99), there was only moderate agreement between graders (ICC = 0.64). These findings are similar to results obtained with the CSLO, an instrument used in several recent studies to measure β-PPA. Also, although highly correlated (rho = 0.74), comparisons of measurements of the β-PPA area obtained with the two instrument modalities only had fair-to-good agreement at best and, therefore, are not interchangeable. Possible explanations for this discrepancy are as follows: (i) measurements of the β-PPA area on CSLO reflectance images were guided by the visible aspect of the atrophy. FAF-BPRF, on the other hand, is based on automated detection of areas of reduced autofluorescence as a surrogate of β-PPA and (ii) FAF-BPRF and CSLO scans were not always taken on the same dates but within a period of up to 2 years of each other. It is possible that some eyes may have experienced progressive increase in β-PPA within this period, although these changes would not be expected to have a large impact on the overall agreement.
It has been well established that the presence(Teng et al. 2010) and size of β-PPA are associated with the diagnosis of glaucoma. (Araie et al. 1994; Tezel et al. 1997; Jonas et al. 2002, 2004) The average size of β-PPA in the present study (0.96 mm2; using CSLO) was similar to reported values ranging from 0.41 to 0.93 mm2 in patients with glaucoma (Jonas et al. 2002; Teng et al. 2010) and 0.07 mm2 in healthy volunteers measured using CSLO. (Laemmer et al. 2007) Changes in β-PPA have also been shown to be associated with glaucoma progression. Uchida et al. (1998) described that progression of parapapillary atrophy is associated with optic disc and visual field progression. Based on these findings, they suggested that changes in β-PPA, measured using computer-aided planimetry, may be used as a marker for glaucoma progression. Another study reported that 49% of eyes with ocular hypertension that converted to glaucoma showed enlargement of β-PPA before detection of optic disc or visual field changes, compared to less than 10% of non-convertors. (Tezel et al. 1997; Budde & Jonas 2004) found that enlargement of β-PPA occurred more often in eyes with progressive glaucoma than in eyes with stable glaucoma (6.2% versus 0.8%) during a mean follow-up of 4.5 years. Differences in the incidence of β-PPA progression and its relationship to glaucoma progression can be explained by a multitude of factors, including differences in study populations, glaucoma status, follow-up duration, definitions of disease progression and methods for detection of β-PPA changes.
More recently, Teng et al. (2010) studied the relationship between presence of β-PPA using stereophotograph-guided CSLO measurements and rates of visual field change in 245 patients with glaucoma (65%β-PPA) over an average of 4.9 years. β-PPA eyes had faster rates of change (−0.84 dB/year) than non-β-PPA eyes (−0.51 dB/year, p < 0.01). Kono et al. (1999) used CSLO and compared their findings with planimetric measurements of disc photographs in 36 patients with glaucoma and suspects. They found good intergrader and intragrader reliabilities (r = 0.882 and r = 0.948) between CSLO and planimetry when stereophotographs were viewed simultaneously to assist with detection of β-PPA. These findings were confirmed by Lee et al. (2011) who, in a retrospective study of 202 glaucomatous eyes followed for an average of 3 years, found that eyes with presence and enlargement of β-PPA had a faster rate of RNFL thinning. However, their study did not quantify the size of β-PPA.
It has been postulated that regions of decreased autofluorescence are secondary to excessive accumulation of lipofuscin, as a result of RPE stress and may predict the site of future β-PPA progression. (Laemmer et al. 2007) Using Indocyanine green angiography, O’Brart et al. (1997) have found areas of hypofluorescene in the peripapillary region in late-phase angiogram of a majority of patients with glaucoma and suggested that the area of β-PPA may also represent a zone of disruption of the retinal–blood barrier. This finding is of interest and may provide an explanation for the association between presence of β-PPA and glaucoma. Therefore, FAF images may represent a more physiological method of detecting the retinal damage that underlies atrophic areas compared to CSLO and fundus photography. In this study, the agreement of FAF-BPRF outcomes between the two graders was only moderate. A longitudinal study is necessary to investigate the ability of this technology to detect changes over time in patients with glaucoma and to correlate these with structural and functional rates of glaucoma progression.
There are limitations to this study. First, there were relatively only few subjects with large β-PPAs (>2 mm2). As the size of β-PPA increases, the probability of higher variations in measurements also increases (3, 4). Therefore, even lower reproducibility values may be expected when assessing eyes with large β-PPAs. Second, this study only included patients with suspected or established glaucoma, and results of β-PPA measurements may be different in eyes of healthy subjects. Third, all cited studies (including the present one) were performed in populations of predominantly Caucasian ethnicity. It is not known whether similar results would be observed in other populations. Fourth, no FAF images of sufficient quality could be obtained in 28 (31%) eyes either due to media opacity or lack of patient collaboration. This rate is higher than reported with the CSLO. Our experience with the FAF-BPRF suggests that an important source of variability in β-PPA measurements is the need for manual blocking of blood vessels. Automated blocking of these may provide improved reproducibility results. We did not measure the time for obtaining β-PPA measurements with the two instruments. However, the graders’ consensus was that less time was required to assess β-PPA with the FAF-BPRF. This could be a potential advantage for the FAF-BPRF over the CSLO, particularly if used in clinical practice.

Bland–Altman plots showing agreement between area of hypofluorescence using FAF-BPRF representing β-PPA and the area of β-PPA in CSLO for grader 1 (A) and grader 2 (B).
Considerable research is directed at identifying new biomarkers (including β-PPA) for glaucoma onset and progression. (Limb & Martin 2011) Before changes in β-PPA can be used as an additional marker for glaucoma progression, validation of reliable imaging technologies for its quantification in multiple different populations is needed. This study shows that semi-automated detection and quantification of β-PPA by Spectralis FAF-BPRF can be achieved. It has excellent intragrader and moderate intergrader reproducibility, similar to results obtained with CSLO. Improvements in the measurement technique are needed before FAF-BPRF should be used for assessing β-PPA.
Acknowledgements
Supported in part by NEI R01-EY08208 (FAM), NEI R01-11008, EY14267 (LMZ) and an unrestricted grant from Research to Prevent Blindness, New York, N.Y. (RNW), Velux Foundation, Zürich, Switzerland (KM). Participant retention incentive grants in the form of glaucoma medication at no cost (Alcon Laboratories Inc., Allergan, Pfizer Inc., SANTEN Inc.).
Financial Disclosure
K Mansouri, JD Tung, A Tafreshi, S Dorairaj, S Jain, F He: none; FA Medeiros, Alcon Laboratories, Inc. (C, F, R), Allergan, Inc. (C, R), Carl Zeiss Meditec, Inc. (F, R), Pfizer, Inc. (C, F, R), Reichert, Inc.(R); LM Zangwill, Carl Zeiss Meditec, Inc. (F), Heidelberg Engineering, GmbH (F), Optovue, Inc. (F), Topcon Medical Systems, Inc. (F); RN Weinreb, Carl Zeiss Meditec, Inc., (C, F); Heidelberg Engineering, GmbH, (F); Optovue, Inc., (F); Topcon Medical Systems, Inc., (F, R); Nidek (F, R).