Using pulsatility responses to breath-hold maneuvers to predict readmission rates in continuous-flow left ventricular assist device patients
Abstract
Background
Dynamic respiratory maneuvers induce heterogenous changes to flow-pulsatility in continuous-flow left ventricular assist device patients. We evaluated the association of these pulsatility responses with patient hemodynamics and outcomes.
Methods
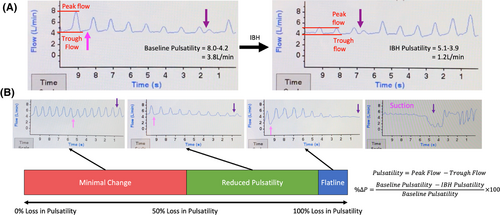
Responses obtained from HVAD (Medtronic) outpatients during successive weekly clinics were categorized into three ordinal groups according to the percentage reduction in flow-waveform pulsatility (peak-trough flow) upon inspiratory-breath-hold, (%∆P): (1) minimal change (%∆P ≤ 50), (2) reduced pulsatility (%∆P > 50 but <100), (3) flatline (%∆P = 100). Same-day echocardiography and right-heart-catheterization were performed. Readmissions were compared between patients with ≥1 flatline response (F-group) and those without (NF-group).
Results
Overall, 712 responses were obtained from 55 patients (82% male, age 56.4 ± 11.5). When compared to minimal change, reduced pulsatility and flatline responses were associated with lower central venous pressure (14.2 vs. 11.4 vs. 9.0 mm Hg, p = 0.08) and pulmonary capillary wedge pressure (19.8 vs. 14.3 vs. 13.0 mm Hg, p = 0.03), lower rates of ≥moderate mitral regurgitation (48% vs. 13% vs. 10%, p = 0.01), lower rates of ≥moderate right ventricular impairment (62% vs. 25% vs. 27%, p = 0.03), and increased rates of aortic valve opening (32% vs. 50% vs. 75%, p = 0.03). The F-group (n = 28) experienced numerically lower all-cause readmissions (1.51 vs. 2.79 events-per-patient-year [EPPY], hazard-ratio [HR] = 0.67, p = 0.12), reduced heart failure readmissions (0.07 vs. 0.57 EPPY, HR = 0.15, p = 0.008), and superior readmission-free survival (HR = 0.47, log-rank p = 0.04). Syncopal readmissions occurred exclusively in the F-group (0.20 vs. 0 EPPY, p = 0.01).
Conclusion
Responses to inspiratory-breath-hold predicted hemodynamics and readmission risk. The impact of inspiratory-breath-hold on pulsatility can non-invasively guide hemodynamic management decisions, patient optimization, and readmission risk stratification.
1 BACKGROUND
Despite augmenting native physiology, continuous-flow left ventricular assist devices (cfLVAD) remain sensitive to changes in preload and afterload. Diminished preload induced by head-up tilt results in a decrease in mean flow, while increased afterload induced via sustained handgrip reduces mean and trough flows.1, 2 Furthermore, at fixed pump speed, increased cfLVAD flows during exercise occur concomitantly to elevations in right- and left-heart filling pressures, cementing this preload sensitivity.3
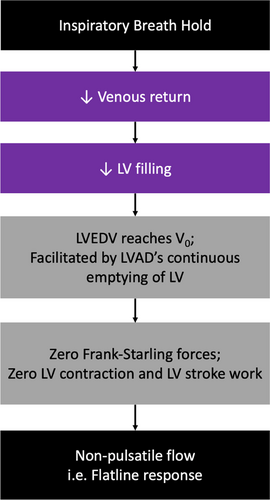
Consequently, studies have begun to explore the in vivo effects of acute alterations in loading conditions. Jain et al. demonstrated a highly variable effect upon forced expiration.4 While all cfLVAD patients experienced decreases in pump flow and flow-pulsatility during the maneuver, those with reduced baseline preload or afterload were at risk of complete pulsatility loss (“flatlining”) and subsequent suction events.4 This wide variability in pulsatility responses likely remains a consequence of the largely altered physiology conferred during cfLVAD support. Specifically, cfLVAD flow is proportional to head pressure (aortic–left ventricular [LV] pressure) and continually unloads the LV throughout the entire cardiac cycle.2, 4, 5 It was proposed that, in combination with the heightened ventricular emptying promoted in cfLVAD patients with reduced afterload, increased intrathoracic pressure decreases venous return and causes a decline in ventricular filling.4 Eventually, in patients with reduced baseline LV preload, emptying continues until LV end-diastolic volume finally reaches V0 (the x-intercept of the end-systolic pressure volume relationship). This is the volume whereby there is zero generated Frank-Starling forces and zero generated LV systolic pressure, resulting in the complete loss of LV stroke work and consequent flatlining.4 However, despite this, the relationship between flatlining and other cardiac parameters such as right ventricular (RV) function, valvular function, and volume status, as well as long-term clinical outcomes largely remains unknown and unexplored.
The HVAD system (Medtronic, Minneapolis MN) provides a display of instantaneous flow and power waveforms, which permits the real-time characterization of these dynamic flow responses within the clinic setting.6 While withdrawn from distribution, a significant proportion of patients worldwide remain supported on the HVAD device. Despite significant interest regarding how pump waveforms may correspond with clinically relevant physiological states and long-term patient outcomes,7 there remains a paucity of literature examining the clinical utility of these pulsatility responses. Exploring this avenue may allow the development of a non-invasive method for monitoring hemodynamics and identifying those at increased risk for adverse events, which can influence patient management in the HVAD and future devices. We therefore sought to evaluate the association of these pulsatility responses with patient hemodynamics and clinical outcomes.
2 METHODS
All patients at our institution with a HVAD implanted as of, or after, June 2018 were followed until heart transplantation, death, or the study end (August 2021). Biventricular support was the sole exclusion criteria. Lavare-cycle remained off for all patients for the duration of the study. Approval was granted by the hospital's research ethics committee (Reference Number 2020/ETH02744).
2.1 Waveform assessment
2.2 Hemodynamic assessment
A subset of patients underwent routine supine transthoracic echocardiography and/or right-heart-catheterization (RHC) using a Swan-Ganz catheter when indicated per institutional guidelines. For RHC, this was 3–6 months post-LVAD implantation and/or if indicated to guide management. For echocardiography, this was performed per routine clinical indications and for valvular regurgitation screening. Same-day inspiratory-breath-hold responses were obtained prior to assessment to evaluate the association of hemodynamics with responses. Central venous pressure (CVP), pulmonary artery pressure (systolic [sPAP], diastolic [dPAP], mean [mPAP]), and pulmonary capillary wedge pressure (PCWP) in addition to derived measurements of transpulmonary gradient, diastolic pulmonary gradient, pulmonary artery pulsatility index (PAPi), pulmonary artery proportional pulse pressure (PAPP = [sPAP-dPAP]/sPAP), thermodilution-derived cardiac output, cardiac index (CI), pulmonary vascular resistance, systemic vascular resistance, and right ventricular stroke work index (RVSWI) were recorded during RHC. Mean arterial pressure (MAP) was obtained via Doppler sphygmomanometry. During echocardiography, ventricular dimensions and function, and valvular function were recorded. If patients had >1 echocardiogram or RHC, only their most recent of each type was included in analysis to prevent unequal patient weighting.
2.3 Outcomes
Adverse events (gastrointestinal bleeding, neurological dysfunction, pump thrombosis, and arrythmia) were defined as per the Mechanical Circulatory Support Academic Research Consortium.8 When assessing rehospitalizations, planned readmissions for elective procedures or heart transplantation were excluded. Heart failure (HF) readmissions were defined as readmissions for fluid overload or pulmonary congestion requiring intravenous diuretics. Syncopal readmissions were defined as readmissions for presyncope/syncope that were not instigated by another adverse event. Inpatient duration was excluded when calculating readmission rates in events-per-person-year (EPPY).
2.4 Statistical analysis
Data was analyzed using SPSS Statistics 26.0 (IBM Corporation, Armonk, NY) and RStudio 1.4.1717 (RStudio PBC, Boston, MA). Two-sided p-values <0.05 were considered significant. Continuous variables were displayed as mean ± SD or median [25%–75% quartile] and categorical variables as frequency (%). The association between flatlining and suction was analyzed using Fisher's exact test. Continuous variables were compared between groups using Welch's t-tests or Mann–Whitney U-tests following a Shapiro–Wilk test of normality, while categorical variables were compared using Fisher's exact test. For each patient within the F-group, their average baseline pump parameters preceding flatline responses and non-flatline responses were calculated, and these were compared using the paired Wilcoxon signed-rank test. Hemodynamic parameters were compared between responses using Kruskall–Wallis tests for continuous variables or Kendall's Tau for ordinal variables. Adverse events were assessed using Fisher's exact test. Rehospitalization rates were compared using an Andersen-Gill model on RStudio. Readmission-free survival utilized a Cox proportional hazards model and Kaplan–Meier analysis with log-rank test. The SPSS Exact Tests package was used for rank tests in the presence of ties, or when expected contingency table cell counts were <5.
3 RESULTS
3.1 Patient demographics
Our study cohort comprised 55 patients with mean age of 56.4 ± 11.5 years at implant, was predominantly male (82%), and had dilated cardiomyopathy as the prevailing HF etiology (60%). Only one patient was implanted as destination therapy. At study completion, median support duration was 308 [205–449] days. Patient demographics were comparable between the F-group and NF-group (Table 1). The only significant laboratory differences between groups were lower gamma-glutamyl transferase (GGT) and higher hemoglobin levels in the F-group (Table 1). Renal function was similar between groups.
| Characteristic | Total (n = 55) | NF group (n = 27) | F group (n = 28) | p-value |
|---|---|---|---|---|
| Age at implant (years) | 56.4 ± 11.5 | 54.8 ± 13.0 | 58.0 ± 10.0 | 0.51 |
| Male, n (%) | 45 (82) | 21 (78) | 24 (86) | 0.50 |
| BMI (kg/m2) | 26.0 ± 3.9 | 25.2 ± 3.8 | 26.6 ± 3.9 | 0.11 |
| HF etiology, n (%) | 0.78 | |||
| Ischemic | 20 (36) | 9 (33) | 11 (39) | |
| Other dilated cardiomyopathy | 33 (60) | 17 (63) | 16 (57) | |
| Other | 2 (4) | 1 (4) | 1 (4) | |
| INTERMACS class, n (%) | 0.84 | |||
| 1 | 14 (25) | 8 (30) | 6 (21) | |
| 2 | 15 (27) | 7 (26) | 8 (29) | |
| 3 | 21 (38) | 9 (33) | 12 (43) | |
| 4 | 5 (9) | 3 (11) | 2 (7) | |
| BTT indication, n (%) | 54 (98) | 27 (100) | 27 (96) | 1.00 |
| Duration from LVAD implantation to first recorded pulsatility response (days) | 37 [28–135] | 51 [30–135] | 35 [27–109] | 0.40 |
| Duration of LVAD support at study end (days) | 308 [205–449] | 281 [205–402] | 353 [205–562] | 0.14 |
| Creatinine (μmol/L) | 108.5 ± 37.4 | 111.0 ± 49.3 | 106.0 ± 21.1 | 0.82 |
| Albumin (g/L) | 37.9 ± 3.1 | 37.6 ± 3.3 | 38.2 ± 2.8 | 0.52 |
| Serum bilirubin (μmol/L) | 13.5 ± 4.7 | 14.6 ± 5.2 | 12.4 ± 4.0 | 0.11 |
| GGT (U/L) | 96.5 ± 76.6 | 123.9 ± 84.8 | 70.1 ± 57.9 | 0.005 |
| Hemoglobin (g/L) | 124.8 ± 12.6 | 118.5 ± 11.5 | 130.8 ± 10.7 | <0.001 |
| Mean flow (L/min) | 4.5 ± 0.7 | 4.4 ± 0.7 | 4.7 ± 0.6 | 0.08 |
| Peak flow (L/min) | 7.0 ± 0.8 | 6.8 ± 0.8 | 7.2 ± 0.8 | 0.07 |
| Trough flow (L/min) | 2.6 ± 0.9 | 2.5 ± 1.0 | 2.6 ± 0.8 | 0.94 |
| Pulsatility (L/min) | 4.4 ± 1.2 | 4.3 ± 1.3 | 4.6 ± 1.1 | 0.18 |
| Pump speed (rpm) | 2524 ± 81 | 2521 ± 96 | 2526 ± 64 | 0.65 |
| Mean power (W) | 3.7 ± 0.5 | 3.6 ± 0.5 | 3.7 ± 0.3 | 0.23 |
- Note: Data presented as mean ± standard deviation or frequency (%).
- Abbreviations: BMI, body mass index; BTT, bridge to transplant; GGT, gamma-glutamyl transferase; HF, heart failure; INTERMACS, Interagency Registry for Mechanically Assisted Circulatory Support; LVAD, left ventricular assist device.
3.2 Responses
Overall, 712 responses were obtained from the 55 patients, consisting of 334 minimal change, 242 reduced pulsatility, and 136 flatline responses. Median number of responses obtained per patient was 11 [7–18]. The median number of days elapsed between successive responses per patient was 14.0 [14.0–27.5]. Average inspiratory-breath-hold duration per response was 13.3 ± 2.8 seconds. The F-group comprised 28 patients who exhibited ≥1 flatline response while the remaining 27 patients comprised the NF-group. Suction demonstrated significant association with flatlining as 32 of 42 inspiratory-breath-hold-induced suction events were preceded by flatline responses (p < 0.001) and all 18 patients who exhibited ≥1 inspiratory-breath-hold-induced suction event were members of the F-group (p < 0.001).
3.3 Pump parameters
Paired analysis conducted within the F-group comparing the average baseline pump parameters of patients preceding flatline versus non-flatline responses is displayed in Table 2. When compared to non-flatline, flatline responses were preceded by higher trough flow (2.8 ± 0.8 vs. 2.5 ± 0.8 L/min, p = 0.002), pump speed (2535 ± 60 vs. 2518 ± 63 rpm, p = 0.002), and mean power (3.8 ± 0.3 vs. 3.7 ± 0.4 W, p = 0.02).
| Parameter | Non-flatline response | Flatline response | p-value |
|---|---|---|---|
| Mean flow (L/min) | 4.6 ± 0.6 | 4.7 ± 0.7 | 0.14 |
| Peak flow (L/min) | 7.2 ± 0.8 | 7.3 ± 0.9 | 0.65 |
| Trough flow (L/min) | 2.5 ± 0.8 | 2.8 ± 0.8 | 0.002 |
| Pulsatility (L/min) | 4.8 ± 0.9 | 4.6 ± 1.0 | 0.07 |
| Pump speed (rpm) | 2518 ± 60 | 2535 ± 63 | 0.002 |
| Mean power (W) | 3.7 ± 0.3 | 3.8 ± 0.4 | 0.02 |
- Note: Data presented as mean ± standard deviation. Analysis was performed on the 28 patients in the F group only.
3.4 Invasive hemodynamic correlates
Baseline characteristics of patients undergoing RHC and echocardiography were similar (Table S1). When compared to minimal change, reduced pulsatility and flatline responses were associated with lower MAP (89.1 vs. 80.6 vs. 77.2 mm Hg, p = 0.002), lower mPAP (30.8 vs. 23.0 vs. 22.0 mm Hg, p = 0.005), and lower PCWP (19.8 vs. 14.3 vs. 13.0 mm Hg, p = 0.03), but higher PAPP (0.49 vs. 0.55 vs. 0.57, p = 0.01) (Table 3). A similar decreasing trend for CVP did not reach significance. However, when compared to minimal change and reduced pulsatility combined, flatline responses were associated with significantly lower CVP (9.0 vs. 13.4 mm Hg, p = 0.02). There were no significant differences in CI or RVSWI between responses.
| Parameter | Total n = 31a, 22b | Minimal change n = 18a, 10b | Reduced pulsatility n = 7a, 6b | Flatline n = 6a, 6b | p-value |
|---|---|---|---|---|---|
| MAP (mm Hg)a | 84.9 ± 8.5 | 89.1 ± 7.9 | 80.6 ± 3.4 | 77.2 ± 7.0 | 0.002 |
| CVP (mm Hg)a | 12.6 ± 5.5 | 14.2 ± 6.3 | 11.4 ± 3.6 | 9.0 ± 2.8 | 0.08 |
| mPAP (mm Hg)a | 27.3 ± 7.2 | 30.8 ± 7.2 | 23.0 ± 3.7 | 22.0 ± 3.2 | 0.005 |
| PCWP (mm Hg)a | 17.3 ± 6.5 | 19.8 ± 7.2 | 14.3 ± 3.0 | 13.0 ± 2.4 | 0.03 |
| TPG (mm Hg)a | 10.1 ± 3.6 | 10.9 ± 3.7 | 8.7 ± 3.7 | 9.0 ± 2.5 | 0.30 |
| DPG (mm Hg)a | 1.6 ± 3.5 | 2.1 ± 3.9 | 0.9 ± 3.0 | 1.2 ± 2.6 | 0.53 |
| PAPPa | 0.52 ± 0.08 | 0.49 ± 0.08 | 0.55 ± 0.08 | 0.57 ± 0.04 | 0.01 |
| PAPia | 1.8 ± 0.7 | 1.7 ± 0.6 | 1.9 ± 0.8 | 2.3 ± 0.8 | 0.24 |
| CO (L/min)b | 4.3 ± 1.2 | 3.9 ± 1.1 | 4.4 ± 1.3 | 5.1 ± 1.2 | 0.14 |
| CI (L/min/m2)b | 2.2 ± 0.6 | 2.0 ± 0.6 | 2.2 ± 0.7 | 2.5 ± 0.7 | 0.38 |
| PVR (WU)b | 2.5 ± 1.3 | 3.1 ± 1.4 | 1.8 ± 0.6 | 1.9 ± 0.9 | 0.10 |
| SVR (WU)b | 18.1 ± 5.8 | 21.3 ± 5.8 | 16.7 ± 4.2 | 14.1 ± 4.0 | 0.03 |
| RVSWI (L.mm Hg/m2)b | 0.46 ± 0.18 | 0.49 ± 0.18 | 0.40 ± 0.28 | 0.46 ± 0.10 | 0.78 |
- Note: Data presented as mean ± standard deviation.
- Abbreviations: CI, cardiac index; CO, cardiac output; CVP, central venous pressure; DPG, diastolic pulmonary gradient; mPAP, mean pulmonary artery pressure; PAPi, pulmonary artery pulsatility index; PAPP, pulmonary artery proportional pulse pressure; PCWP, pulmonary capillary wedge pressure; PVR, pulmonary vascular resistance; RVSWI, right ventricular stroke work index; SVR, systemic vascular resistance; TPG, transpulmonary gradient; WU, Wood units.
- a n = 31 for assessment of MAP, CVP, and pulmonary pressures during right-heart-catheterization.
- b n = 22 for assessment of CO, PVR, SVR, and RVSWI during right-heart-catheterization. Out of 31 right-heart-catheterization performed, only 22 included assessment of these parameters.
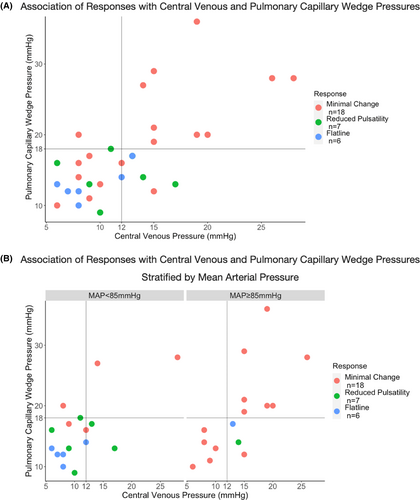
Minimal Change responses selected mPAP >25 mm Hg with sensitivity, specificity, positive predictive value (PPV), and negative predictive value (NPV) of 88%, 73%, 78%, and 85%, respectively. Further, minimal change responses selected PCWP≥18 mm Hg with sensitivity of 91% and NPV of 92%. Responses had limited diagnostic value when selecting for PCWP <18 mm Hg and CVP <12 mm Hg within the entire cohort (Figure 2A). However, in the subset of patients with MAP <85 mm Hg, reduced pulsatility and flatline responses selected for PCWP <18 mm Hg and CVP <12 mm Hg with sensitivity of 88% and NPV of 80%, while flatline responses selected with specificity of 88% and PPV of 80% (Figure 2B).
3.5 Echocardiographic parameters
Fifty patients underwent echocardiography (Table 4). In some patients, poor acoustic windows prevented reporting of certain parameters. There were no significant differences in LV end-diastolic diameter and LV ejection fraction between responses. When compared to minimal change, reduced pulsatility and flatline responses were associated with higher rates of ≥intermittent aortic valve opening and inferior vena cava respiratory variation, but lower rates of ≥moderate mitral regurgitation (MR), ≥moderate RV impairment, and ≥ moderate tricuspid regurgitation (TR). When compared to minimal change, reduced pulsatility and flatline responses were also accompanied by non-significant trends toward higher rates of leftward interventricular septum deviation and lower rates of inferior vena cava dilation.
| Parameter | Total n = 50a | Minimal change n = 23a | Reduced Pulsatility n = 16a | Flatline n = 11a | p-value |
|---|---|---|---|---|---|
| LVEF (%) | 19.7 ± 7.0, n = 45 | 17.5 ± 4.3, n = 20 | 22.0 ± 9.9, n = 14 | 20.9 ± 5.9, n = 11 | 0.23 |
| LVEDD (mm) | 65.9 ± 10.6, n = 46 | 68.1 ± 11.0, n = 23 | 65.6 ± 9.4, n = 14 | 60.8 ± 10.7, n = 9 | 0.21 |
| ≥Intermittent aortic valve opening | 21/46 (46) | 7/22 (32) | 8/16 (50) | 6/8 (75) | 0.03 |
| ≥Moderate mitral regurgitation | 14/49 (29) | 11/23 (48) | 2/16 (13) | 1/10 (10) | 0.01 |
| Leftward IVS deviation | 4/50 (8) | 0/23 (0) | 2/16 (13) | 2/11 (18) | 0.08 |
| ≥Moderate RV dilation | 8/46 (17) | 5/20 (25) | 3/16 (19) | 0/10 (0) | 0.15 |
| ≥Moderate RV impairment | 20/48 (42) | 13/21 (62) | 4/16 (25) | 3/11 (27) | 0.03 |
| ≥Moderate tricuspid regurgitation | 10/47 (21) | 8/22 (36) | 2/14 (14) | 0/11 (0) | 0.01 |
| IVC dilation | 16/39 (41) | 10/18 (56) | 4/11 (36) | 2/10 (20) | 0.07 |
| IVC respiratory collapse | 19/34 (56) | 5/15 (33) | 7/11 (64) | 7/8 (88) | 0.01 |
- Note: Data presented as mean ± standard deviation or frequency/total (%).
- Abbreviations: IVC, inferior vena cava; IVS, interventricular septum; LVEDD, left ventricular end-diastolic diameter; LVEF, left ventricular ejection fraction; RV, right ventricle.
- a In some patients, poor acoustic windows prevented procurement of certain parameters. Totals are provided in each cell to denote the number of echocardiograms that were able to assess each specific parameter.
3.6 Adverse events
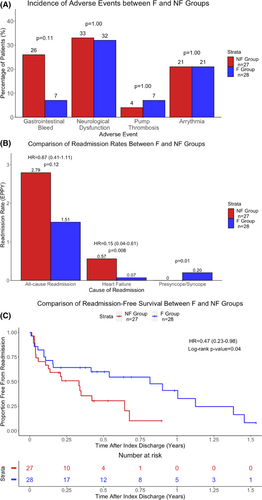
Overall, 16%, 33%, 5%, and 11% of patients experienced gastrointestinal bleeding, neurological dysfunction, pump thrombosis, and arrhythmia, respectively. The F-group experienced numerically lower rates of gastrointestinal bleeding than the NF-group (7% vs. 26%, p = 0.08). Other adverse events were similar between groups (p = 1.00) (Figure 3A).
3.7 Readmissions
In the entire cohort, 105 readmissions were recorded over 56.02 patient-years (1.87 EPPY). There was a non-significant trend toward reduced all-cause readmissions in the F-group compared to the NF-group (1.51 vs. 2.79 EPPY; hazard-ratio [HR] = 0.67, 95% CI: 0.41–1.11, p = 0.12) (Figure 3B). However, the F-group experienced significantly lower HF readmissions than the NF-group (0.07 vs. 0.57 EPPY; HR = 0.15, 95% CI: 0.04–0.61, p = 0.008). Conversely, syncopal readmissions occurred exclusively within the F-group (0.20 vs. 0 EPPY, p = 0.01 vs. NF-group). Lastly, subgroup analysis conducted within the F-group comparing syncopal readmissions between patients who demonstrated ≥1 suction event (S-group, n = 18) and those who did not (NS-group, n = 10) demonstrated that syncopal readmissions occurred exclusively in the S-group (0.25 vs 0 EPPY, p = 0.009 vs. NS-group).
3.8 Readmission-free survival
The F-group experienced superior readmission-free survival compared to the NF-group (log-rank p = 0.04; Cox HR = 0.47, 95% CI: 0.23–0.98, p = 0.04) (Figure 3C). At 9-months post-index discharge, the readmission-free rate was 55% in the F-group versus 10% in the NF-group.
4 DISCUSSION
This study is the first to assess the association of clinical outcomes with pulsatility responses to dynamic respiratory maneuvers during cfLVAD support. There are four main findings: (1) Flatline responses occurred at higher pump speeds; (2) Flatline responses were associated with optimized hemodynamics, manifested as lower CVP and PCWP, reduced MR and TR, improved RV function, and increased aortic valve opening; (3) Patients with ≥1 flatline response experienced decreased HF readmissions and improved readmission-free survival; and (4) Syncopal readmissions occurred exclusively within patients who exhibited inspiratory-breath-hold-induced suction. While the HVAD has been withdrawn from market, understanding these findings has significance in the development of future cfLVADs with waveform display capacity.
4.1 Flatline associated with improved RV function
Lower pulmonary pressure and preload predisposes to flatline responses as, in combination with the diminished venous return upon inspiratory-breath-hold and ongoing diastolic LV emptying due to continuous-flow, LV underfilling reduces Frank-Starling forces to the point of zero stroke work and ventricular contraction (when LV end-diastolic volume reaches V0) – resulting in flow-flatlining (Figure 4).4 The association of minimal change responses with higher rates of ≥moderate RV impairment refutes previous hypotheses that the reduced pulmonary pressure accompanying flatline responses was a consequence of impaired RV ejection.4 Instead, the association of flatline responses with improved RV function is demonstrated by increased PAPP, a novel proxy of enhanced RV-pulmonary arterial coupling.9, 10 This may explain why GGT, which correlates with signs of RV failure, was lower in the F-group.11 While higher PAPP is predictive of improved survival and reduced readmissions in advanced HF patients, its prognostic utility in cfLVAD patients remains unexplored.9, 10 However, the improved readmission outcomes in the F-group provides impetus for future studies to elucidate its potential. In contrast, RVSWI is afterload-dependent.12 Hence, the comparable RVSWI accompanying minimal change responses may reflect higher pulmonary pressures and thus not indicate true RV function.
Instead, the elevated pulmonary pressure associated with minimal change responses, when considered concomitant with increased venous pressure, suggests a hypervolemic etiology.13, 14 This can aggravate RV dysfunction through: (1) increased RV afterload, and (2) venous congestion causing RV overloading and conformational changes in patients with pre-existing RV impairment.12, 15-20 This underscores the importance of managing pulmonary and venous congestion in cfLVAD patients. As minimal change responses had high sensitivity and NPV for selecting mPAP >25 mm Hg and PCWP ≥18 mm Hg, in patients with residual HF symptoms, the inspiratory-breath-hold response could provide a real-time, non-invasive test within the clinic setting to estimate pulmonary pressure and rule-out pulmonary aetiologies.4 Further, a dilutive effect of volume overload could contribute to reduced hemoglobin seen in the NF-group.
4.2 Flatline associated with higher pump speeds
Increased ventricular emptying also reduces Frank-Starling forces through minimizing LV end-diastolic volume. We demonstrated that lower MAP and increased aortic valve opening (indicative of improved ventricular-arterial coupling) facilitate flatline responses through augmenting LV unloading in diastole and systole, respectively.4 Additionally, flatline responses occurred at higher pump speeds than non-flatline responses. This is expected as higher pump speeds, through augmenting LV outflow, lower pulmonary pressures.3, 14 Higher pump speeds could also contribute to the reduced MR and increased leftward interventricular septum deviation accompanying flatline responses.21-24
4.3 Responses predict hemodynamic optimization and readmission rates
Our recorded readmission rate (1.87 EPPY) is comparable to other single- and multicenter studies (~2.0 EPPY).25-28 We demonstrated that the parameters associated with flatline responses parallel optimized hemodynamics. Specifically, during invasive hemodynamic ramp studies, patients are deemed optimized if they achieve PCWP <18 mm Hg, CVP <12 mm Hg, and CI >2.2 L/min/m2, with secondary goals of minimal MR and ≥ intermittent aortic valve opening.13, 14, 28-30 Indeed, flatline responses were concomitant with lower CVP and PCWP, lower rates of ≥moderate MR, and increased rates of ≥ intermittent aortic valve opening. Further, in non-hypertensive patients (MAP <85 mm Hg), reduced pulsatility and flatline responses selected PCWP <18 mm Hg and CVP <12 mm Hg with sensitivity of 88% and NPV of 80%, while flatline responses selected with specificity of 88% and PPV of 80%. As Imamura et al. demonstrated that optimized patients experience reduced all-cause readmissions, reduced HF readmissions, and improved readmission-free survival, this validates the analogous reduction in HF readmissions and improved readmission-free survival experienced by the F-group.28
4.4 Flatline and suction
As patients whose hemodynamics predispose to inspiratory-breath-hold-induced suction retain an increased suction risk while executing other dynamic maneuvers (e.g. coughing, straining), numerous mechanisms could explain the association with syncopal readmissions: (1) hypovolemia, a contributor to suction, may cause hypotension and presyncope/syncope; (2) obstruction of the inflow cannula by the ventricular wall during suction may impede flow and result in cerebral hypoperfusion; (3) suction may induce ventricular arrythmias which could cause hemodynamic compromise.31-34 Thus, inspiratory-breath-hold-induced suction may predict syncopal readmissions due to hemodynamic derangements, prompting management changes. Furthermore, it is known that suction still occurs at high rates in some clinically stable outpatients thought to be optimally adjusted.31 Assessing for suction upon inspiratory-breath-hold may aid to identify these high-risk patients predisposed to recurrent suction, allowing for management changes to be instituted.
4.5 Implications for patient management
As pulsatility responses predicted patient hemodynamics, inspiratory-breath-hold can address the lack of accurate, yet non-invasive, hemodynamic assessment methods by providing an indication of current loading conditions. Insights provided by responses can guide management decisions and patient optimization, facilitating patient-centered evaluation and management algorithms (Figure 5). A minimal change response should prompt the clinician to consider increasing diuretics or pump speed to combat pulmonary and venous congestion or suboptimal LV unloading, respectively.3, 14, 18, 35 Converse changes should be considered if suction occurs.31, 32, 34 Repeated longitudinal assessments can be used to determine the patient response to alterations in management. Conversely, our study suggests a flatline or reduced pulsatility response represents a favorable phenotype of hemodynamic optimization.13, 14, 28-30 Routine re-evaluation of outpatients using this algorithm may improve clinical outcomes through reducing rehospitalizations.28-30 Indeed, future studies should assess the efficacy of minimal change-induced and suction-induced management changes in improving RV function and preventing syncopal readmissions, respectively.
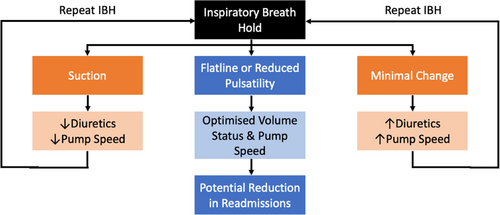
Furthermore, inspiratory-breath-hold may ameliorate limitations associated with invasive ramp studies. While optimization is a function of pump speed, fluid status, and antihypertensive management, only speed alterations are assessed during ramp studies, contributing to the inability to optimize some patients.13, 14, 28-30 Specifically, CVP cannot be reduced through pump speed augmentation alone, instead requiring diuretic uptitration, while, in other patients, PCWP may remain elevated despite maximal pump speeds.3, 14, 28, 35 In this subgroup of volume-loaded patients, diuretic dosing and longitudinal assessment using the provided inspiratory-breath-hold-guided algorithm may aid in normalization of hemodynamics, avoiding repetitive invasive assessments.
However, there may be limitations to inspiratory-breath-hold-guided management. Due to confounding effects of afterload, the accuracy of waveform responses in predicting PCWP and CVP deteriorates in patients with MAP ≥85 mm Hg, reflecting the importance of blood pressure control in optimizing pump function. Indeed, patient management should always include active blood pressure control to achieve MAP <85 mm Hg. Nonetheless, in patients with an otherwise optimized volume status and pump speed, continual minimal change responses may itself indicate hypertension, prompting antihypertensive uptitration. Lastly, despite management changes, inducing flatline responses, and hence, optimized hemodynamics in all patients may be unachievable.3, 14, 28 This is especially pertinent for patients with underlying RV impairment, which is often concomitant with intractable venous congestion, and in whom pump speed uptitration may be limited by suction events, RV dilatation, and ensuing RV failure.18, 34, 36-38 In this subgroup, a lack of flatline responses may represent a high-risk patient phenotype of refractory and persistently non-optimized hemodynamics associated with increased HF readmissions. This can indicate the need for more intensive monitoring, aggressive management and, in the bridge-to-transplant cohort, higher priority listing for transplantation.
Lastly, while the HVAD has been discontinued, the underlying physiological concept of pulsatility responses remains applicable to other cfLVADs even in the absence of displayed flow-waveforms. For example, in the HeartMate three (Abbott Laboratories, Abbot Park, IL), we postulate that dynamic losses in pulsatility upon inspiratory-breath-hold may be accompanied by reductions in pulse index, permitting analogous characterization of the pulsatility response. This could facilitate similar use of inspiratory-breath-hold in management algorithms and risk stratification. Hence, the logical next step would include performing a similar study in HeartMate three patients to confirm that these principles are applicable to other cfLVADs to aid in analogous non-invasive assessment and management. Furthermore, this study reinforces the unique clinical insights provided by flow-waveforms, providing support for their incorporation in future pump designs.
4.6 Limitations
As a single-center study, findings may be limited as management guidelines and thresholds for readmission differs between institutions. Our primarily bridge-to-transplant cohort is not representative of international, predominantly destination therapy, populations. While breath-hold efforts were unquantified as intrathoracic pressure was not measured, criteria were used to standardize maneuver duration. Responses were obtained from stable outpatients and hence proposed physiological mechanisms are less applicable during decompensations. While all flow-waveform analyses were performed by the same investigator to reduce inter-operator subjectivity, visual extrapolation of values from the HVAD flow-waveform may have nonetheless introduced human error. Future studies should assess the feasibility and accuracy of data acquisition sensors or available smartphone waveform-digitizing applications in performing analogous inspiratory-breath-hold flow-waveform analyses. Lastly, causative relationships were not demonstrated. A randomized controlled trial assessing the benefits of the provided inspiratory-breath-hold-guided management algorithm over conventional management in reducing rehospitalizations is recommended.
4.7 Conclusion
In cfLVAD patients, pulsatility responses to inspiratory-breath-hold provide a non-invasive indication of current patient hemodynamics and risk for readmission. Incorporating these relationships renders inspiratory-breath-hold invaluable, not only in guiding management decisions regarding pump speed, fluid status, and antihypertensive management, but also in identifying high-risk patients for whom more intensive monitoring and aggressive therapy may be warranted.
AUTHOR CONTRIBUTIONS
Study design: Rohan Joshua Krishnaswamy, Desiree Robson, Kavitha Muthiah. Data collection: Rohan Joshua Krishnaswamy aided by Desiree Robson, Aaron Gunawan, Anju Ramanayake, Sumita Barua. Pankaj Jain, Pankaj Jain aided Rohan Joshua Krishnaswamy's result interpretation. Peter Simon Macdonald, Christopher Simon Hayward, Kavitha Muthiah reviewed manuscript. Statistical analysis, manuscript writing, revisions: Rohan Joshua Krishnaswamy. Kavitha Muthiah supervision of the study.
CONFLICT OF INTEREST STATEMENT
The authors declare that they have no conflicts of interest with the contents of this article.


