The influence of left ventricular assist device inflow cannula position on thrombosis risk
Abstract
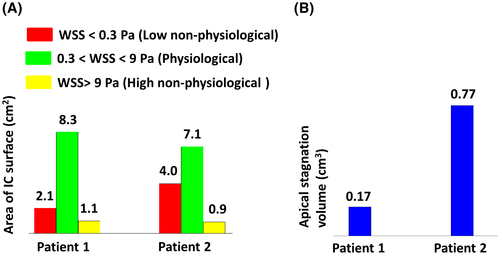
The use of left ventricular assist devices (LVADs) as a treatment method for heart failure patients has been steadily increasing; however, pathological studies showed presence of thrombi around the HeartWare ventricular assist device inflow cannula (IC) in more than 95% of patients after device explantation. Flow fields around the IC might trigger thrombus formation and require further investigation. In this study flow dynamics parameters were evaluated for different patient geometries using computational fluid dynamics (CFD) simulations. Left ventricular (LV) models of two LVAD patients were obtained from CT scans. The LV volumes of Patient 1 (P1) and Patient 2 (P2) were 264 and 114 cm3 with an IC angle of 20° and 9° from the mitral-IC tip axis at the coronal plane. The IC insertion site at the apex was central for P1, whereas it was lateral for P2. Transient CFD simulations were performed over 9 cardiac cycles. The wedge area was defined from the cannula tip to the wall of the LV apex. Mean velocity magnitude and blood stagnation region (volume with mean velocity <5 mm/s) as well as the wall shear stress (WSS) at the IC surface were calculated. Cardiac support resulted in a flow mainly crossing the ventricle from the mitral valve to the LVAD cannula for P2, while the main inflow jet deviated toward the septal wall in P1. Lower WSS at the IC surface and consequently larger stagnation volumes were observed for P2 (P1: 0.17, P2: 0.77 cm3). Flow fields around an LVAD cannula can be influenced by many parameters such as LV size, IC angle, and implantation site. Careful consideration of influencing parameters is essential to get reliable evaluations of the apical flow field and its connection to apical thrombus formation. Higher blood washout and lower stagnation were observed for a central implantation of the IC at the apex.
1 INTRODUCTION
Mechanical circulatory support (MCS) therapy has progressively improved over the last decades and survival rates of patients with left ventricular assist devices have continuously increased.1 Nevertheless, thrombogenicity of ventricular assist devices (VADs) remains a relevant problem and is closely linked to adverse events. Strokes, one of the most devastating complications,2, 3 are probably caused by thrombus depositions in the pump,4-6 the inflow cannula7 and outflow graft, and thrombi within the supported ventricle itself (Figure 1A).8-10 The development of thrombosis and those depositions might be explained by the Virchow's triad of stasis, endothelial injury, and hypercoagulability.11 Nonphysiological intraventricular flow patterns12, 13 in VAD patients create regions of stagnation at the site of the VAD.14, 15 Thrombus growth has been revealed on the outer surface of the HeartWare ventricular assist device (HVAD) (Medtronic-HeartWare, Minneapolis, MN) inflow cannula (IC) in 33%-100% of cases16-18 at the time of cardiac transplantation or autopsy. Multiple critical reasons for this are suspected, including patient factors (eg, intrinsic hypercoagulability, hypertension), management factors (eg, the anticoagulation regimen), the orientation of the IC to the mitral valve,19 the size of the ventricle,20, 21 the insertion depth of the IC due to the left ventricle (LV) wall thicknesses,22, 23 the structure of outer surface of the cannula,7, 24 and positioning of the cannula.16, 25-27
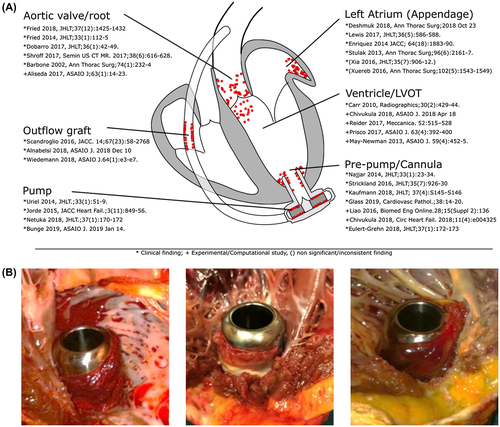
A potential additional cause for IC thrombus development might be a short distance between IC and ventricular septum. Based on photographs (Figure 1B) following cardiac transplantation or VAD explantation, a shorter distance to the septum showed a greater probability for an increase in thrombus formation or adhesion not only at this narrow distance, but also along the whole circumference.
Therefore, this study aimed to investigate the apical flow field and consequently the risk of thrombosis for patient-specific geometries with different cannula position. To this end, we performed computational fluid dynamics (CFD) simulations based on individual CT scans for cannula positions placed at a significant distance to the ventricular walls in the apex and compared them to implants with closer proximity to the ventricular walls.
2 PATIENTS AND METHODS
2.1 Patient clinical background
Computed tomography (CT) scans of two representative destination therapy patients suffering from dilated cardiomyopathy were included in this study (clinical background and patient data shown in Table 1). Although the ventricular volumes were different at 116 and 264 cm3, these values were within the clinically reported range.28 Both patients were treated according to current guidelines suggesting mean arterial pressures (<90 mm Hg), target INR values (2.0-2.5), and antiplatelet therapy (>81 mg aspirin).7
| Patient | Patient 1 | Patient 2 |
|---|---|---|
| Gender | Male | Male |
| Therapy type | Destination therapy | Destination therapy |
| Age (yrs) | 75 | 76 |
| Size (m) | 1.74 | 1.74 |
| Weight (kg) | 99 | 91 |
| BMI (kg/m2) | 32.7 | 30.1 |
| INTERMACS at implant | INTERMACS 4 | INTERMACS 3 |
| Ejection fraction before implant (%) | 32 | 17 |
| Concurrent procedures | No concurrent procedure, no prior cardiac surgery, minimal-invasive hemi-sternotomy, HLM | Tricuspid valve repair, no prior cardiac surgery, median sternotomy, HLM |
| POD of CT scan | 20 | 1844 |
| Referral for CT | Prospective before rehabilitation | Suction |
| Pump speed (rpm) | 2600 | 2800 |
| INR at CT scan | 2.4 | 2.3 |
| MAP (mm Hg) | 84 | 84 |
| Pump flow (L/min) | 4.2 | 5.1 |
| Pump power (W) | 4.3 | 4.8 |
| Pump flow amplitude (L/min) | 5.0 | 4.0 |
| Aspirin (mg) | 100 | 200 |
| LVV (end systolic, cm3) | 264 | 114 |
| LVESD (cm) | 6.2 | 4.6 |
| Hemocompatibility-related events during follow-up | None (up to POD 699) | Multiple gastrointestinal bleeding events (up to POD 2650) |
2.2 Patient models
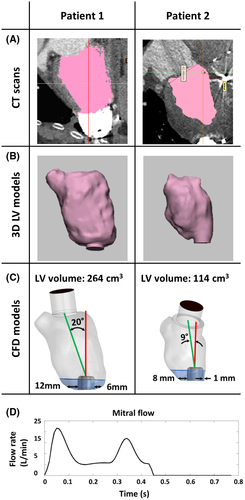
Three-dimensional LV models were reconstructed from CT data using Mimics inPrint 2.0, Mimics Research 20.0 (Materialise, Leuven, Belgium). As a first step, the region of interest inside the LV was selected (Figure 2A,B first column), resulting in a rough mask of the LV chamber. This mask was modified and corrected with a final confirmation of the validity of the segmented geometry by a radiologist. Then a 3-dimensional STL file was created (Figure 2A,B second column) and exported to 3-matics Research 13.0 (Materialise) where filtering processes such as smoothing and spike removal were applied. Then, the HVAD IC was positioned in the surgical configuration. Geometrical information such as the LV volume, distance of the IC surface to the lateral and septal wall, and the deviation of the IC with respect to MV–IC axis (axis connecting the center of the MV to the center of the IC) were calculated from the segmented LV (Figure 2C).
2.3 Meshing
An unstructured tetrahedral mesh with an element size of 0.6 mm at the LV surface and 1.2 mm in the LV volume was created (ANSYS Meshing 19.1, Ansys Inc., Canonsburg, PA, USA), close to the IC and at the transition zone between the sintered and polished parts of the cannula—a high-resolution mesh with an element size of 0.3 and 0.05 mm, respectively, in order to provide detailed insight into fluid behavior at these regions. A mesh independence study was performed and results can be found in theAppendix.
2.4 Solver setting
The blood was modeled as a non-Newtonian fluid with a density of 1060 kg/m3 and a dynamic viscosity of 0.0035 Pa·s. The simulations were performed with the pulsatile flow at the mitral inflow with a total duration of 9 cardiac cycles (7.02 seconds)29 (see Figure 2D). The simulations were initialized by 5 seconds of simulation to allow for adequate flow development29 and were computed with a temporal resolution of 0.001 seconds. The pump cannula outlet was set as an outflow boundary condition.
An unsteady incompressible finite-volume solver (Ansys Fluent 19.1, Ansys Inc.) was used to solve the mass and momentum conservation equations with the laminar method applying the no-slip boundary condition. A pressure-based solver with second-order upwind scheme spatial discretization was selected for the pressure, momentum, and continuity equations. Convergence was achieved in each time step when the residuals were below 10−3 for continuity, x, y, and z velocity.
2.5 Flow parameter evaluation
The intraventricular flow field was visualized using the scalar mean velocity magnitude. The wedge area was defined from the tip of the cannula to the apex (Figure 2A,B), due to the importance of the apical flow fields.
Wall shear stress (WSS) at the cannula surface was categorized at three levels: low nonphysiological range (WSS < 0.3 Pa) which is related to thrombus formation,30 physiological range (0.3 < WSS < 9 Pa), and high nonphysiological range (WSS > 9 Pa) which leads to von Willebrand factor (VWF) elongation.31
A stagnation region (SR) was defined to highlight any regions where low time-averaged shear rates are observed, based on the assumption that any particles traveling at less than 5 mm/s through the wedge area could possibly lead to thrombus formation due to clotting mechanisms which are activated at such low shear rates.32
3 RESULTS
The ventricular flow field at the coronal plane showed different behavior for the patients: Velocity fields in the large ventricle showed a counter clockwise rotation, where the inflow jet was directed toward the septal side (Figure 3A; Patient 1), while for Patient 2 the main mitral inflow jet traveled straight toward the apex where the IC was implanted (Figure 3A; Patient 2).
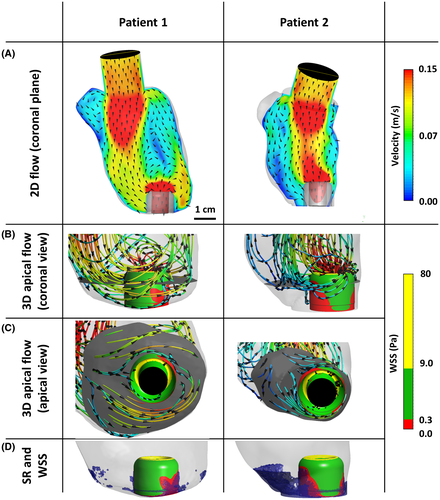
In the larger LV, the main flow jet reached the apex of the LV at the septal side, where it travels around the IC and is then redirected upward along the ventricular wall on the lateral side of the IC (Figure 3B,C; Patient 1). This flow redirection leads to low nonphysiological shear stress distribution at the backside of the IC surface (Figure 3B,C; Patient 1). However, this low WSS did not develop the large stagnation volume at the apical area (Figure 3D; Patient 1).
For the smaller LV and consequently shorter distance to the ventricular wall (Patient 2), part of the flow which is not transported directly through the IC reaches the septum wall and is redirected to the center of the LV without passing to the opposite side. Regarding WSS distribution, large areas with low nonphysiological WSS can be seen at the backside as well as the front side (Figure 3B,C; Patient 2), developing a large volume of stagnation at the apex of the LV (Figure 3D; Patient 2).
For both patients, high nonphysiological WSS was observed at the tip of the IC. Figure 4 shows the distribution of the WSS at the IC surface in three categories as well as the volume of stagnation for both patients.
4 DISCUSSION
The high reported prevalence of thrombi in the apical region of LVAD patients 16-18 highlights the necessity of a detailed evaluation of flow behavior in this region. Although several potential causes of thrombus growth during LVAD support have been reported,13, 16-18, 22, 23, 33 this is the first study investigating the apical flow fields of LVAD patients to quantify the potential relationship of IC thrombus formation and IC to ventricular wall distance. The quantitative evaluation was based on the parameters which were already linked to thrombotic risk including SR and WSS.
The inflow jet was directed toward the septal wall for Patient 1 with the large LV. One possible reason for this behavior could be the large LV diameter and the angle of the MV–IC axis in the coronal plane. It can be seen in Figure 2A that the cannula deviated toward the lateral side by 20° from the MV–IC axis. Therefore the inflow jet has a curved shape directed toward the septum and reaches the apex of the LV at this side (apical separation point), where it traveled around the IC and was redirected to the center of the LV from the lateral wall (Figure 3). Although the cannula surface at the lateral side showed a low nonphysiological WSS distribution, the high apical washout with remarkable circular components prevents the development of stagnation region at these areas.
For Patient 2 (small distance between LV wall and IC), the angle of the IC with respect to the MV–IC axis was 9°, which enables the majority of the blood entering the LV through the MV to directly enter the cannula, with only a small part of the flow hitting the septal wall. The distance between the IC and lateral wall of the LV created a narrow gap because of the laterally displaced implantation of the cannula. Consequently blood flow around the cannula diminished and was instead redirected to the center of the LV which highly reduced the washout around the cannula.
For both LV models, the transition zone of the sintered HVAD IC, which was already mentioned as the origin of thrombus formation,17 was mainly within the low nonphysiological range and fully exposed to stagnating flow. High nonphysiological WSS already occurred at the cannula tip (Figure 3D), which can increase the risk of platelet activation when traveling through the pump cannula.
Thrombus formation and consequently thromboembolic adverse events are multifactorial phenomena,34 including the type of LVAD,35-37 blood stream infection,38 anticoagulation therapy and blood pressure management,33, 39, 40 the size of the LV,20, 21, 41 and the inflow cannula insertion angle.14, 19, 42 The results presented in this study emphasize that the implantation site of the inflow cannula also needs to be considered as a risk factor for thrombosis.
Stagnation at the apex was significantly increased with a cannula near the lateral wall compared to a central implantation of the cannula at the apex. Similar effects are expected for inflow cannulas close to other parts of the chamber wall, as the small distance blocks the blood circulation around the inflow cannula.
Further, in additional studies the effects of the MV–IC angle should be considered in more detail to be able to recommend optimal IC implantation.
5 LIMITATION
Ventricular contraction is very limited in LVAD patients and therefore was not considered in this study but should be considered in future studies. However, ventricular contraction in VAD patients hardly happens at the apex, but mainly at the center of the ventricle.43 Therefore only limited effects on apical flow are expected. The mitral valve leaflets were not included in the LV models, as its complex structure and interaction with cardiac contraction were not within the context of this study and constitutes a separate field for further research. Finally, the number of two patients used in this study was very limited, yet the selected cases are good representatives of average patients and were carefully selected.
Among all the risk factors of ventricular thrombosis, this study addressed the implantation site of the inflow cannula and did not cover other contributing risk factors. Also due to the fact that both patients are still on LVAD support, the direct link of the found stagnation regions with the origin of the thrombus formation is missing. However, we consider this study a starting point for further investigations in this direction including MV–IC angle, mitral valve diameter, degree of support.
6 CONCLUSION
The flow at the apex of the LVAD-supported ventricle and the thrombosis-related parameters are highly dependent on factors which change on a patient-to-patient basis. With the current data, circular blood washout and lower stagnation regions were observed for a cannula implantation at the apex with large parietal distances to the wall. Implantation of the IC close to the lateral/septal wall showed an increase in stagnation volume which is linked to an increase in thrombotic risk. This study shows that implantation and pump position can be an essential contributor to the adverse events profile of VAD pumps. However, considering the multifactorial nature of thromboembolic events, a further multiparameter analysis of the apical flow in a larger cohort could help to improve the understanding of the reasons for the high prevalence of thrombosis in this region.
ACKNOWLEDGMENTS
This work was supported by the Vienna Scientific Cluster (VSC) Computer Network, the Project of the Jubiläumsfonds of the National Bank Austria Nr 17314 and the Austrian Research Promotion Agency (FFG): M3dRES Project Nr 858060.
CONFLICT OF INTEREST
The authors declare that they have no conflicts of interest with the contents of this article.
AUTHOR CONTRIBUTIONS
Concept/design: Ghodrati, Schima, Aigner
Data analysis/interpretation: Ghodrati, Aigner, Schima
Drafting article: Ghodrati, Aigner
Critical revision of article: Maurer, Schlöglhofer, Khienwad, Zimpfer, Beitzke, Zonta, Moscato, Schima, Aigner
Approval of article: Maurer, Schlöglhofer, Khienwad, Zimpfer, Beitzke, Zonta, Moscato, Schima, Aigner
Statistics: Ghodrati
Funding: Schima
Data collection: Ghodrati, Schlöglhofer, Aigner


