Effects of tea polyphenols on the growth performance, carbohydrate metabolism of grass carp (Ctenopharyngodon idellus)
Abstract
To investigate the effects of tea polyphenols (TPs) on the growth and carbohydrate metabolism of grass carp (Ctenopharyngodon idella), 0 (control group), 250, 500, 1000, 2000, and 4000 mg kg−1 TPs were added to the basal diet and fed to grass carps for 8 weeks. The results show that 500 mg kg−1 group exhibited the significantly highest feed conversion efficiency (FCE) and specific growth rate (SGR) (p < .05) and significantly higher activities of pyruvate kinase (PK), lactate dehydrogenase (LDH), malate dehydrogenase (MDH) and succinate dehydrogenase (SDH) (p < .05). The livers of the control group and 500 mg kg−1 group were subjected to RNA-Seq, and the expressions of glycogen phosphorylase (PYG) and sucrase-isomaltase (SI) genes were upregulated, while that of glucose-6-phosphatase (G6PC) was downregulated, and these promoted glycogen catabolism. The expressions of glucokinase (GK), PK, 6-phosphofructokinase (PFK), glucose-6-phosphate 1-dehydrogenase (G6PD) and fructose-bisphosphate aldolase A (ALDOA) genes were upregulated to promote glucose catabolism. The results indicate that 500 mg kg−1 TPs could upregulate the expressions of some genes that promote carbohydrate decomposition, increase the activities of carbohydrate decomposition enzymes and enhance the utilization of carbohydrates, thereby improving the FCE and SGR.
1 INTRODUCTION
Tea polyphenols (TPs) are the main ingredients of tea and account for about 30% of the dry weight of green tea leaves (Li et al., 2018; Liang et al., 2017). Animal studies have shown that TPs have many biological functions, such as antioxidative (Afzal et al., 2015), anti-obesity (Henning et al., 2018) and antibacterial activities (Yang & Zhang, 2019). Numerous studies have suggested that TPs regulate carbohydrate metabolism. TPs have been reported to change the structure of bacterial flora in the cecum and colon and reduce the fasting blood glucose level of type 2 diabetic (db/db) mice significantly (Chen et al., 2019). Epigallocatechin-3-gallate (EGCG), the main component of TPs, inhibits hepatic glucose production in mice by reducing mitochondrial activity, activating Adenosine 5'-monophosphate (AMP)-activated protein kinase (AMPK), antagonizing the cAMP/PKA signalling pathway and suppressing FoxO1 nuclear translocation (Li et al., 2019). EGCG decreased the mRNA expression of phosphoenolpyruvate carboxykinase in the liver and adipose tissue of db/db mice; however, expression of the glucokinase (GK) gene was upregulated in a dose-dependent manner in the liver, markedly enhancing glucose tolerance in the diabetic rodents (Wolfram et al., 2006). In fish, most of the studies on TPs focused on meat preservation, antioxidant ability, and growth performance (Deng et al., 2019; Guo et al., 2018; Ji et al., 2018; Long et al., 2017; Luan et al., 2017), and few studies evaluated the regulation of carbohydrate metabolism by TPs.
Carbohydrate is an important nutrient that promotes the growth of fish (Wang, Li, Han, et al., 2016). Carbohydrate can reduce the protein consumption of fish, as it has a protein-sparing effect (Shiau & Lin, 2001; Talukdar et al., 2019). However, fish, especially carnivorous fish, cannot use carbohydrate effectively. In fish, endogenous glucose production in the liver remains high, regardless of exogenous (dietary) glucose intake levels, and there is a competitive relationship between the two processes as an energy source that results in the poor utilization of dietary carbohydrate (Enes et al., 2009; Kamalam et al., 2017; Panserat et al., 2001). Moreover, the peripheral tissues of fish cannot use glucose effectively, resulting in poor glucose tolerance (Moon, 2001; Panserat & Kaushik, 2002). Carbohydrate is the primary and cheap source of energy for aquatic animals (Wang et al., 2016). Therefore, it is essential for the aquaculture industry to improve carbohydrate utilization and reduce feed cost.
Grass carp (Ctenopharyngodon idellus), a typical herbivorous fish, uses dietary carbohydrate to a greater extent than carnivorous and omnivorous fish species; however, high carbohydrate feed is not conducive to its growth performance (Cai et al., 2018). Grass carp is an important freshwater aquaculture species, and its annual total output has surpassed that of other cultured fish species for many years (FAO, 2018). Therefore, it is important to improve the carbohydrate utilization of grass carp to reduce feed cost. In this study, grass carps were fed with different amounts of TPs. On the basis of the growth and carbohydrate-metabolizing enzyme activity, the optimal level of TPs for grass carp growth was determined. Then, transcriptome sequencing of grass carp liver was performed, and the effects of TPs on the utilization of carbohydrate in grass carp was analysed at a molecular level. Our findings will provide a research basis for improving carbohydrate metabolism and feed utilization in fish.
2 MATERIALS AND METHODS
2.1 Ethical approval
All the experiments were performed in strict accordance with the recommendations in the Guide for the Care and Use of Laboratory Animals of the National Laboratory Animal Welfare Ethics, and the animal protocols were approved by the Ethical Committee of the Faculty of Veterinary Science of Anhui Agricultural University (Permit Number: 20,160,301). Every effort was made to reduce the number of animals used and minimize the suffering of the animals.
2.2 Fish and experimental diets
One thousand two hundred grass carp specimens were obtained from a commercial fish farm (Hefei, Anhui Province, China). Prior to the experiment, the fish were temporary reared in a recirculating aquaculture system for 14 days. During this period, the fish were fed twice a day with the basal diet (Table 1). The basal diet was supplemented with TPs (TPs ≥98%; Wuhu Tianyuan Science & Technology Development Co. Ltd, China) to formulate the G0, G250, G500, G1000, G2000, and G4000 diets (0, 250, 500, 1000, 2000, and 4000 mg kg−1 TPs, respectively). All diets were formulated in the form of 2-mm pellets with a feed pelletizer, dried in a blast drying oven at 65℃ and stored at −20℃ for further use.
| Ingredient | Content (g kg−1) |
|---|---|
| Fish meal | 150.00 |
| Soybean meal | 420.00 |
| Rapeseed meal | 100.00 |
| Cottonseed meal | 80.00 |
| Wheat meal | 75.00 |
| Cellulose | 70.00 |
| α-starch | 40.00 |
| Soybean oil | 30.00 |
| Ca(H2PO4)2 | 16.00 |
| Mineral premixa | 12.00 |
| Vitamin premixb | 3.00 |
| Choline chloride | 3.00 |
| Vitamin C | 1.00 |
| Proximate composition | |
| Ash (g kg−1) | 64.50 |
| Crude protein (g kg−1) | 357.00 |
| Crude lipid (g kg−1) | 50.20 |
| Gross energy (J mg−1) | 15.13 |
- a Mineral premix (mg kg−1 premix): C6H10CaO6·5H2O, 1750; Ca(H2PO4)·2H2O, 10,000; CoSO4·6H2O, 0.5; CuSO4·5H2O, 15.5; FeSO4, 1250; KH2PO4, 16,000; KI, 1.5; MgSO4·7H2O, 7500; MnSO4·4H2O, 81; NaCl, 500; NaH2PO4·2H2O, 12,500; starch, 225; ZnSO4·7H2O, 176.5.
- b Vitamin premix (mg kg−1 premix): pyridoxine, 20; starch, 3226; calcium pantothenate, 50; riboflavin, 20; inositol, 100; cyanocobalamine, 2; biotin, 5; vitamin A, 440000 IU; vitamin D3, 96000 IU; vitamin K3, 10; vitamin E, 100; niacin, 100; folic acid, 5; thiamin, 20.
2.3 Feeding trial and sampling
Six groups were established for the experiment, with three repetitions for each group. Therefore, a total of 18 tanks (60 cm ×60 cm ×60 cm; volume, 180 L) with circulating water systems were used. After the adaptation period, grass carps with similar physical conditions were selected, at a density of 30 in each tank, and weighed. The fish were fed twice a day (9:00 and 15:00, surplus feed after 1 h) for 8 weeks. During the trial period, fluorescent lamps provided 12 h of light daily (8:00 to 20:00). The circulating water volume in a tank was 2.5 L min−1; water temperature, 27 ± 0.5℃; dissolved oxygen, 7.0 ± 0.5 mg L−1; pH, 7.5; and ammonia nitrogen, less than 0.1 mg L−1.
After the feeding trial, the fish were starved for 24 h. Then, the fish in each tank were weighed, and the specific growth rate (SGR) and feed conversion efficiency (FCE) were calculated. Samples of the serum, liver and back muscles were obtained from seven fish collected randomly from each tank. On the basis of the growth results, another three fish from each tank were randomly collected from the G0 and G500 groups for the transcriptome analysis.
The fish were anaesthetized with MS-222 (200 mg L−1) before sampling. All samples were immediately frozen and stored in liquid nitrogen for further analysis. All experiments were performed in accordance to the Guidelines for the Management of Laboratory Animals in China. To adhere to scientific principles, the number of animals was minimized, and various methods were used to alleviate the suffering of the animals.
2.4 Chemical analysis
The proximate compositions of the fish and diets were analysed using the methods of the Association of Official Analytical Chemists methods (AOAC, 2003). The levels of insulin, liver glycogen and muscle glycogen and activities of pyruvate kinase (PK, EC2.7.1.40), lactate dehydrogenase (LDH, EC1.1.1.27), succinate dehydrogenase (SDH, EC1.3.5.1) and malate dehydrogenase (MDH, EC1.1.1.37) were measured using assay kits purchased from Nanjing Jiancheng Bioengineering Institute (Nanjing, China).
2.5 RNA sequencing analysis
The transcriptome samples were sent to Beijing Novogene Biotechnology Co., Ltd. (Beijing, China) for RNA-sequencing analysis.
2.5.1 Library construction and sequencing
Before construction of the cDNA library, degradation and contamination, purity, concentration and integrity of the total RNA were checked. First-strand cDNA was synthesized using mRNA as the template. DNA polymerase and RNase H were used to synthesize the second-strand cDNA. The cDNA library was obtained using Polymerase Chain Reaction (PCR) amplification after purification, end repair, poly-A addition and connection of sequencing splices. The library was sequenced on Illumina Hiseq platform, and pair-ends for 125 bp/150 bp reads were generated. Clean data were obtained by quality control of the original sequencing data. The quality of the clean reads was evaluated using Q20%, Q30% and GC content. For gene annotation of the clean reads, the reference genome and gene model annotation files were downloaded directly from the reference genome website for grass carp (http://www.ncgr.ac.cn/grasscarp/) (Wang et al., 2015).
2.5.2 Differentially expressed gene screening and enrichment analysis
The gene expression level was quantified using the expected number of fragments per kilobase of transcript per million mapped reads (FPKM), with FPKM >1 considered for gene expression (Trapnell et al., 2010). Differential gene expression was analysed using DESeq-R (1.18.0). The methods of Benjamini and Hochberg were used to adjust the resulting P value and control the false discovery rate. Genes with “q values (adjusted P values) <.05 and |log2Foldchange| >1” were found to be differentially expressed. The statistical enrichment of differentially expressed genes (DEGs) in the KEGG (http://www.genome.jp/KEGG) pathways was studied using KOBAS software.
2.6 Quantitative real-time PCR analysis
On the basis of the important carbohydrate metabolic pathways, nine differential genes, GK (EC2.7.1.1), glycogen phosphorylase (PYG, EC2.4.1.1), glucose-6-phosphatase (G6PC, EC3.1.3.9), sucrase-isomaltase (SI, EC3.2.1.3), 6-phosphofructokinase (PFK, EC2.7.1.11), PK, fructose-bisphosphate aldolase A (ALDOA, EC4.1.2.13), glucose-6-phosphate 1-dehydrogenase (G6PD, EC:1.1.1.49) and insulin (INS), were selected and then identified using quantitative real-time (qRT)-PCR. According to the gene sequences in the transcriptome library, specific primers were designed using Primer-BLAST in the NCBI website (https://www.ncbi.nlm.nih.gov), with β-actin (Yang et al., 2011) as the internal reference gene; all the primer sequences are listed in Table S1. The first-strand cDNA was synthesized using the PrimeScriptTM first-stand cDNA Synthesis Kit (TaKaRa, Dalian, China). The AceQ® qPCR SYBR® Green Master Mix kit (Vazyme, Nanjing, China) was used to determine the expression of each sample in triplicate and TIB-8600 real-time fluorescence quantifier (TIB, Xiamen, China) with a reaction volume of 20 μl. The cycle parameters were as follows: 5 min at 95℃, followed by 40 cycles at 95℃ for 15 s and 60℃ for 30 s. Dissociation curve analysis was performed to examine amplification specificity. The 2−∆∆CT method was used to calculate gene expression.
2.7 Data analysis
The data are presented as mean ± SE. The normality and homogeneity of variances among the groups were tested. The results were subjected to one-way analysis of variance. If the results were statistically significant (p <.05), Duncan's multiple range tests were used to determine the differences between the experimental groups. SPSS software (version 22) was used for the statistical analysis.
3 RESULTS
3.1 Growth performance
The growth performance results are presented in Table 2 (these data have been published, Muhammad Rizwan et al., 2021). With an increase in the amount of TPs, the final weight and SGR first increased, decreased, and then increased, with a significant increase observed in the G500 group (p <.05). With an increase in the amount of TPs, FR first decreased and then increased; the lowest FR value was detected in the G1000 group, but it was not statistically significant (p >.05). With an increase in the amount of TPs, FCE first increased and then decreased, and FCE was significantly higher in the G500 group than in the other groups (p <.05).
| Group | Initial weight (g) | Final weight (g) | SGR (% day−1)a | FR (% bw day−1)b | FCE (%)c |
|---|---|---|---|---|---|
| G0 | 4.46 ± 0.08 | 13.6 ± 0.73a | 2.16 ± 0.11a | 3.52 ± 0.22 | 54.79 ± 2.41a |
| G250 | 4.43 ± 0.06 | 13.97 ± 0.96a | 2.22 ± 0.11ab | 3.41 ± 0.24 | 57.51 ± 3.23a |
| G500 | 4.48 ± 0.10 | 15.67 ± 0.46b | 2.41 ± 0.07b | 3.34 ± 0.16 | 62.30 ± 1.83b |
| G1000 | 4.56 ± 0.13 | 14.34 ± 1.09a, b | 2.18 ± 0.11a, b | 3.26 ± 0.26 | 58.61 ± 2.53a, b |
| G2000 | 4.40 ± 0.07 | 14.25 ± 1.59a, b | 2.26 ± 0.24a, b | 3.39 ± 0.37 | 58.97 ± 2.17a, b |
| G4000 | 4.38 ± 0.15 | 15.05 ± 1.40a, b | 2.38 ± 0.15a, b | 3.62 ± 0.13 | 57.32 ± 2.78a, b |
Note
- Values within the same column with different superscripts (a, b) indicate significant differences (p <.05).
- a Specific growth rate (SGR, %/day) =100 × [ln final weight (wet weight, g) − ln initial body weight (wet weight, g)] / days.
- b Feeding rate (FR, % bw/day) =100 × feed intake (dry matter, g) / days / [(initial body weight (wet weight, g) + final body weight (wet weight, g)) / 2].
- c Feed conversion efficiency (FCE, %) =100 × [final body weight (wet weight, g) − initial body weight (wet weight, g)] / feed intake (dry matter, g).
3.2 Proximate composition
No significant effects of TPs were observed on the moisture, ash, crude protein, and crude lipid content of the grass carps (p >.05; Table 3).
| Groups | Moisture (g kg−1) | Crude protein (g kg−1) | Crude lipid (g kg−1) | Ash (g kg−1) |
|---|---|---|---|---|
| G0 | 746.1 ± 3.6 | 181.1 ± 4.4 | 67.2 ± 4.6 | 30.9 ± 5.3 |
| G250 | 741.5 ± 5.9 | 179.3 ± 2.9 | 70.2 ± 10.2 | 27.6 ± 0.9 |
| G500 | 744.3 ± 13.7 | 175.4 ± 0.8 | 68.3 ± 15.7 | 26.9 ± 1.1 |
| G1000 | 745.7 ± 7.1 | 179.4 ± 5.1 | 66.8 ± 9.7 | 26.7 ± 1.3 |
| G2000 | 744.7 ± 6.8 | 180.2 ± 3.0 | 67.2 ± 8.2 | 27.7 ± 0.2 |
| G4000 | 751.5 ± 3.3 | 182.4 ± 2.0 | 62.1 ± 3.8 | 26.6 ± 1.0 |
3.3 Carbohydrate metabolism indicators
The supplementation of dietary TPs increased the activities of PK, LDH, SDH and MDH; the G250 and G500 groups showed a significant improvement in the indexes (p <.05; Table 4). TPs had a marked impact on dehydrogenase activities, especially in the range of 250 to 1000 mg kg−1. All TP diets could significantly improve the activity of SDH; the G2000 group showed the highest SDH activity, which was higher than that of the G0 group by 219.24% (p <.05).
| Groups | PK (U g prot−1) | LDH (U g prot−1) | SDH (U mg prot−1) | MDH (U mg prot−1) |
|---|---|---|---|---|
| G0 | 8.25 ± 0.36a | 11,220.53 ± 1148.86a | 3.17 ± 0.27a | 13.33 ± 1.12a |
| G250 | 11.28 ± 1.20b | 14,072.56 ± 637.52b | 5.02 ± 0.74b | 18.29 ± 2.45b |
| G500 | 10.10 ± 0.86b | 14,049.62 ± 593.11b | 5.38 ± 1.34b | 19.30 ± 1.13b |
| G1000 | 7.52 ± 0.85a | 14,448.53 ± 622.12b | 5.84 ± 0.70b | 16.15 ± 0.52b |
| G2000 | 8.90 ± 1.20a | 12,698.41 ± 1216.94a,b | 6.95 ± 1.28b | 15.89 ± 3.41a,b |
| G4000 | 11.55 ± 1.31b | 12,256.06 ± 714.54a | 5.12 ± 1.10b | 13.05 ± 1.88a |
Note
- Values within the same column with different superscripts (a, b) indicate significant differences (p <.05).
- Abbreviations: LDH, lactate dehydrogenase; MDH, malate dehydrogenase; PK, pyruvate kinase; SDH, succinate dehydrogenase.
When compared with the G0 group, no significant differences in INS levels were observed among all the TP treatment groups (Table 5). However, all amounts of TPs could significantly reduce glycogen content in the muscle and liver (p <.05). Moreover, muscle glycogen and hepatic glycogen levels were the lowest in the G500 and G2000 groups, respectively.
| Groups | Insulin (mIU L−1) | Muscle glycogen (mg g−1) | Liver glycogen (mg g−1) |
|---|---|---|---|
| G0 | 0.94 ± 0.06 | 0.76 ± 0.13a | 18.48 ± 1.97a |
| G250 | 1.07 ± 0.16 | 0.47 ± 0.09b | 13.25 ± 1.17b |
| G500 | 1.10 ± 0.11 | 0.28 ± 0.07b | 10.37 ± 3.57b |
| G1000 | 1.03 ± 0.28 | 0.29 ± 0.04b | 9.86 ± 2.75b |
| G2000 | 0.99 ± 0.14 | 0.39 ± 0.08b | 8.35 ± 0.93b |
| G4000 | 0.95 ± 0.20 | 0.40 ± 0.06b | 10.50 ± 3.04b |
Note
- Values within the same column with different superscripts (a, b) indicate significant differences (p <.05).
3.4 Transcriptome analysis
3.4.1 Overview of the mRNA libraries
To identify the differentially expressed mRNAs in the livers of the grass carps fed with TPs, six cDNA libraries for G500 (A_1, A_2 and A_3) and G0 (B_1, B_2 and B_3) were constructed using the Illumina Hiseq™ 4000 sequencing platform, and about 293 million raw reads were generated (Table S2). After filtration, an average of 47 million clean reads per library was obtained. The total read length of the six samples was 42.33 Gb. The Q20 and Q30 percentages of the six libraries were all greater than 96% and 90%, respectively, and the error rate was 0.02%. The percentages of GC content in the clean reads of the six libraries were greater than 46.50%. FPKM was used to evaluate the gene expression level. The FPKM threshold and gene number in each library are listed in Table S3. Among the six samples, 53.28–55.71% of the mRNA transcripts had FPKM >1. The clean sequencing read data have been submitted to the Sequence Read Archive (accession number, SRP171956).
3.4.2 DEGs between the G0 and G500 groups
From the G500 group (A) and G0 group (B) libraries, 13,684 genes were obtained (Figure S1), 1052 of which were expressed only in the G500 group libraries, 416 in the control group libraries, and 12,216 in both groups (FPKM >1 as the standard for gene expression). In addition, 1923 DEGs were screened between the G0 and G500 groups, with “q value <.05 and |log2Foldchange| >1” (Figure S2).
Because of the large number of DEGs, they were filtered using “q value <.001 and |log2Foldchange| >1” before mapping to the typical reference pathways in KEGG (Table S4). The most significant 20 enrichment pathways were selected for the scatter plots (Figure S3). “Metabolic pathways” were found to have the most varied genes. The maximum enrichment degree was observed in “Starch and sucrose metabolism” and “Galactose metabolism.”
3.4.3 KEGG pathways related to carbohydrate metabolism
Eight pathways (corrected P value <.05) related to carbohydrate metabolism were detected with significant enrichment in KEGG: “Galactose metabolism,” “Starch and sucrose metabolism,” “Amino sugar and nucleotide sugar metabolism,” “Glycolysis/gluconeogenesis,” “Fructose and mannose metabolism,” “Pentose phosphate pathway,” “Glyoxylate and dicarboxylic acid metabolism pathway” and “Insulin signalling pathway.” Among them, “Insulin signalling pathway” and “Starch sucrose metabolism pathway” were important for regulating the blood glucose balance. “Glycolysis/gluconeogenesis” and “Pentose phosphate pathway” were important for glucose catabolism.
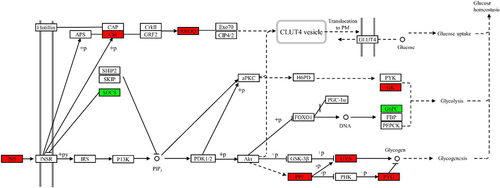
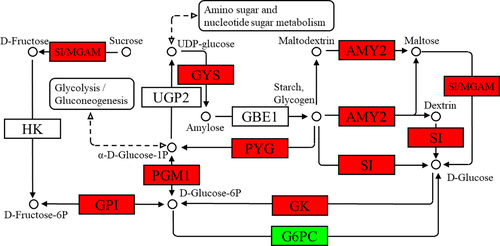
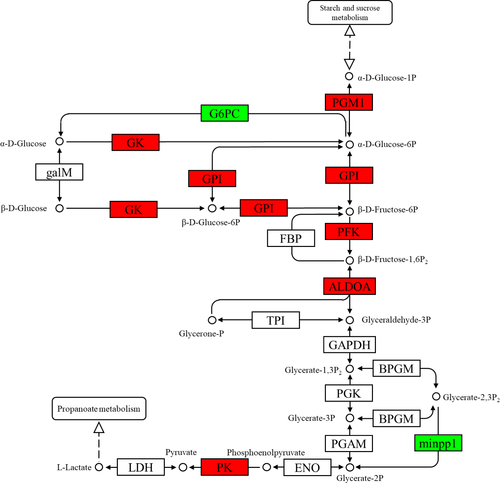
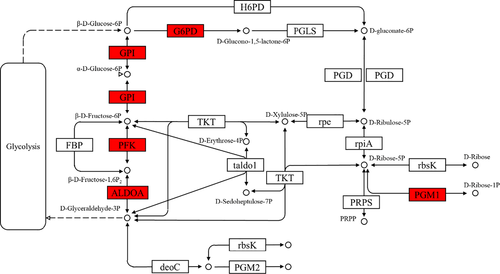
In the insulin signalling pathway (Figure 1), the expression levels of INS, ubiquitin-protein ligase CBL (Cbl, EC2.3.2.27), Rho-related GTP-binding protein RHOQ (belonging to the TC10 family), GK, protein phosphatase 1 regulatory subunit 3C-B (PP1), glycogen synthetase (GYS, EC2.4.1.11) and PYG genes were upregulated, but that of G6PC gene was downregulated. In the starch and sucrose metabolism pathway (Figure 2), the upregulated genes were SI, maltase-glucoamylase (MGAM, EC3.2.1.20), glucose-6-phosphate isomerase (GPI, EC5.3.1.9), glucose-phosphate mutase 1 (PGM1, EC5.4.2.2), pancreatic alpha-amylase (AMY2, EC3.2.1.1), PYG, GYS and GK, whereas the G6PC gene was downregulated. In the glycolysis pathway (Figure 3), the expressions of PFK, PK, GK, ALDOA, PGM1 and GPI genes were upregulated, whereas those of G6PC and multiple inositol polyphosphate phosphatase 1 (minpp1, EC3.1.3.80) were downregulated. In the pentose phosphate pathway (Figure 4), the upregulated genes were G6PD, PFK, PGM1, GPI and ALDOA.
3.4.4 Validation of DEGs with qRT-PCR
The qRT-PCR and RNA-Seq results for the nine carbohydrate metabolism-related DEGs were consistent (Figure S4). The expressions of INS, GK, G6PD, PYG, PK, SI, PFK and ALDOA genes were upregulated, whereas that of G6PC was downregulated.
4 DISCUSSION
TPs are important bioactive compounds in tea, and they account for about 30% of the dry weight of green tea (Li F. et al., 2018; Liang et al., 2017; Zhao & Zhang, 2019). Previous studies have shown that green tea as a feed additive promotes fish growth performance. When sterlet (Huso huso ♂ × Acipenser ruthenus ♀) was fed with 50 and 100 mg kg−1 of green tea extract, the weight gain (WG) was significantly improved (Hasanpour et al., 2017). Diet supplementation with 2500 and 5000 mg kg−1 green tea powder could significantly increase the SGR of Nile tilapia (Oreochromis niloticus L.) by 9.02% and 14.34%, respectively (Abdel-Tawwab et al., 2010). In the present study, TPs had no significant effects on the FR of grass carp; however, 500 mg kg−1 TPs significantly increased the FCE and SGR, suggesting that TPs can promote grass carp growth by increasing FCE, rather than by increasing FR. Similar studies have shown that the addition of an appropriate amount of TPs to the feed can increase the WG and SGR of Wuchang bream (Megalobrama amblycephala) (Long et al., 2017) and large yellow croaker (Larimichthys crocea) (Ji et al., 2018).
PK is one of the key enzymes involved in glycolysis (Enes et al., 2009; Fan et al., 2019). A previous study suggested that the hepatic PK activity of grass carp increased with an increase in dietary carbohydrates, promoting the utilization of carbohydrates (Yuan et al., 2013). LDH catalyses the conversion of pyruvate to lactate, which is an important factor that determines whether the consumed glucose is converted to energy by aerobic or anaerobic glycolysis (Jelinek et al., 2018; Yang et al., 2019). The tricarboxylic acid (TCA) cycle is the main pathway for glucose metabolism under aerobic conditions, and it plays a central role in the metabolism of carbohydrates, fatty acids and proteins (Koubaa et al., 2013). SDH and MDH play important roles in carbohydrate metabolism; they are essential enzymes in the TCA cycle in mitochondria (Yin et al., 2019). In this study, hepatic PK, LDH, MDH and SDH activities significantly increased in the grass carps fed between 250 and 1000 mg kg−1 TPs, indicating that TPs can accelerate glycolysis and TCA cycle metabolism and promote carbohydrate metabolism.
To understand the metabolic pathways associated with the DEGs, KEGG pathway enrichment analysis was performed. The results showed that 12 of the top 20 most significantly enriched pathways were material metabolic pathways, and the largest number of DEGs was found in “Metabolic pathways.” This indicates that TPs mainly affect material metabolism in grass carp. TPs can promote insulin-mediated glucose and lipid metabolism by regulating glycogen synthesis and lipogenesis-related enzymes (Kim et al., 2013). EGCG, the main active ingredient of TPs, can alleviate metabolic abnormalities and fatty liver diseases due to high-fat diets by regulating bile acid homeostasis (Huang et al., 2018). TPs may stimulate the downregulation of EGFR/PI3K/Akt/Sp1 signal transduction pathways through the molecular mechanisms underlying fatty acid synthase gene suppression (Lin & Lin-Shiau, 2006). All the above-mentioned studies showed that TPs affect metabolism. In addition, five of the top 20 significantly enriched pathways were carbohydrate metabolic pathways; “Starch and sucrose metabolism” and “Galactose metabolism” showed the highest enrichment factor, indicating that the TPs had a greater effect on carbohydrate metabolism in grass carp liver.
INS is a type of protein hormone produced by pancreatic β-cells, and it is essential for the regulation of glucose homeostasis (Maechler, 2013; Mayer et al., 2007). INS binds to the insulin receptor, which undergoes autophosphorylation and catalyses the phosphorylation of Cbl. The phosphorylated Cbl interacts with signal molecules through its SH2 domain, activates TC10, and then stimulates the transport of GLUT4 from inside the cell to the plasma membrane, thus increasing glucose transport in cells (Saltiel & Kahn, 2001). In this study, the expressions of CBL and RHOQ genes were upregulated, indicating that TPs promote glucose transport. In hepatocytes, INS promotes glycogen synthesis via the GSK-3β/GYS pathway. The inactivation of GSK-3β leads to the dephosphorylation of GYS. INS can also stimulate the dephosphorylation of GYS by activating PP1, thus activating GYS and promoting glycogen synthesis (Brady & Saltiel, 2001; Kadowaki et al., 2012; Lizcano & Alessi, 2002). In this study, the expressions of PP1 and GYS were upregulated, and PP1 dephosphorylated GYS and promoted glycogen synthesis. However, both liver glycogen and muscle glycogen levels decreased significantly, which may be related to the upregulation of PYG expression in the insulin signalling pathway and enhanced glycogen phosphorylation catabolism.
Glucose is mainly stored in the liver and muscle as glycogen. Hepatic glycogen mainly maintains blood glucose levels, whereas inositol provides energy for muscle contraction (Akram et al., 2011; Kanungo et al., 2018). During starch and sucrose metabolism, sucrose can generate d-glucose-6-P under the catalysis of SI, MGAM, hexokinase (HK) and GPI. Starch and glycogen can generate d-glucose under the catalysis of AMY2 and SI, and they can directly generate α-d-glucose-1-P under the catalysis of PYG. In this study, TPs increased the expressions of SI, GPI, MGAM, PYG, AMY2 and other genes in the liver and significantly decreased liver glycogen content, indicating that TPs can promote glycogen to break down into glucose.
In fish, low peripheral glucose utilization and persistently high levels of endogenous glucose, which competes with exogenous glucose as an energy source, result in poor carbohydrate utilization (Enes et al., 2009; Moon, 2001; Panserat & Kaushik, 2002; Panserat et al., 2001). Glucose (glycogen) decomposition mainly includes glycolysis, TCA cycle and pentose phosphate cycle. Under anaerobic conditions, glucose undergoes glycolysis to produce lactic acid. The reaction rate is mainly regulated by three rate-limiting enzymes: GK, PFK and PK (Weber et al., 1966; Wei et al., 2018). In a previous study, EGCG upregulated the expression of GK mRNA in the liver of db/db mice in a dose-dependent manner and markedly enhanced glucose tolerance (Wolfram et al., 2006); this was similar to how TPs increased GK gene expression in this study. In cancer cells, EGCG has inhibited the activities and gene expressions of HK, PFK and PK (Li et al., 2016; Wei et al., 2018, 2019). These results contradict the findings of the present study, which may be related to the fact that cancer cells are not normal body cells. The effects of TPs on the key enzymes of fish glycolysis need to be investigated further.
In addition, the expression of ALDOA gene was upregulated, but that of G6PC was downregulated. ALDOA catalyses the reversible reaction of fructose-1,6-P2 to glyceraldehyde-3-P and dihydroxyacetone phosphate. ALDOA catalyses the reversible reaction of fructose-1,6-bisphosphate to glyceraldehyde-3P and dihydroxyacetone phosphate (glycerone-P), which generates glycoraldehyde-3P under the catalysis of triose phosphate isomerase; only glycoraldehyde-3P can complete glycolysis (Lincet & Icard, 2015). G6PC is the key enzyme of gluconeogenesis, which catalyses the conversion of glucose-6-P to glucose (Wang & Dong, 2019). The results show that the TPs accelerated glycolysis, inhibited gluconeogenesis and promoted glycogen and glucose catabolism.
Glycolysis is connected to other metabolic pathways, notably the pentose phosphate pathway. The pentose phosphate pathway is one of the most common methods for glucose metabolism, and it is characterized by direct decarboxylation and dehydrogenation of glucose (Payen et al., 2016). A previous study has suggested that G6PD is the first and rate-limiting enzyme of the pentose phosphate pathway (Jiang et al., 2011). In the present study, G6PD gene expression was upregulated, which indicates that the TPs can promote glucose catabolism through the pentose phosphate pathway.
In conclusion, the results of the present study demonstrate that 500 mg kg−1 of TPs significantly increased the FCE and SGR of grass carp, whereas the other dietary TP levels had no significant effects on the growth performance. Dietary supplementation with an appropriate amount of TPs can regulate the differential expression of related genes in carbohydrate metabolism pathways, improve the activities of carbohydrate-metabolizing enzymes and strengthen the decomposition and utilization of glycogen in fish, thus improving the FCE and growth of grass carp.
ACKNOWLEDGEMENTS
The present study was supported by Anhui Natural Science Foundation (1808085MC63), the fund allocated for China Agriculture Research System (CARS-19) and State Key Laboratory of Tea Plant Biology and Utilization (SKLTOF20170109). All authors also thank the anonymous reviewers for their helpful suggestions.
CONFLICT OF INTEREST
The authors declare that there are no conflicts of interest.
Open Research
Data Availability Statement
The data that support the findings of this study are appearing in the submitted article.


