Development and integration of LensHooke® R10 for automatic and standardized diagnosis for sperm DNA fragmentation
Funding information:
Bonraybio Co., Ltd.; Division of Infertility Clinic, Lee Womens’ Hospital (Taichung, Taiwan)
Cheng-Teng Hsu and Chun-I. Lee are co-first authors with equal contribution and importance.
[Correction added on 20 March 2023, after first online publication: Supporting list and figure 1C is corrected.]
Abstract
Background
The sperm chromatin dispersion assay is commonly used to assess sperm DNA integrity. This approach is time-consuming, demonstrates poor chromatin preservation, and provides an ambiguous and unstandardized evaluation of fragmented chromatin.
Objectives
We aimed to (i) develop an optimized sperm chromatin dispersion assay with reduced operation time, (ii) validate R10 test accuracy by comparing it to a conventional sperm chromatin dispersion assay, and (iii) standardize the sperm DNA fragmentation analysis procedure by integrating artificial intelligence optical microscopic technology.
Materials and methods
This cross-section study included 620 semen samples. Aliquots were analyzed by a conventional Halosperm® G2 assay (G2) and LensHooke® R10 assay (R10). The DNA fragmentation index was scored manually, and R10 slides were automatically determined by a LensHooke® X12 PRO semen analysis system (X12).
Results
We demonstrated significant improvements in total assay time (40 vs. 72 min, p < 0.001) and in the halo-cytological resolution using R10 compared to G2. Comparing the G2 and R10, DNA fragmentation index results demonstrated good agreement between the two methods (Spearman's rank correlation, rho = 0.8517, p < 0.0001). We introduced the integration of an auto-calculation system to diagnose sperm DNA fragmentation. X12 interpretation showed excellent agreement with manual interpretation (Spearman's rank correlation, rho = 0.9323, p < 0.0001), but had a low coefficient of variation compared to manual interpretation (4% for R10 by X12 vs. 19% for R10 by manual scoring vs. 25% for G2 by manual scoring). DNA fragmentation index was more correlated with total motility (coefficients = −0.3607, p < 0.0001) than sperm morphology and was positively associated with asthenozoospermic semen samples (p = 0.0001).
Conclusion
The R10 sperm chromatin dispersion assay combined with the X12 semen analysis system is faster, more objective, and provides standardization for sperm DNA fragmentation.
1 INTRODUCTION
Up to 15% of couples suffer from infertility worldwide, with male factors contributing to 50% of these cases.1-3 Phenotypes of reduced sperm motility, low sperm concentration, and morphological abnormalities are solely and/or jointly characterized in infertile males.2 However, an imperfect association between the basic semen parameter values, such as sperm concentration, motility, and morphology, and clinically assisted reproductive technology (ART) outcomes has been reported. This poses a challenge to diagnosing male fertility potential and predicting the success rate of ARTs.4 To overcome the limitations of basic semen examinations, the World Health Organization (WHO) suggested that sperm DNA fragmentation (SDF) be used as an extended parameter in their 6th edition of the Manuel for Human Semen Analysis guidelines (2021). SDF is associated with male infertility and significantly correlated to ART's success rate.5-9
Four main methods have been used to assess the integrity of sperm DNA in clinical/research laboratories: terminal deoxynucleotidyl transferase-mediated nick end-labeling (TUNEL), sperm chromatin structure assay (SCSA), single-cell gel electrophoresis (Comet) assay, and a sperm chromatin dispersion (SCD) test.10, 11 The results derived from TUNEL and SCSA show high sensitivity and reliability; however, these two assays highly depend on the instruments available, including fluorescent microscopy and flow cytometer, the training of the personnel, and the costs of the reagents. While the Comet assay is based on electrophoretic separation of DNA, where damaged DNA forms a comet-like pattern, there is no consensus on the cutoff value for an infertility diagnosis due to the high inter-observer variability. The SCD test is characterized by a halo of dispersed DNA loops after the removal of DNA-linked proteins in DNA-intact spermatozoa, whereas there are no or small halos seen in spermatozoa with DNA fragmentation.12 Conventional SCD assays involve preparing agarose gel, embedding sperm cells in an agarose mixture, denaturing DNA breaks with an acid solution, and disassociating DNA-binding proteins with a lysis buffer. Subsequently, sample slides are applied to Wright–Giemsa staining, and the sperm DNA status results are observed under a bright-field microscope. Although it has lower instrument demands, the assay requires sample preparation time and inter-observer variability in categorizing the characteristic halo size. These disadvantages hinder SCD use and prevent the establishment of validated cutoff values to identify male infertility.
Though several techniques have been applied to evaluating sperm chromatin integrity, there are few simple, rapid, and standardized methods to interpret sperm DNA fragmentation. This study aimed to (i) develop a novel SCD assay, the LensHooke® R10 test kit (R10) with a reduced assay time and better halo illustration; (ii) evaluate R10 reliability by comparing DNA fragmentation index (DFI) to the Halosperm® G2 assay (G2); (iii) improve technical efficiency and inter-observer variability by the LensHooke® X12 PRO (X12) system; and (iv) investigate the diagnostic value of R10 in male infertility by correlating DFI with basic semen parameters.
2 MATERIALS AND METHODS
2.1 Participant enrollment
We collected semen samples from men who sought ART at Lee Women's Hospital (Taichung, Taiwan) from May 2020 to November 2022. Men aged 20−60 years who provided signed informed consent were eligible to participate in this clinical study. Exclusion criteria included having azoospermia and/or retrograde ejaculation. The Institutional Review Board of Chung Shan Medical University approved this study (reference no. CS2-20012), and we obtained informed consent from all study participants. First, 303 semen samples were allocated for the pilot study to validate the reliability of the LensHooke® R10 assay compared with the conventional SCD method. Second, an additional 317 semen samples were prepared to apply R10 integrated with the LensHooke® X12 PRO semen analysis system.
2.2 Semen preparation
Semen samples were obtained from study subjects with an abstinence period of 2−5 days. Semen samples were collected in sterile cups by masturbat ion. After liquefaction, aliquots of the semen samples were subject to basic semen analysis using a CEROS device (Hamilton Thorne). Semen samples were analyzed for sperm concentration, motility, and morphology per the 2010 WHO guidelines.13 We followed the lower refer ence limits established by the 5th edition of the WHO guidelines: asthenozoospermic semen had total motility of less than 40% and teratozoospermic semen had a normal morphology rate of less than 4%.
2.3 The conventional SCD method
We analyzed sperm DNA fragmentation using a Halosperm® G2 kit (G2, Halotech DNA S.L., Spain) according to the manufacturer's instructions. Briefly, each sperm sample was diluted in PBS to obtain a 10 × 106/mL. A tube containing agarose gel was heated at 100°C for 5 min, and then semen samples were embedded into the agarose gel. Drops of the mixture were placed on the center of the sample well and the slides were incubated with the acid solution in the kit for 7 min at room temperature (RT) and then with the lysis solution for 20 min. Then, the slides were washed with distilled water for 5 min and dehydrated with 70% ethanol for 4 min. The slides were stained by two-step eosin and thiazine-based solutions for 7 min each and air-dried at room temperature. Air-dried slides were visualized under bright-field microscopy.
2.4 The LensHooke® R10 assay
2.4.1 General protocol
A modified SCD assay was provided as a LensHooke® R10 assay (R10, Bonraybio Co., Ltd, Taichung, Taiwan). Completed liquefied semen samples were diluted to a 10 × 106/mL. A solidified agarose gel was heated at 100°C for 1.5 min until the agarose was fully melted. We cooled 50 μL of melted agarose gel in Eppendorf tubes to 37°C for 5 min and then mixed with 25 μL semen aliquots and 25 μL 0.28 n hydrochloric acid (HCl) in an in-gel denature. Instantly, we placed a 25 μL aliquot of the admixture on a pretreated microscope slide covered with a 22 × 22 mm coverslip. We placed the slide in a 4°C fridge for 5 min to solidify the admixture. The coverslip was removed carefully and the slide was immersed with a lysis solution (2.5 m NaCl, 50 mM TCEP, 1% Triton X-100, 50 mM EDTA, 400 mM Tris, 4 m urea, and 0.05% sodium dodecyl sulfate (SDS) at a pH of 8.0) at RT for 10 min. The slide was washed with distilled water for 5 min and dehydrated with 95% methanol for 1 min. Finally, we stained the slide with a Wright–Giemsa stain solution and then air-dried it for further interpretations.
2.4.2 Testing protocol
Evaluating the effect of different lysis solutions
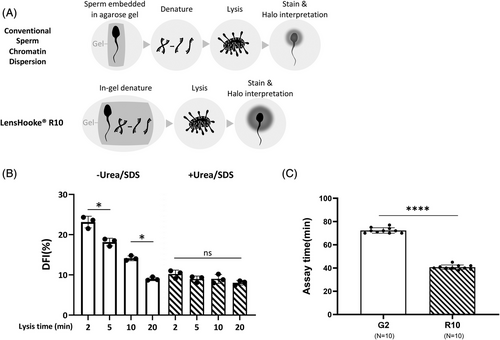
We conducted an R10 assay with two lysis solutions (I [2.5 m NaCl, 50 mM TCEP, 1% Triton X-100, 50 mM EDTA, and 400 mM Tris) and II [2.5 m NaCl, 50 mM TCEP, 1% Triton X-100, 50 mM EDTA, 400 mM Tris, 4 m urea, and 0.05% SDS]) to evaluate the effect of varying lysis constituents. We examined the DFI obtained after different lysis durations (2, 5, 10, and 20 min) for both solutions to determine if the addition of urea and SDS decreased the time required for lysis. Other procedures remained the same as the general protocol.
Evaluating the effect of different acid denaturation levels
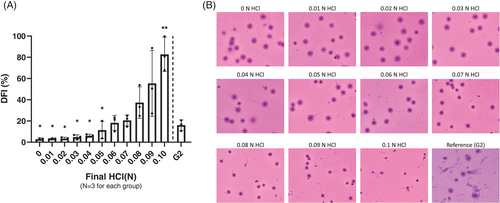
R10 slides were incubated with different concentrations of HCl to determine the optimum concentration of HCl. We used final concentrations of 0, 0.01, 0.02, 0.03, 0.04, 0.05, 0.06, 0.07, 0.08, 0.09, and 0.1 n HCl. The following procedures were the same as the general protocol.
Manual interpretation of the DNA fragmentation index (DFI)
We observed the air-dried slides under a 20× bright-field microscope (Olympus BX53). A minimum of 500 spermatozoa were scored per test sample. A large halo had a width similar to or higher than the diameter of the sperm core. A medium halo had a width between one-third the diameter of the sperm core and the total sperm core. Large and medium halos were classified as non-fragmented DNA. Sperm with a small halo surrounding the sperm core or lacking a halo had fragmented DNA. The DFI was the percentage of sperm with fragmented DNA.
2.5 Automated interpretation of the DFI
Automated DFI analysis was performed using the LensHooke® X12 PRO semen analysis system (X12, Bonraybio Co., Ltd, Taichung, Taiwan). The identity of human spermatozoa is automatically verified based on artificial intelligence (AI). Deep learning algorithms recognize the boundary between the sperm core and the halo and interpret the halo-to-core ratio with standardization. X12 technology is a built-in autofocus optical lens and automatic XY table for multi-field examination that can detect the sperm count of at least 1500 spermatozoa at one time. Combined with an auto-calculation system, various portions of the halo can be interpreted simultaneously and the classifier to determine if spermatozoa has fragmented DNA can be completed in 5 min.
2.6 Induction of DNA fragmentation by DNase I pretreatment
As a positive control, select semen samples (10 × 106/mL) were incubated with 20 U/mL of deoxyribonuclease I (DNase I) (Zymo Research Corporation, Irvine, CA, USA) in 0.1% Triton X-100 (Sigma Aldrich, St. Louis, MO, USA) prepared in 0.01 m PBS at 37°C for 1 h. The DNase I-pretreated semen samples were then subjected to the modified SCD assay as described above.
2.7 Determining inter-observer variability
We split 10 semen samples from 10 donors into two aliquots and analyzed each aliquot by G2 and R10 assays. The SCD slide (G2 and R10) was manually scored by four different experienced technicians. The R10 slide was automatically determined by an X12 semen analysis system by the same four technicians. Inter-observer variability was indicated based on the intra-rater correlation coefficient (ICC) and the average coefficient of variation (CV).
2.8 Statistical analysis
After testing for a normal distribution using the Shapiro–Wilk test, we analyzed the DFI results for different lysis conditions and different HCl concentrations by paired t-test. We performed the Spearman's rank correlation (rho) to evaluate the correlations between R10 and G2 and between manual interpretation and automated X12. We used a Bland–Altman plot analysis to evaluate the agreement between the different techniques (R10 vs. G2) and interpretations (manual interpretation vs. X12). The DFI correlation derived from the X12 interpretation with two sperm characteristics, motility, and morphology was analyzed by multivariable linear regression. We calculated the coefficients (β) and 95% confidence intervals (95% CI) for the model variables. We used the Mann–Whitney U test to compare the DFIs derived from normozoospermic, asthenozoospermic, and teratozoospermic specimens. We used Prism software, version 6.01 (GraphPad Software, Inc.) for the statistical analysis. A p-value less than 0.05 was considered statistically significant.
3 RESULTS
3.1 The optimized sperm chromatin dispersion protocol provided by R10 in the G2 comparison
Compared to the conventional SCD procedure, we combined embedding the semen sample and denaturing the acid into one step called in-gel denaturation (Figure 1A). We wanted to determine if supplementing 4 m of urea and 0.05% SDS can facilitate lysis. Figure 1B shows that with the DFI change, it took up to 20 min of lysis to reach stability in the absence of urea and SDS, whereas consistent DFI results were observed after 2 min of lysis with urea and SDS. Figure 1C shows that the R10 assay time was significantly shorter than that achieved using the standard SCD G2 method (40.7 ± 1.9 vs. 72.3 ± 2.2 min, respectively, p < 0.001). Table S1 shows a comparison of the technical steps and assay time for G2 and R10.
3.2 Improved halo determination by mild hydrochloric acid denaturation
Fully liquefied normozoospermic semen samples were split into 12 aliquots. Each aliquot was treated with a different final concentration of HCl (0, 0.01, 0.02, 0.03, 0.04, 0.05, 0.06, 0.07, 0.08, 0.09, and 0.1 n). We analyzed an aliquot with the G2 assay as the control. The DFI values obtained at 0.06, 0.07, 0.08, and 0.09 n HCl were in line with the DFI from G2 and exhibited a clear and recognizable ratio between the sperm core and chromatin dispersion. There was a barely detected halo in the 0.1 n group, resulting in significantly high levels of DFI (Figure 2B). We assessed improvements in halo illustration and DFI interpretation by DNA fragmented specimens induced by DNase I-degradation (Figure S1).
3.3 High correlation between R10 and G2
We analyzed each semen sample by G2 and R10 assays and determined the DFI results by manual interpretation. A significantly high Spearman's rank correlation (r = 0.8517, p < 0.0001) indicated a good correlation between the DFI derived from G2 and R10. The Bland–Altman plot demonstrated good agreement between R10 and G2 (Figure 3).

3.4 High agreement R10-DFI between the manual interpretation and the automated X12 semen analysis system
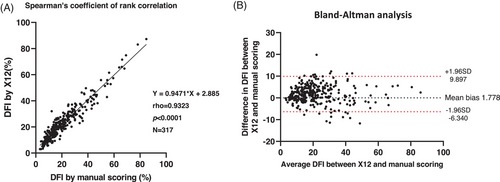
We analyzed R10 slides by manual interpretation and automated X12. The strong correlation between the two interpretations is demonstrated in Figure 4 (Spearman's rank correlation = 0.9323, p < 0.0001). In the comparison of inter-observer variability between the three methods (G2 by manual scoring, R10 by manual scoring, and R10 by X12), R10 by X12 produced a CV of 4%, which was lower than the 25% for G2 and 19% for R10 by manual scoring (Table 1).
| SCD assay | DFI Interpretation | n | DFI (%), mean ± SD | DFI (%), median | DFI (%) range | ICC | CV (%) |
|---|---|---|---|---|---|---|---|
| LensHooke® R10 | Manual | 10 | 23.2 ± 12.1 | 21 | 5–46 | 0.9810 | 19 |
| LensHooke® R10 | LensHooke® X12 Pro | 10 | 24.9 ± 11.0 | 21 | 9–42 | 0.9979 | 4 |
| Halosperm® G2 | Manual | 10 | 19.5 ± 11.1 | 19 | 4–49 | 0.9695 | 25 |
- Abbreviations: CV, coefficient of variation; DFI, DNA fragmentation index; ICC, inter-class correlation coefficient; IQR, interquartile range; SCD, sperm chromatin dispersion; SD, standard deviation.
3.5 Correlation between DFI and semen parameters using the R10 and X12 analyses
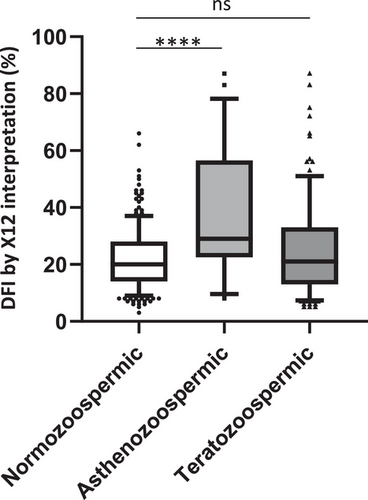
We wanted to reveal the DFI correlation (R10 by X12) for semen total motility and normal morphology. Multivariate linear regression showed a significant DFI correlation with total motility (β = −0.3607, 95% CI: −0.4399 to −0.2815, p < 0.0001), whereas there was no significant correlation between DFI and normal morphology (β = 0.04728, 95% CI: −0.3539 to 0.4485, p = 0.8168) (Table 2). Asthenozoospermic samples (total motility <40%) had a significantly higher DFI (median: 29%) compared to normozoospermic samples (median: 20, p = 0.0001). There was no difference between the teratozoospermic (median: 21%) and normal samples (Figure 5).
| Parameters | Coefficients (95% CI) | p-Value |
|---|---|---|
| Total motility | −0.3607 (−0.4399 to −0.2815) | <0.0001 |
| Normal morphology | 0.0472 (−0.3539 to 0.4485) | 0.8168 |
- Note: We used multivariate linear regression analysis.
- Abbreviations: CI, confident interval; DFI, DNA fragmentation index.
4 DISCUSSION
Here, we propose a modified SCD assay called the LensHooke® R10 test kit. By incorporating the in-gel denaturation technique, a novel detergent formula, and the optimum HCl concentration, R10 has a reduced operational procedure and assay time and clearer halo illustration.
The conventional lysis procedure is time-consuming and too unstable for long-term storage and use. It requires at least 20 min of lysis to fully dissociate the highly compacted chromatin–protamine complex, needed for spermatozoa to efficiently carry genetic material.14, 15 Its instability arises from the presence of dithiothreitol (DTT) in the lysis buffer. DTT has poor stability in an aqueous solution at room temperature, which poses a challenge for the long-term use of the SCD assay. To overcome these disadvantages in the current sperm lysis procedure, we first tried to optimize the regular lysis solution constituents. SDS and urea supplementation reduced the processing time to 2 min compared to 20 min without SDS and urea (Figure 1B). We replaced DTT with TCEP, which is more resistant to oxidation and remains stable over a wide pH range (1.5–8.5). The assay efficiency and R10 stability were considerably improved due to SDS/urea supplementation and the replacement of DTT with TCEP.
Many computer-assisted semen analysis systems have been developed to overcome the cumbersome semen analysis procedure, from the semi-automated sperm tracking system (computer-assisted sperm analysis) in 199316 to the novel artificial intelligence optical microscopic (AIOM) based technology (LensHooke® X1 PRO) in 2019.17 However, these systems are limited to basic semen parameters. Here, we demonstrated for the first time that AIOM-based technology can be incorporated into advanced semen analysis, and we proved X12's test accuracy by the high correlation with manual interpretation (Spearman's rank correlation coefficient = 0.9323, slope = 0.9471).
To compare the inter-observer variability between the three methods (G2 by manual scoring, R10 by manual scoring, R10 by X12), the percentage CV was minimized in the R10 by X12 group (4%), therefore ensuring reproducibility. G2 by manual scoring presented the highest CV (25%), indicating the limitations of the conventional SCD assay due to the complicated procedure and manual scoring. Even though the average and median DFI between the three methods were not different, the population distribution was slightly different in G2 by manual scoring group (Figure S2). This suggests that conventional SCD has poor test reliability due to its complicated procedure. In conclusion, the automated X12 system prevents individual variations and allows for the objective, standardized evaluation of sperm DNA fragmentation.
Besides improving the sperm DNA fragmentation analysis procedure, X12 has elucidated the etiology of sperm DNA fragmentation. In previous studies, the association of sperm DNA fragmentation with other semen impairments was inconclusive. Some research has suggested that DFI has a negative correlation with sperm count, motility, and morphology.18-20 Some studies indicated that sperm DNA damage is related to poor motility rather than other abnormal semen characteristics.21, 22 In the present study, we found that DFI was more associated with total motility (β = −0.3607, p < 0.0001) than normal morphology based on multivariate linear regression analysis (Table 2). A significantly high DFI was found in asthenozoospermic samples (29%, p < 0.0001), but not teratozoospermic samples (21%) (Figure 5). However, caution should be used in interpreting these results, as this study had a small sample size. The asthenozoospermic samples in our cohort were characterized by an abnormal morphology (the median normal morphology rate is 1%, interquartile range: 0%−1%) as shown in Table S2. Thus, a sperm morphology defect may not be a dominant contributing factor to sperm DNA fragmentation, but may exert a secondary adverse effect in combination with motility impairment.
As this is a laboratory pilot study, the predictive value of DFI associated with ART clinical outcomes is unavailable. Nevertheless, we attempted to evaluate R10's diagnostic performance to determine if it produces the same diagnostic results as G2 by applying a 30% cutoff for pregnancy and/or delivery success, as suggested by the G2 manufacturer and published meta-analyses.23 The results based on a cohort of 303 cases showed that R10 produced near-identical diagnostic results as G2 (sensitivity: 87.7%, specificity: 92.9%, accuracy: 91.8%), indicating that the two methods have similar diagnostic outcomes.
In conclusion, R10 is applicable for manual interpretation and AIOM-based auto-calculation. It should be combined with X12 due to its reduced time, objectivity, and reproducibility for DFI interpretation. The newly developed automated semen analysis system increases SCD usability in clinics and provides a standardized diagnostic procedure for male infertility.
AUTHOR CONTRIBUTIONS
Cheng-Teng Hsu, Chun-I. Lee, and Maw-Sheng Lee conceptualized and designed all the experiments. Chun-Chia Huang, Hui-Chen Chang, and Li-Sheng Chang collected samples and curated data. Li-Sheng Chang and Tse-En Wang conducted all the experiments and statistical anslyses. Tse-En Wang constructed, wrote, and revised the manuscript.
ACKNOWLEDGMENTS
We wish to thank Dr. Michael Eisenberg (Stanford Health Care) for his intellectual contribution and English editing services.
Open Research
DATA AVAILABILITY STATEMENT
Data regarding any of the subjects in this study have not been previously published unless otherwise specified. Data are available to the journal editors upon request.


