Artificial neural network identifies nonsteroidal anti-inflammatory drugs exacerbated respiratory disease (N-ERD) cohort
Abstract
Background
To date, there has been no reliable in vitro test to either diagnose or differentiate nonsteroidal anti-inflammatory drug (NSAID)–exacerbated respiratory disease (N-ERD). The aim of the present study was to develop and validate an artificial neural network (ANN) for the prediction of N-ERD in patients with asthma.
Methods
This study used a prospective database of patients with N-ERD (n = 121) and aspirin-tolerant (n = 82) who underwent aspirin challenge from May 2014 to May 2018. Eighteen parameters, including clinical characteristics, inflammatory phenotypes based on sputum cells, as well as eicosanoid levels in induced sputum supernatant (ISS) and urine were extracted for the ANN.
Results
The validation sensitivity of ANN was 94.12% (80.32%-99.28%), specificity was 73.08% (52.21%-88.43%), and accuracy was 85.00% (77.43%-92.90%) for the prediction of N-ERD. The area under the receiver operating curve was 0.83 (0.71-0.90).
Conclusions
The designed ANN model seems to have powerful prediction capabilities to provide diagnosis of N-ERD. Although it cannot replace the gold-standard aspirin challenge test, the implementation of the ANN might provide an added value for identification of patients with N-ERD. External validation in a large cohort is needed to confirm our results.
Graphical Abstract
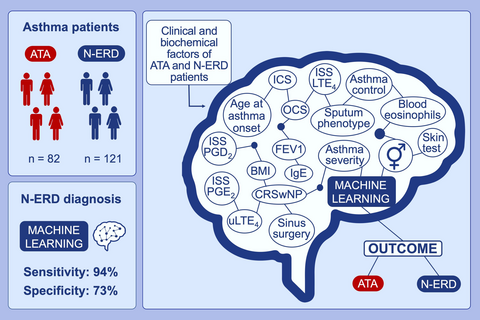
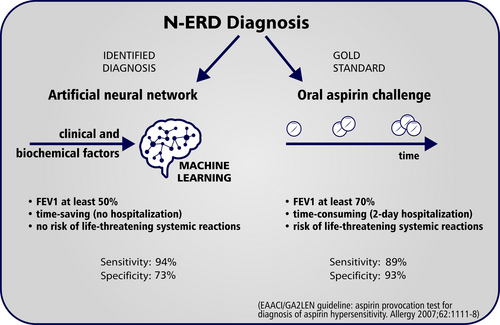
Artificial neural network based on a set of clinical and biochemical parameters is able to stratify N-ERD patients among asthmatic population. The sensitivity of the present artificial neural network is 94.12% and specificity is 73.08% for the prediction of N-ERD. Artificial neural network could become a screening tool and allow to quickly identify patients with a high suspicion of N-ERD
Abbreviations
-
- ANN
-
- artificial neural network
-
- ATA
-
- aspirin-tolerant asthma
-
- CRSwNP
-
- chronic rhinosinusitis with nasal polyposis
-
- IS
-
- induced sputum
-
- ISS
-
- induced sputum supernatant
-
- LTE4
-
- leukotriene E4
-
- N-ERD
-
- nonsteroidal anti-inflammatory drugs (NSAIDs)–exacerbated respiratory disease
-
- PGD2
-
- prostaglandin D2
-
- PGE2
-
- prostaglandin E2
-
- SVM
-
- support vector machine
1 INTRODUCTION
Nonsteroidal anti-inflammatory drug (NSAID)–exacerbated respiratory disease (N-ERD) is characterized by the presence of asthma, chronic rhinosinusitis with nasal polyposis (CRSwNP), and acute respiratory reactions precipitated by aspirin (acetylsalicylic acid) or other NSAIDs. Previous studies have demonstrated that patients with N-ERD experience a more severe course of asthma, require higher doses of corticosteroids to control the disease, and suffer from a particularly aggressive polypoid hypertrophy of the sinus mucosa compared with individuals without N-ERD.1, 2 The prevalence of N-ERD is about 7% in adult patients with asthma and twice as high in those with severe asthma.3
N-ERD is a heterogeneous disease, usually associated with eosinophilic inflammation in the airways, although neutrophilic, mixed, or paucigranulocytic cell phenotypes based on induced sputum (IS) can also be found in some patients.1, 4 Another key feature of N-ERD is the dysregulation of arachidonic acid metabolism pathways,1, 5 including a decrease in anti-inflammatory prostaglandin E2 (PGE2) levels and an overproduction of proinflammatory eicosanoids such as cysteinyl leukotrienes and prostaglandin D2 (PGD2). The imbalance of these lipid mediators has been observed in various body fluids, including urine and IS supernatant (ISS).4-6
Despite a relatively broad knowledge on the pathophysiology of N-ERD,1 only a few in vitro diagnostic tests have been proposed. The investigated parameters included basophil activation7; 15-hydroxyeicosatetraenoic acid generation in peripheral blood leukocytes8; plasma eosinophil–derived neurotoxin levels9; serum periostin levels10; serum leukotriene E4 (LTE4) levels and the ratio of LTE4 to prostaglandin F2α11; and urinary LTE4 levels.12 Unfortunately, none of these parameters can be recommended for the purpose of diagnosing N-ERD. In clinical practice, the most reliable diagnostic method is an intranasal, bronchial, and oral aspirin provocation test, the latter being the gold standard.13-15 However, oral aspirin challenge is time consuming and carries a risk of severe hypersensitivity reactions. Moreover, bronchial and oral aspirin challenge tests are difficult to perform in individuals with uncontrolled asthma whose forced expiratory volume in the first second (FEV1) is below 70% of the predicted value.14, 15 Thus, it can only be performed in a limited number of patients. Therefore, safe methods that could facilitate the diagnosis of N-ERD are needed. Cahill et al suggested that an informatics algorithm applied to electronic health records could help identify patients with N-ERD.16
The most common machine learning techniques are artificial neural networks (ANNs) and support vector machines (SVMs). The ANN is a type of computer software inspired by biological neurons. The main concept of the ANN is a learning ability to recognize complex patterns on the basis of imputed information (variables and outcomes), which can then be used for solving similar problems in the future.17 Machine learning techniques are gaining popularity in the field of medicine18-20 because they are noninvasive, easy to implement, and cost-effective. The aim of the present study was to design the first artificially intelligent program based on clinical characteristics, sputum cell phenotypes, and eicosanoid levels in ISS and urine, which could predict the diagnosis of N-ERD. This approach is not burdensome for patients, and sputum induction is now almost a routine procedure in specialized clinical centers, where treatment of asthma is tailored to individual patient needs based on sputum cell phenotypes.
2 MATERIAL AND METHODS
2.1 Data sets
This study used a prospective database of patients with N-ERD and aspirin-tolerant asthma (ATA) who were recruited from among patients with asthma treated at the Andrzej Szczeklik Department of Internal Medicine, Jagiellonian University Medical College, Cracow, Poland. Demographic data of patients as well as blood, IS, and urine samples were collected from all study participants between May 2014 and May 2018 on 3 different occasions (3 grants): (a) 1 day before bronchial aspirin challenge4; (b) 1.5 hours before diagnostic oral aspirin challenge21; and (c) 1 day before oral aspirin challenge conducted because of aspirin desensitization.22 None of the included patients underwent a sinus surgery within 3 months preceding the aspirin challenge test. The study group included 121 patients with N-ERD and 82 patients with ATA. The diagnosis of aspirin hypersensitivity was established based on the guidelines of the European Academy of Allergy and Clinical Immunology (EAACI) and Global Allergy and Asthma European Network (GA2LEN).14 None of the patients with asthma had been treated with leukotriene modifiers 6 weeks prior to the study or with other medications except inhaled corticosteroids, small doses of oral corticosteroids (not exceeding 10 mg of prednisolone or equivalent) and long-acting beta2-agonists. The clinical characteristics of the patients are presented in Table 1.
| Parameter | N-ERD (n = 121) | ATA (n = 82) | P |
|---|---|---|---|
| Age (years) | 49 (39-55) | 48 (38-57) | .97 |
| Sex (female/male) (% of female) | 86/35 (71.1%) | 45/37 (54.9%) | .02 |
| Asthma duration (years) | 10 (6-17) | 11 (5-20) | .38 |
| Age at asthma onset >12 years (yes/no) (% of yes) | 119/2 (98.3%) | 69/13 (84.1%) | <.001 |
| ACT score | 23 (18-25) | 23 (22-25) | .07 |
| Present level of asthma control (well-controlled/partially controlled/uncontrolled) | 48/46/7 (39.7%/38%/22.3%) | 45/25/12 (54.9%/30.5%/14.6%) | .09 |
| Baseline FEV1 (% predicted) | 89.9 (81.2-100.2) | 97.4 (84.4-106.6) | .02 |
| ICS (yes/no) (% of yes) | 108/13 (89.3%) | 63/19 (76.8%) | .02 |
| Dose of ICS (µg/d fluticasone eq) | 400 (100-1000) | 400 (100-1000) | .32 |
| OCS (yes/no) | 8/113 (6.6%) | 7/75 (8.5%) | .61 |
| CRSwNP (yes/no) (% of yes) | 121/0 (100%) | 45/37 (54.9%) | <.001 |
| History of sinonasal surgery (yes/no) (% of yes) | 112/9 (92.6%) | 41/41 (50%) | <.001 |
| BMI > 30 kg/m2 (yes/no) (% of yes) | 29/92 (24%) | 17/65 (20.7%) | .59 |
|
Asthma severity (mild, moderate, and severe) |
13/48/60 (10.7%/39.7%/49.6%) | 19/31/32 (23.2%/37.8%/39.0%) | 0.11 |
| Atopy (yes/no) (% of yes) | 79/42 (65.3%) | 61/21 (74.4%) | .22 |
| Blood eosinophils (mm3) | 353 (212-612) | 293 (150-500) | .04 |
| IS phenotype (eosinophilic, neutrophilic, paucigranulocytic, and mixed) | 61/18/24/18 (50.4%/14.9%/19.8%/14.9%) | 16/25/27/14 (19.5%/30.5%/32.9%/17.1%) | <.001 |
| ISS PGD2 | 43.6 (21.2-95.6) | 24.0 (13.9-62.3) | .002 |
| ISS PGE2 | 43.6 (21.2-95.6) | 51.5 (36.9-90.3) | .337 |
| ISS LTE4 | 58.5 (17.9-167.7) | 17.5 (6.7-43.6) | <.001 |
| Urinary LTE4 | 1063.0 (441.5-2635) | 327.0 (119.0-758.0) | <.001 |
Note
- Asthma control and severity based on GINA 2018 guidelines. Atopy was defined as serum IgE level ≥100 IU/mL or positive skin prick tests, or both.
- Abbreviations: ACT, asthma control test; ATA, aspirin-tolerant asthma; BMI, body mass index; CRSwNP, chronic rhinosinusitis with nasal polyposis; FEV1, forced expiratory volume in the first second; ICS, inhaled corticosteroid; IgE, immunoglobulin E; IS, induced sputum; ISS, induced sputum supernatant; LTE4, leukotriene E4; N-ERD, nonsteroidal anti-inflammatory drug–exacerbated respiratory disease; OCS, oral corticosteroid; PGD2, prostaglandin D2; PGE2, prostaglandin E2.
- A P value of less than .05 was considered significant (in bold type).
The primary outcome was the occurrence of N-ERD. We reviewed clinical data of patients, including sex, age at asthma onset, body mass index, Asthma Control Test (ACT) results, asthma severity (according to the 2018 Global Initiative for Asthma guidelines), inhaled and oral corticosteroid treatment, the presence of CRSwNP (diagnosed on the basis of computed tomography scans and ear, nose, and throat examination), a history of sinonasal surgery, FEV1 value, and the results of skin prick tests to aeroallergens. Laboratory tests included blood eosinophil count, total serum immunoglobulin E (IgE) levels, inflammatory phenotypes based on IS cells, ISS PGD2, PGE2, and LTE4 levels, as well as urinary LTE4 levels. The parameters used in the machine learning models are summarized in machine learning is shown in Table 2.
| Parameter | Input type | Input range |
|---|---|---|
| Sex | Qualitative | Female or male |
| Age at asthma onset | Qualitative | <12 years or ≥12 years |
| BMI | Qualitative | <30 or ≥30 |
| Asthma control | Qualitative | Well-controlled, partially controlled, or uncontrolled |
| Asthma severity | Qualitative | Mild, moderate, or severe |
| ICS | Qualitative | Yes or no |
| OCS | Qualitative | Yes or no |
| CRSwNP | Qualitative | Yes or no |
| History of sinonasal surgery | Qualitative | Yes or no |
| FEV1 | Qualitative | ≤80% or >80% |
| Skin prick tests | Qualitative | Positive or negative |
| Total serum IgE | Qualitative | <100 IU/mL or ≥100 IU/mL |
| Blood eosinophils | Qualitative | <400/μL or ≥400/μL |
| IS phenotype | Qualitative | Eosinophilic, neutrophilic, paucigranulocytic, mixed |
| log ISS PGD2 | Quantitative | 3.57 ± 1.02; 3.55 (2.79-4.36) |
| log ISS PGE2 | Quantitative | 4.17 ± 0.75; 4.01 (3.71-4.62) |
| log ISS LTE4 | Quantitative | 3.50 ± 1.53; 3.43 (2.40-4.75) |
| Urinary LTE4 | Quantitative | 6.52 ± 1.55; 6.44 (5.48-7.65) |
Note
- Asthma control and severity based on 2018 GINA guidelines. Positive skin tests were defined as a positive skin prick test to at least 1 aeroallergen.
- Abbreviations: ACT, asthma control test; BMI, body mass index; CRSwNP, chronic rhinosinusitis with nasal polyposis; FEV1, forced expiratory volume in the first second; ICS, inhaled corticosteroids; IgE, immunoglobulin E; IS, induced sputum; ISS, induced sputum supernatant; LTE4, leukotriene E4; OCS, oral corticosteroids; PGD2, prostaglandin D2; PGE2, prostaglandin E2; LTE4, leukotriene E4.
Each of the studies providing data for the presented work was approved by Jagiellonian University Ethics Committee, and written informed consent was obtained from all study participants.
2.2 Induced sputum
Induced sputum samples were collected according to the European Respiratory Society recommendations.23 The resulting material was processed to obtain cytospin slides for a differential cell count and a supernatant for eicosanoid evaluation.
Four cell phenotypes based on IS examination were distinguished.4, 21 The ISS levels of eicosanoids were measured by gas chromatography/mass spectrometry for PGD2 and PGE2 and by high-performance liquid chromatography/tandem mass spectrometry for LTE4. The results were expressed in picograms per milliliter [pg/mL]. Analytical details were presented elsewhere.4, 21
2.3 Urine
Morning urine samples were collected after a 2-hour accumulation of urine in the bladder. Urinary LTE4 excretion was assessed with an enzyme-linked immunosorbent assay (Cayman Chemical Co.). The results were recalculated in picograms per mg of creatinine.
2.4 Machine learning implementation
We used the ANN and SVM to predict the occurrence of N-ERD among asthma patients on the basis of 18 clinical and biochemical parameters. The data set (n = 203) was randomly divided into training (n = 143) and validating (n = 60) samples using a random numbers generator. The interval [0, 1] was divided into 2 subintervals: [0, 0.7] and [0.7, 1]. The cases were classified to learning and validation samples depending on which subinterval the generated random number was assigned to. We used an external selection process of training and validation samples to compare the performance of the ANN and SVM models using the same training and validation sets. All patients with N-ERD and ATA included in the analysis had the diagnosis of aspirin hypersensitivity or tolerance previously established on the basis of medical history and aspirin challenge test according to the EAACI/GA2LEN guidelines.14 Additionally, we performed separate analyses excluding cell phenotypes based on IS, ISS levels of PGD2, PGE2 and LTE4, as well as urinary LTE4.
2.5 Artificial neural network
An ANN is based on input variables (input layer), which are integrated in a nonlinear process (hidden layer) to finally generate output results (output layer). The ANN model is initially fitted on a training sample, which comprises data records used to train the neural network. An independent set of data named the testing sample (or holdout sample) is used to set the architecture of the ANN and prevent overtraining. Finally, another set of data records, called the validating sample, is used to assess the final neural network. The errors of the validating sample give an “honest” estimate of the predictive ability of the ANN because the validating cases are not used to build the model.17
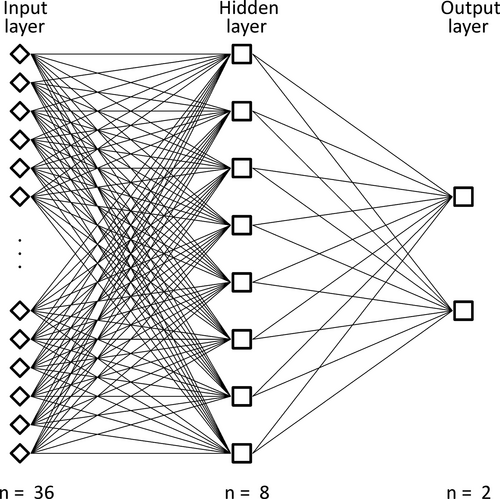
We used 143 cases (70.4%) of data (87 N-ERD and 56 ATA cases) as the training sample, among which 23 cases were separated as the testing sample. Then, 60 cases (29.6%) of data (34 N-ERD and 26 ATA cases) were used as the validation sample. We included 18 variables (14 qualitative and 4 quantitative; Table 2) in the input layer, which consisted of 36 neurons. We attempted to determine the best performance using different (1–5) numbers of ANN hidden layers and found that the best performance in our ANN was achieved with a single hidden layer constructed with eight neurons (Figure 1). The ANN was trained using a backpropagation algorithm. The input quantitative variables were previously logarithmically normalized. The activation function was logistic in the hidden layer and linear in the output layer. The higher output number of our ANN indicated a higher probability of N-ERD. In order to convert the fractional N-ERD prediction value into a binary N-ERD status (yes or no), the algorithm introduced a cutoff value above which our ANN would predict a “yes” N-ERD status. Once the training was complete, the algorithm tested a number of cutoff values to establish the sensitivity and specificity for the prediction of N-ERD. When the cutoff value was selected from the training data set, the same value was then used on the validation set, and, similarly, the sensitivity and specificity were computed.
2.6 Support vector machine
A SVM performs classification of tasks by constructing nonlinear decision boundaries. The machine conceptually implements the idea that input vectors are nonlinearly mapped to a very high dimensional feature space. A linear decision surface is constructed in this feature space. Owing to the nature of the feature space in which these boundaries are found, the SVM can exhibit a large degree of flexibility in handling classification and regression tasks of varied complexities. There are several types of SVM models including linear, polynomial, radial basic function, and sigmoid.24 We checked all of these models and finally chose the radial basic function.
2.7 Multiple logistic regression
Additionally, for statistical comparison we used a MLR, which is a statistical method in which two or more measurement variables are taken into consideration simultaneously to predict a value of one nominal (binary) variable. Since the explanatory variables (nominal and continuous) were dependent, we found the best model according to Akaike information criterion (AIC). The optimal MLR model could also provide information about the most important discriminant variables.25
2.8 Statistical analysis
All calculations were performed with Dell Statistica v. 13 (data analysis software system). Categorical variables were presented as numbers and percentages, and analyzed using the Fisher exact test. The Freeman-Halton extension of the Fisher exact test for 2 rows by 3 columns contingency table was used for small samples. Continuous variables were expressed as mean with standard deviation (SD) or median with lower and upper quartiles. A P value of less than .05 (type I error) was considered significant. Data from the test cohort were implemented as an input into the ANN, SVM, and multiple logistic regression (MLR). The results were recorded and compared with a receiver operating characteristics (ROC) curve analysis. The predictive value of N-ERD was compared using an area under the ROC curve (AUROC).
3 RESULTS
3.1 Artificial neural network
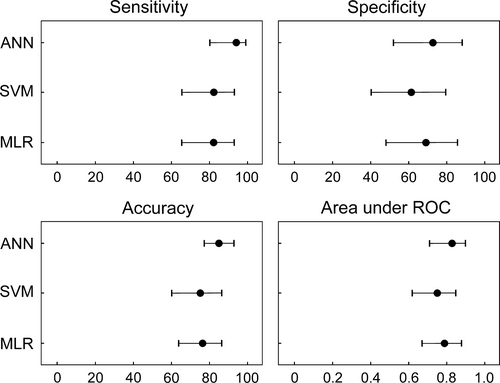
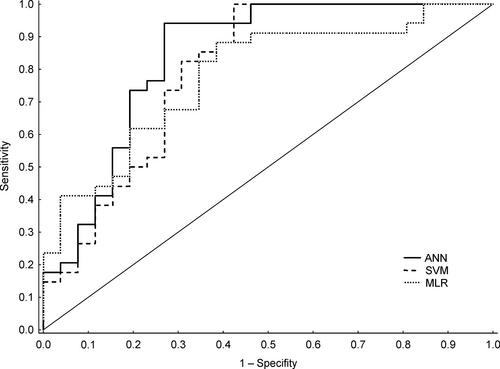
The training sensitivity (with 95% CI) of the ANN for the prediction of N-ERD was 95.40% (88.64%-98.73%); specificity, 87.50% (75.93%-94.82%); and accuracy, 92.31% (86.65%-96.10%). The validation sensitivity was comparable and reached 94.12% (80.32%-99.28%); specificity, 73.08% (52.21%-88.43%); and accuracy, 85.00% (77.43%-92.90%). The AUROC was 0.85 (0.73-0.93) and 0.83 (0.71-0.90) for training and validation, respectively (Figures 2 and 3). The diagnostic odds ratio (with 95% CI) was 145.25 (40.46-278.3) and 43.43 (8.17-521.48) for training and validation, respectively (Table 3).
| AUROC (95% CI) | P | Sensitivity (%) | Specificity (%) | DOR (95% CI) | |
|---|---|---|---|---|---|
| ANN | 0.83 (0.71-0.91) | <.001 | 94.12 | 73.08 | 43.43 (8.17-521.49) |
| SVM | 0.75 (0.62-0.85) | <.001 | 82.35 | 61.54 | 7.47 (4.08-13.66) |
| MLR | 0.79 (0.67-0.88) | <.001 | 82.35 | 69.23 | 6.14 (1.98-19.04) |
- Abbreviations: AUROC, area under the receiver operating characteristic curve; CI, confidence interval; DOR, diagnostic odds ratio.
3.2 Support vector machine
The training sensitivity (with 95% CI) of the SVM for the prediction of N-ERD was 100% (95.85%-100%); specificity, 75.00% (61.63%-85.61%); and accuracy, 90.21% (84.12%-94.54%). The validation sensitivity was 82.35% (65.47%-93.24%); specificity, 61.54% (40.57%-79.77%); and accuracy, 75.33% (60.34%-83.93%). The AUROC was 0.82 (0.70-0.91) and 0.75 (0.62-0.85) for training and validation, respectively (Figures 2 and 3). The diagnostic odds ratio was 275.00 (15.35-4925.67) and 7.47 (4.08-13.66) for training and validation, respectively (Table 3).
3.3 Multiple logistic regression
The training sensitivity (with 95% CI) of the MLR for the prediction of N-ERD was 93.10% (85.59%-97.43%); specificity, 64.29% (50.36%-76.64%); and accuracy, 81.82% (74.51%-87.77%). The validation sensitivity was 82.35% (65.47%-93.24%); specificity, 69.23% (48.21%-85.67%); and accuracy, 76.67% (63.96%-86.62%). The AUROC was 0.85 (0.73-0.93) and 0.79 (0.67-0.88) for training and validation, respectively (Figures 2 and 3). The diagnostic odds ratio was 19.05 (7.42-48.91) and 6.14 (1.98-19.04) for training and validation, respectively (Table 3).
3.4 Artificial neural network, support vector machine, and multiple logistic regression—additional analyses
3.4.1 Clinical, blood, ISS eicosanoid, and urine data (excluding phenotype based on IS)
The validation sensitivity (with 95% CI) of the ANN for the prediction of N-ERD was 97.06% (84.67%-99.73%); specificity, 57.69% (36.92%-76.65%); and accuracy, 80.00% (67.67%-89.22%). The AUROC was 0.82 (0.70-0.94). For the SVM, the validation sensitivity was 81.25% (63.56%-92.79%); specificity, 61.54% (40.57%-79.77%); and accuracy, 72.41% (59.10%-83.34%). The AUROC was 0.74 (0.62-0.86). For the MLR, the validation sensitivity was 76.32% (61.62%-91.02%); specificity, 67.45% (46.76%-88.14%); and accuracy, 70.21% (56.13%-82.43%). The AUROC was 0.70 (0.57-0.83).
3.4.2 Clinical, blood, urine, and sputum cell phenotype data (excluding ISS eicosanoids)
The validation sensitivity (with 95% CI) of the ANN for the prediction of N-ERD was 96.88% (83.78%-99.92%); specificity, 61.54% (40.57%-79.77%); and accuracy, 81.03% (68.59%-90.13%). The AUROC was 0.79 (0.70-0.88). For the SVM, the validation sensitivity was 87.50% (71.01%-96.49%); specificity, 61.54% (40.57%-79.77%); and accuracy, 75.86% (62.83%-86.13%). The AUROC was 0.74 (0.63-0.81). For the MLR, the validation sensitivity was 81.32% (69.76%-92.31%); specificity, 68.17% (57.17%-79.32%); and accuracy, 75.32% (66.72%-84.45%). The AUROC was 0.76 (0.66-0.86).
3.4.3 Clinical, blood, and urine data (excluding all IS parameters)
The validation sensitivity (with 95% CI) of the ANN for the prediction of N-ERD was 96.88% (83.78%-99.92%); specificity, 57.69% (36.92%-76.65%); and accuracy, 79.31% (66.65%-88.83%). The AUROC was 0.78 (0.70-0.86). For the SVM, the validation sensitivity was 89.47% (75.20%-97.06%); specificity, 54.55% (32.21%-75.61%); and accuracy, 76.67% (63.96%-86.62%). The AUROC was 0.74 (0.63-0.81). For the MLR, the validation sensitivity was 80.23% (68.30%-90.53%); specificity, 68.17% (57.17%-79.32%); and accuracy, 74.34% (65.86%-83.14%). The AUROC was 0.75 (0.66-0.84).
3.4.4 Clinical, blood, and sputum data (excluding urinary LTE4)
The validation sensitivity (with 95% CI) of the ANN for the prediction of N-ERD was 97.06% (89.69%-100%); specificity, 65.38% (44.33%-82.79%); and accuracy, 83.33% (71.48%-91.79%). The AUROC was 0.80 (0.70-0.90). For the SVM, the validation sensitivity was 79.41% (62.10%-91.30%); specificity, 61.54% (40.57%-79.77%); and accuracy, 71.67% (58.56%-82.55%). The AUROC was 0.72 (0.61-0.83). For the MLR, the validation sensitivity was 76.34% (61.14%-90.54%); specificity, 59.23% (39.21%-79.42%); and accuracy, 66.32% (50.21%-82.72%). The AUROC was 0.64 (0.53-0.75).
4 DISCUSSION
There are no reliable in vitro tests that would allow to diagnose N-ERD with high probability. None of the single biomarkers have been generally recognized as being able to determine the presence of the disease in clinical practice. Our center has been involved in research on N-ERD for many years. It was initiated by Professor Andrzej Szczeklik, who presented the cyclooxygenase theory of aspirin-induced asthma, which indicated that aspirin hypersensitivity is related to the pharmacological inhibition of cyclooxygenase.26 We have been investigating various diagnostic methods for aspirin hypersensitivity, including in vitro tests, yet without much success. In a recent systematic review and meta-analysis, Hagan et al have shown for the first time that the measurement of urinary LTE4 could be used as a clinical test to identify the risk of aspirin intolerance among patients with asthma.27 However, further research is needed to standardize the normative values for each of the major methodologies used to analyze urinary LTE4 levels and define the clinical utility of this biomarker. So far, the prediction of N-ERD diagnosis can only be established on the basis of a patient's medical history and a positive aspirin challenge test.
As a medical and research center dealing with N-ERD patients, we have hundreds of individuals with N-ERD and ATA in our cohort. On various occasions, including research grants, our patients have been subjected to aspirin challenge test as well as clinical and biochemical evaluations. These included the assessment of asthma severity and control, spirometry, computed tomography scans of the sinuses, total serum IgE levels, skin tests, cell phenotypes based on sputum, as well as eicosanoid evaluation in ISS and urine. Using this prospectively collected data, we aimed to develop an artificially intelligent system for predicting the presence of N-ERD among asthma patients. Artificial intelligence is the ability of a learning machine to interpret external data, learn from it, and use those results to achieve certain goals. The ANN is an artificial intelligence tool that has recently become popular in medical diagnosing.17, 18 It is a human brain–inspired computing system, which is able to process complex data (input variables and known outcomes), and then use the recognized patterns to solve similar problems in the future. In the present study, we have for the first time developed an ANN that transformed a combination of 18 clinical and biochemical variables of asthma patients into an output value differentiating between N-ERD and ATA.
The selected clinical and biochemical data are easily obtainable in a clinical setting and seem to be helpful in predicting the presence of N-ERD. Six weeks prior to the study, all participants were treated in the same way with inhaled corticosteroids, long-acting beta2-agonists, nasal corticosteroids, and, in 15 cases, with small doses of oral corticosteroids. The clinical differences between the 2 groups in our study concerned sex, the age of asthma onset, baseline FEV1, treatment, the presence of CRSwNP, and a history of sinonasal surgery. Such discrepancies between N-ERD and ATA are well recognized and were previously acknowledged by other authors.1 Apart from blood and urine collection, all study participants underwent sputum induction, as it is a relatively noninvasive procedure that allows the parallel assessment of inflammation cellular pattern and eicosanoid profile in the bronchi. Assessment of cell phenotypes based on sputum is currently a routine procedure in clinical centers providing care for asthma patients. However, ISS biomarkers are only evaluated in specialist laboratory centers. Therefore, we attempted to exclude the phenotype based on IS, ISS eicosanoids (still including cell phenotypes based on IS), and then all IS variables (excluding cell phenotypes and ISS eicosanoids) from our machine learning model, and then performed 3 additional analyses based on the remaining parameters. Our results showed that the separate exclusion of the phenotype based on IS or ISS eicosanoids and the development of ANN based on the remaining parameters deteriorated the specificity of the ANN from 73% to 57.7% or 61.5%, respectively. Additionally, we performed an analysis excluding solely urinary LTE4, as the overproduction of cysteinyl leukotrienes is the key pathologic mechanism in N-ERD. Our results showed that the exclusion of this single parameter deteriorated the specificity of the ANN from 73% to 65.4%. This indicates that both the phenotype based on IS as well as ISS and urinary eicosanoid concentrations are important in the prediction of N-ERD diagnosis. The ANN developed with the exclusion of even one of the above parameters was characterized by markedly lower specificity. It could also be expected that sputum induction would gain popularity in the era of precision medicine.28
N-ERD is usually associated with eosinophilic inflammation of the airways, but other sputum phenotypes (ie, neutrophilic, mixed, or paucigranulocytic) may also occur.4 Another key feature of N-ERD is the complex alteration of arachidonic acid metabolism pathways.1, 5 The imbalance between pro- and anti-inflammatory lipid mediators was previously observed in the ISS and urine of N-ERD individuals,4-6 and this determined the selection of PGD2, PGE2, and LTE4 for our machine learning analysis. We observed significantly higher baseline levels of PGD2 and LTE4 in ISS as well as urinary LTE4 in N-ERD individuals. On the contrary, baseline ISS PGE2 levels did not differ between the two groups, which had also been reported previously.5 The inclusion of this lipid mediator in our analysis was prompted by the fact that PGE2 is one of the key eicosanoids involved in the pathogenesis of N-ERD.1 Moreover, the significant decrease of ISS PGE2 concentrations in patients with N-ERD occurs during oral aspirin challenge.21
The present study has shown for the first time that the ANN could be successfully used to differentiate between patients with N-ERD and ATA. A multi-parameterized ANN was characterized by the highest sensitivity, specificity, and accuracy for the prediction of N-ERD among the 3 investigated methods including also the SVM and MLR. The ANN and SVM concentrate on finding a useful computer algorithm for solving discrimination problem and can be treated as competing solutions. The MLR is a model-based technique, in which two or more measurement variables are taken into consideration simultaneously to predict a value of one nominal variable.25 In our study, the MLR yielded the worst results among the investigated methods and should not be recommended for N-ERD prediction based on the analyzed variables. The sensitivity of our ANN for N-ERD prediction was 94%, which is a good result when compared with other studies using artificial intelligence to predict the diagnosis of various diseases.18, 29 In comparison with the oral aspirin challenge test,14 our ANN was characterized by higher sensitivity (94% vs 89%) but lower specificity (73% vs 93%) for N-ERD prediction. Similarly, in comparison with bronchial aspirin challenge test,14 our ANN was characterized by higher sensitivity (94% vs 77%) and lower specificity (73% vs 93%) for N-ERD prediction. The above provocation methods were perfected many years ago. For example, the oral aspirin test would take 2 days, while currently, a shorter 1-day oral challenge test is used. It is not known how our results would compare to the 1-day aspirin challenge protocols.15 We believe that it would also be very interesting and useful to perform a similar machine learning study between N-ERD and ATA only with CRSwNP. In our study, the number of ATA with CRSwNP patients was too small to perform a reliable analysis.
Our approach obviously cannot replace the gold-standard diagnostic method, which is the oral aspirin challenge test. However, the implementation of the ANN might provide an added value for identifying patients with N-ERD in clinical practice (Figure 4). This method is time effective, and, unlike the aspirin challenge test, it does not require patient hospitalization. All necessary procedures and data collection can be conducted in an outpatient setting during a single day. The ANN could also be helpful in predicting N-ERD in patients with asthma and low baseline FEV1. The inclusion of patients with low FEV1 in our study was only limited by sputum induction, for which the minimum FEV1 value is 50%.30 The oral aspirin challenge test can be carried out when baseline FEV1 is at least 70%.14, 15 In contrast to the aspirin challenge test, the procedures necessary to obtain data for the presented ANN do not carry a risk of life-threatening reactions. Recently, it has been reported that some asthma patients with aspirin hypersensitivity have negative aspirin challenge test results when they receive leukotriene receptor antagonists31 or had undergone sinus surgery shortly before aspirin provocation.32 However, there were no such participants in our study, so it is difficult to conclude whether the ANN would be also useful in situations where the aspirin challenge is negative in the face of a strong clinical suspicion.
The results of this study should be interpreted within the context of its limitations. First, the clinical and biochemical assessment was performed directly before the aspirin challenge test in all patients with N-ERD and ATA. Therefore, asthma treatment was modified.14 Second, it may seem that the number of 18 variables included in our ANN is high, but the exclusion of IS variables substantially reduced the percentage of correctly classified diagnoses. Third, the group of 203 patients could seem to be relatively small for the development of a machine learning system. However, it should be emphasized that N-ERD is a specific endotype of asthma and the number of patients is limited. We hope to collaborate on the development of the ANN with our colleagues from other centers in the future. Finally, as for now, our ANN is only a statistical model, which in order to be used in clinical practice will require the development of a user interface available in the physician's office.
In conclusion, we have developed a multi-parameterized ANN that is able to identify patients with N-ERD among the asthmatic population. Although it cannot be perceived as a replacement for the aspirin challenge test, it shows that machine learning techniques might be beneficial in the diagnostic process of N-ERD. Further research is needed to develop a system that would allow for an entirely in vitro diagnosis of N-ERD via the implementation of machine learning techniques.
ACKNOWLEDGMENTS
This work was supported by the National Science Centre (NCN), Poland (grant numbers: UMO-2015/19/B/NZ5/00096; UMO-2013/11/B/NZ6/02034; and N402 593040). We thank Iwona Lipiarz, Bożena Strączek, Anita Borkowska-Mosur, Ewa Mlicka-Kowalczyk for technical assistance as well as Anna Gielicz for ISS eicosanoid evaluation.
CONFLICT OF INTEREST
None of the authors have a conflict of interest in relation to this work.
AUTHOR'S CONTRIBUTIONS
KET and LM involved in project concept, study design, and study implementation; contributed to writing of the first draft of the manuscript. KET, AC, and LM involved in data and statistical analysis. All authors contributed to data collection and manuscript editing; reviewed and approved the final version of the manuscript.


