The negative impact of T cell–mediated rejection on renal allograft survival in the modern era
Abstract
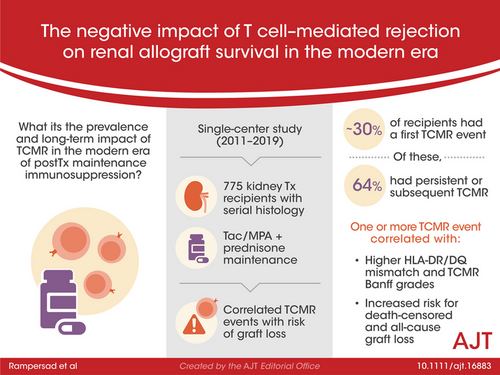
The prevalence and long-term impact of T cell–mediated rejection (TCMR) is poorly defined in the modern era of tacrolimus/mycophenolate-based maintenance therapy. This observational study evaluated 775 kidney transplant recipients with serial histology and correlated TCMR events with the risk of graft loss. After a ~30% incidence of a first Banff Borderline or greater TCMR detected on for-cause (17%) or surveillance (13%) biopsies, persistent (37.4%) or subsequent (26.3%) TCMR occurred in 64% of recipients on follow-up biopsies. Alloimmune risk categories based on the HLA-DR/DQ single molecule eplet molecular mismatch correlated with the number of TCMR events (p = .002) and Banff TCMR grade (p = .007). Both a first and second TCMR event correlated with death-censored and all-cause graft loss when adjusted for baseline covariates and other significant time-dependent covariates such as DGF and ABMR. Therefore, a substantial portion of kidney transplant recipients, especially those with intermediate and high HLA-DR/DQ molecular mismatch scores, remain under-immunosuppressed, which in turn identifies the need for novel agents that can more effectively prevent or treat TCMR.
Abbreviations
-
- ABMR
-
- antibody-mediated rejection
-
- BPAR
-
- biopsy proven acute rejection
-
- DSA
-
- donor-specific antibody
-
- MPA
-
- mycophenolate
-
- Tac
-
- tacrolimus
-
- TCMR
-
- T cell–mediated rejection
1 INTRODUCTION
T cell–mediated rejection (TCMR) in kidney transplantation, standardized by the Banff working classification, is a histologic diagnosis based on T lymphocytic infiltration of the tubules, interstitial space, and/or arterial intima and media.1 The alloimmune basis of TCMR (including Banff Borderline) is supported by its strong correlation with degree of donor-recipient HLA-DR/DQ eplet molecular mismatch (mMM).2 Despite modern era maintenance immunosuppression with tacrolimus (Tac) and mycophenolic acid (MPA), clinical TCMR in the first year remains between 5 and 15% documented by for-cause biopsies, while subclinical TCMR (≥Banff Borderline) occurs in up to 30% of early surveillance biopsies.3-6
Once a TCMR event is diagnosed, two recent practice surveys found that >60% of United States and 70% of Canadian clinicians rely on the return of serum creatinine measurements to baseline as evidence that a clinical biopsy proven acute rejection (BPAR) has resolved.7, 8 A systematic review covering the BPAR treatment literature from 1997 to 2015 identified only five studies that examined the response to anti-rejection therapy based on the initial TCMR Banff grade and none of these studies verified treatment adequacy using histologic follow-up.9 Unfortunately, follow-up biopsy studies have documented a dissociation between recovery of kidney function versus persistence of TCMR following BPAR therapy.10, 11 Moreover, in the case of subclinical TCMR, in the absence of validated non-invasive biomarkers, the only available option is a follow-up biopsy to assess a therapeutic response; kidney function is insensitive.
In the context of Tac/MPA-based therapy three cohorts of adult (n = 23 and n = 192) and pediatric (n = 103) subjects have documented between 36 and 52% persistent or subsequent TCMR following an initial TCMR event (≥Banff Borderline) despite therapy.5, 6, 12 Bouatou et al. recently reported that lack of a first TCMR treatment response correlated with de novo DSA development, antibody-mediated rejection (ABMR), and death-censored allograft loss.13 However, in this study only for-cause biopsies were considered, and Banff Borderline TCMR was excluded. Therefore, the prevalence and long-term impact of a first TCMR event (inclusive of Banff Borderline and irrespective of a for-cause versus surveillance biopsy designation) and a second TCMR event remains poorly defined in the context of Tac/MPA maintenance immunosuppression.
To address this question, we studied a consecutive cohort of kidney transplant recipients maintained on Tac, MPA, and prednisone and with long-term follow-up to describe: (i) the prevalence of a first TCMR event, (ii) the prevalence of a second TCMR event on a subsequent biopsy, (iii) the risk factors for a first or second TCMR event, and (iv) the correlation of these TCMR events with key transplant outcomes including de novo DSA development, death-censored graft loss, and all-cause graft loss.
2 METHODS
This single-center cohort consisted of 853 consecutive kidney transplant adult and pediatric recipients transplanted between March 2001 to December 2019. Approval was obtained from the Institution Health Research Board (H2011: 211). Recipients were excluded for primary non-function (n = 23), pre-transplant donor-specific antibody (n = 39), or cyclosporin maintenance immunosuppression (n = 16) leaving n = 775 for analysis. Standard immunosuppression consisted of tacrolimus, mycophenolic acid, and prednisone. Induction therapy with thymoglobulin (23%) or basiliximab (22%) was used in 45% of patients. Details on serologic monitoring post-transplant have been reported previously and can be found in the Methods S1.14, 15
2.1 HLA typing and eplet molecular mismatch identification
Class II HLA typing (HLA-DRβ1/3/4/5 and HLA-DQα1/β1) was performed using sequence-specific oligonucleotide probes or sequence-specific primer technology (LABType® HD SSO, Micro SSP™, One Lambda). The HLAMatchmaker software (HLA DRDQDP Matching version 2.2) was used to determine the eplet mismatch for each HLA-DR or HLA-DQ molecule individually and the single molecule eplet mismatch was used to categorize individuals into three alloimmune risk groups (low, intermediate, or high) using previously described thresholds and is detailed in the Supplemental Methods S1.16
2.2 Rejection treatment
Tacrolimus target trough levels were 8–12 ng/ml (weeks 1–4), 8–10 ng/ml (months 1–4), and then 5–8 ng/ml. The mycophenolate target dose was ≥1.5 grams/day. Recipients with de novo DSA and/or acute rejection were treated by optimizing tacrolimus trough levels (8 ± 2 ng/ml) and mycophenolate dose (2 g/day as tolerated). A steroid bolus with taper (typically 200–500 mg daily for three days followed by a taper over 2 weeks) was given when acute TCMR, including most Borderline, and/or ABMR were present on a for-cause or protocol biopsy. Occasionally, in cases with severe clinical TCMR, higher doses of steroids (1 gram daily for 3 days followed by a 2-week taper) and/or Thymoglobulin (4.5 mg/kg over 3 days, n = 2) was administered. For clinical ABMR, plasmapheresis and high-dose IVIG (2 g/kg) were given.
2.3 Clinical and histologic monitoring
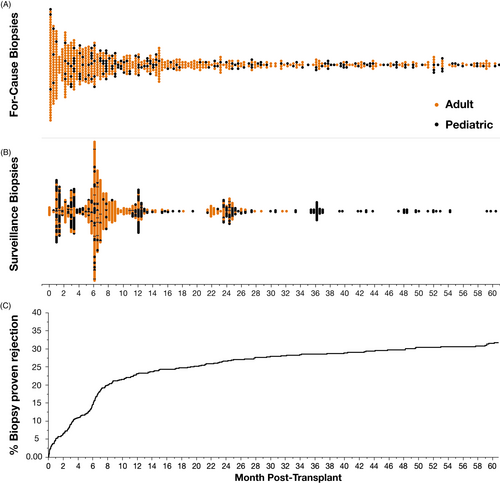
Prior to 2006 “surveillance biopsies” were performed at 1, 3, and 6 months in all consenting recipients with at least 1 HLA mismatch, with pediatric recipients having an additional surveillance biopsy annually to 36 months (Figure 1). After 2005, adult surveillance biopsies were limited to the 6-month time point except when part of a trial.
“For-cause biopsies” were performed if there was an unexplained rise in serum creatinine ≥25% from baseline, proteinuria was ≥0.5 grams/day, there was a newly detected de novo donor-specific antibody (DSA), BK viremia, etc. (Table S1). Kidney biopsy was offered to all recipients with newly detected de novo donor-specific antibody (DSA) since January 2008 as standard of care. Following a TCMR event, recipients were routinely offered a follow-up for-cause biopsy (typically 2–6 months post-TCMR) to monitor/confirm resolution.
Banff Borderline rejection was diagnosed when interstitial inflammation score was ≥1 in the presence of mild tubulitis (t1), or when interstitial inflammation score =1 with any grade of tubulitis >t0, consistent with the Banff 2019 meeting report definition.17 Histology was evaluated using Banff criteria by a single experienced kidney transplant pathologist (IWG). Persistent TCMR was defined as TCMR present on first follow-up biopsy within 6 months of an initial TCMR event. We use the term subsequent to describe a second TCMR after an intervening normal biopsy, or a second TCMR >6 months from the first TCMR event.
2.4 Statistics
We use median and interquartile range, or counts and percentages to describe the baseline characteristics of the cohort. We use a chi-squared test to assess the association between the HLA-DR/DQ mMM categories and patients who had none, 1 or ≥2 TCMR events. For our main analyses, we use survival methods for analysis of time-to alloimmune event outcomes. Specifically, we assessed associations with baseline covariates using conventional Cox models. As the Schoenfeld residuals for the Cox model for all-cause graft loss suggested recipient age did not have linear effect on the log-hazard we have used, linear regression splines (hinged or “broken stick regression” models) with a knot at a recipient age of 50 years to provide better fit to the data (Methods S1). Having established our baseline model, we then examined the effect of delayed graft function (DGF) as a time-dependent covariate in an extended proportional hazards model.18 Finally, the impacts of alloimmune events (e.g., first TCMR, second TCMR, and ABMR) on subsequent risk for graft loss were assessed by adding these as additional time-dependent covariates in a sequence of proportional hazards models. By including alloimmune events as time-dependent covariates, we have avoided the issue of immortal time bias in which patients are analyzed in the survival models as though their post-baseline clinical events were baseline characteristics.19 We regard our analyses as essentially descriptive and consider p-values <.05 as significant. Analyses were conducted using JMP Pro (Version 15.0) and the survival package (Version 3.2.7)20 in the R programming language (Version 4.0.4).21
3 RESULTS
3.1 Study population
This consecutive cohort (n = 775) had a mean follow-up of 6.5 years (median 6.3; IQR 2.9–11.1) and a median 10-year all-cause graft survival of 70% (death-censored graft survival 87%). Recipient demographics are shown in Table 1. A total of 1,685 kidney allograft biopsies (808 surveillance biopsies and 877 for-cause biopsies) were performed in 631/775 (81%) of the cohort including 73/74 (99%) of those recipients with death-censored graft loss. Biopsy indication details can be found in Table S1.
| Study cohorta | |
|---|---|
| (n = 775) | |
| First transplant | 94% |
| Recipient age (years) | 49 (36, 58) |
| Donor age (years) | 43 (30, 53) |
| Living donor | 48% |
| Ethnicity (Caucasian versus other) | 62% |
| HLA-A/B/DR Traditional antigen mismatch | 4 (3, 5) |
| HLA-DR/DQ Molecular mismatch risk category | |
| Low | 24% |
| Intermediate | 37% |
| High | 39% |
| Cold ischemic time (hours) | 3.9 (2.5, 9.1) |
| Delayed graft function | 15% |
| Tacrolimus, mycophenolate, prednisone | 100% |
| Tacrolimus mean 0–12 months | 9.9 (9.3, 10.5) |
| Tacrolimus coefficient of variation 0–12 months | 33 (27, 41) |
| Induction therapy | |
| None | 55% |
| IL−2 receptor antagonist (Basiliximab) | 22% |
| Anti-thymocyte globulin (Thymoglobulin) | 23% |
- a Median (interquartile range).
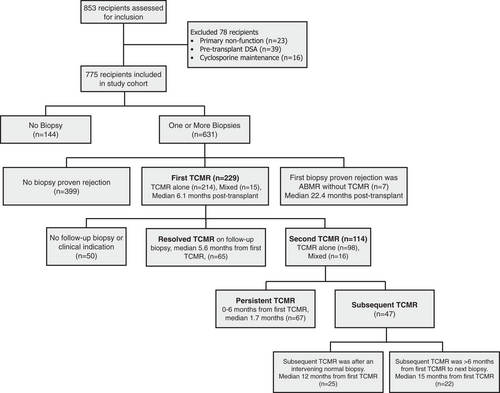
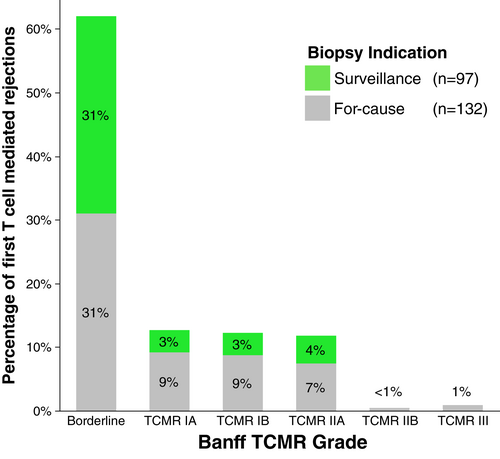
Banff TCMR diagnoses were Banff Borderline (n = 298), Banff IA (n = 83), Banff IB (n = 63), Banff IIA (n = 40), Banff IIB (n = 3), and Banff III (n = 3). The first biopsy proven acute rejection (BPAR) was TCMR in 214/236 (91%) of patients, mixed TCMR and ABMR in 15/236 (6%), and ABMR alone in 7/236 (3%) of cases (Figure 2). Of the 229 patients whose first BPAR included TCMR, 62% were Borderline TCMR, 12.6% were Banff IA TCMR, 12.2% Banff IB TCMR, 11.8% Banff IIA TCMR, and 1% Banff ≥IIB TCMR (Figure 3). With an overall prevalence of 29.5% (229/775), the median time to first TCMR was 6.1 months (IQR 2.6–12.1 months) post-transplant in patients who had TCMR.
3.2 Persistent and subsequent TCMR events after the first TCMR event
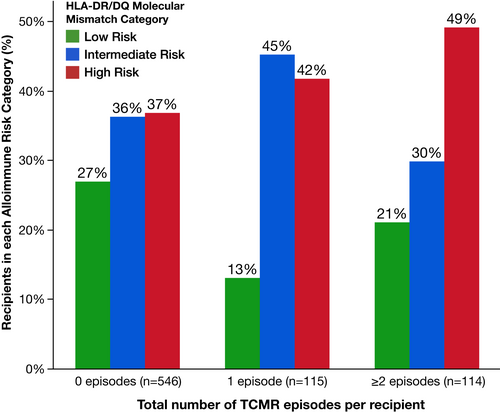
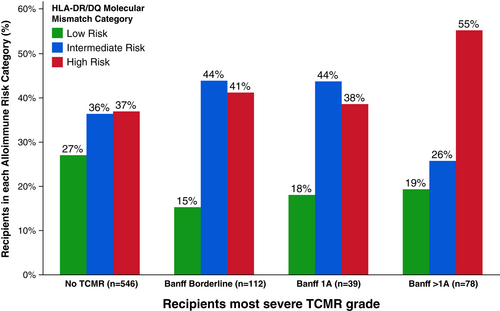
Serial follow-up biopsies revealed that after each TCMR event, ≥50% of recipients had another TCMR at a later timepoint (Figure 4). HLA-DR/DQ single molecule eplet mismatch scores were used to categorize patients into low, intermediate, or high molecular mismatch (mMM) categories using previously published thresholds.16 Recipients with one or more TCMR events were more frequently in the intermediate or high HLA-DR/DQ mMM categories (Figure 5, p = .002). Furthermore, there was a correlation between HLA-DR/DQ mMM categories and maximum TCMR Banff grade (p = .007, Figure 6).
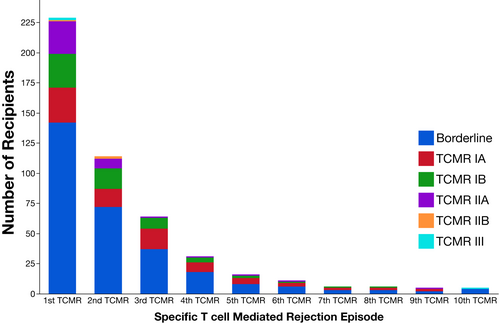
The majority of first TCMRs (78%, 179 of 229) had follow-up biopsies performed at a median of 3 months (IQR 1.3, 8.4) post-TCMR. Persistent TCMR was found in 37.4% of follow-up biopsies (67/179) at a median of 1.7 months (IQR 1.0, 5.7). An additional 26.3% (47/179) had a normal follow-up biopsy at a median of 2.1 months (IQR 1.2, 3.8) followed by a subsequent TCMR event (n = 25) at a median of 12.0 months (IQR 2.9, 22.7) or, if greater than six months from the index biopsy with no intervening normal biopsy, had a subsequent TCMR event (n = 22) at a median of 15.8 months (IQR 11.5, 35.8). Thus, 64% (114/179) of patients with histologic follow-up after their first TCMR event had either persistent or subsequent TCMR. If all patients without a follow-up biopsy (n = 50) were assumed have resolution of TCMR 114/229 (50%) had persistent or subsequent TCMR following a first event. Post-TCMR follow-up biopsies for recipients who had neither persistent nor subsequent TCMR occurred at a median of 5.6 months (IQR 2, 19). For the purpose of the allograft survival analysis below we considered both persistent or subsequent TCMR as representing a second TMCR event.16
A proportional hazards Cox regression model was used to assess recipient and donor peri-operative correlates of TCMR free survival (donor and recipient age, donor and recipient sex, recipient ethnicity, living vs. deceased donor, HLA-DR/DQ mMM category, cold ischemia time, induction therapy: Thymoglobulin versus Basiliximab versus none, and delayed graft function). In that multivariable model (Table S2), significant correlates of TCMR included recipient age (HR 0.63 per decade less than 40 years, 95% CI 0.5–0.7, p < .001; HR 1.65 per decade after age 40 years, 95% CI 1.2–2.2, p = .001), delayed graft function (HR 1.46, 95% CI 1.02–2.1, p = .04), and HLA-DR/DQ mMM category (Intermediate versus Low, HR 1.58, 95% CI 1.1–2.4, p = .02; High versus Low, HR 1.76, 95% CI 1.2–2.6, p = .004).
3.3 De novo donor-specific antibody development
Consistent with the published literature, the first TCMR event was associated with increased risk of subsequent de novo DSA (HR 2.19; 95% CI 1.3–3.7, p = .002) after adjusting for peri-operative covariates (Table S3A). In a sensitivity analysis of first TCMR events, those found on a for-cause biopsy (HR 2.29, 95% CI 1.3–4.2, p = .007) or a surveillance biopsy (HR 2.08, 95% CI 1.1–4.1, p = .03) were correlated with de novo DSA development (Table S3B). A second sensitivity analysis of first TCMR events showed a non-significant increase in risk of de novo DSA development after Banff Borderline TCMR (HR 1.65, 95% CI 0.9–3.1, p = .12); Banff ≥1A TCMR was, however, significantly correlated with de novo DSA development (HR 3.21, 95% CI 1.7–6.0, p < 0.001, Table S3C).
3.4 Allograft survival
Baseline multivariable covariates of death-censored and all-cause allograft loss (Model 0) are shown in Table 2. In the baseline model recipient age <50 years was significantly associated with death-censored allograft loss (HR 0.70 per decade, 95% CI 0.6–0.9, p = .002) while recipient age >50 years (HR 2.36 per decade, 95% CI 1.8–3.1, p < 0.001) and deceased versus living donor (HR 2.36, 95% CI 1.5–3.7, p < 0.001) were significantly associated with all-cause allograft loss. Delayed graft function was added as a time-dependent covariate in Model 1 (Table 3) and was associated with a significantly increased risk of both death-censored (HR 1.89, 95% CI 1.04–3.4, p = .04) and all-cause allograft loss (HR 1.87, 95% CI 1.3–2.7, p < 0.001) after adjustment for baseline covariates from Table 2. With the addition of first TCMR and ABMR (Model 2) as time-dependent covariates DGF, first TCMR, and ABMR were all independent predictors of death-censored graft loss (HR 1.99, 95% CI 1.1–3.7, p = .028; HR 3.08, 95% CI 1.8–5.4, p < 0.001; HR 5.47, 95% CI 2.9–10.4, p < 0.001 respectively) and all-cause graft loss (HR 1.89, 95% CI 1.3–2.8, p < 0.001; HR 1.62, 95% CI 1.1–2.3, p = .007; HR 3.06, 95% CI 1.8–5.2, p < 0.001 respectively) after adjustment for baseline covariates (Table 3).
| Death-Censored Graft Loss | All-Cause Graft Loss | |||||
|---|---|---|---|---|---|---|
| (Model 0, n = 74 events) | (Model 0, n = 187 events) | |||||
| HR | 95% CI | p value | HR | 95% CI | p value | |
| Donor sex (male versus female) | 0.67 | (0.41, 1.09) | 0.107 | 0.78 | (0.58, 1.06) | 0.110 |
| Recipent sex (male versus female) | 0.95 | (0.58, 1.56) | 0.853 | 0.87 | (0.65, 1.18) | 0.374 |
| Non-caucasian ethnicity | 1.50 | (0.92, 2.44) | 0.107 | 1.21 | (0.89, 1.64) | 0.223 |
| Donor age (per decade) | 1.13 | (0.95, 1.35) | 0.179 | 1.11 | (0.99, 1.24) | 0.064 |
| Recipient age <50 (per decade) | 0.70 | (0.55, 0.88) | 0.002 | 0.92 | (0.78, 1.08) | 0.305 |
| Recipient age >50 (per decade) | 1.42 | (0.84, 2.41) | 0.192 | 2.36 | (1.81, 3.07) | <0.001 |
| HLA-DR/DQ mMM category | ||||||
| Intermediate versus low | 0.93 | (0.49, 1.77) | 0.822 | 1.13 | (0.75, 1.7) | 0.572 |
| High versus low | 1.54 | (0.86, 2.78) | 0.147 | 1.31 | (0.88, 1.96) | 0.184 |
| Deceased versus living donor | 1.52 | (0.71, 3.26) | 0.279 | 2.36 | (1.51, 3.69) | <0.001 |
| Cold ischemic time (hours) | 1.00 | (0.94, 1.07) | 0.892 | 0.98 | (0.94, 1.02) | 0.321 |
| Basiliximab versus no induction | 0.60 | (0.25, 1.46) | 0.263 | 0.80 | (0.46, 1.37) | 0.413 |
| Thymoglobulin versus no induction | 0.88 | (0.45, 1.75) | 0.724 | 1.15 | (0.77, 1.71) | 0.492 |
| Death-Censored Graft Loss n = 74 events | All-Cause Graft Loss n = 187 events | |||||
|---|---|---|---|---|---|---|
| HR | 95% CI | p value | HR | 95% CI | p value | |
| Model 1 | ||||||
| DGF | 1.89 | (1.04, 3.42) | 0.037 | 1.87 | (1.29, 2.70) | <0.001 |
| Model 2 | ||||||
| DGF | 1.99 | (1.08, 3.69) | 0.028 | 1.89 | (1.30, 2.75) | <0.001 |
| First TCMR | 3.08 | (1.77, 5.36) | <0.001 | 1.62 | (1.14, 2.3) | 0.007 |
| ABMR | 5.47 | (2.88, 10.38) | <0.001 | 3.06 | (1.83, 5.12) | <0.001 |
| Sensitivity analysis by biopsy type | ||||||
| DGF | 1.91 | (1.02, 3.59) | 0.043 | 1.80 | (1.23, 2.62) | 0.002 |
| First TCMR found by for-cause biopsy | 4.06 | (2.22, 7.45) | <0.001 | 2.16 | (1.46, 3.22) | <0.001 |
| First TCMR found by surveillance biopsy | 1.94 | (0.91, 4.15) | 0.086 | 1.07 | (0.65, 1.77) | 0.793 |
| ABMR | 4.61 | (2.39, 8.91) | <0.001 | 2.63 | (1.56, 4.44) | <0.001 |
| Sensitivity analysis by banff grade | ||||||
| DGF | 1.96 | (1.05, 3.64) | 0.034 | 1.88 | (1.29, 2.73) | <0.001 |
| First TCMR Banff Borderline | 2.90 | (1.58, 5.33) | <0.001 | 1.38 | (0.91, 2.09) | 0.128 |
| First TCMR Banff ≥IA | 3.42 | (1.73, 6.76) | <0.001 | 2.04 | (1.31, 3.15) | 0.001 |
| ABMR | 5.37 | (2.83, 10.2) | <0.001 | 3.04 | (1.82, 5.06) | <0.001 |
| Model 3 | ||||||
| DGF | 2.19 | (1.17, 4.07) | 0.014 | 2.00 | (1.38, 2.92) | <0.001 |
| First TCMR | 1.81 | (0.91, 3.60) | 0.09 | 1.18 | (0.77, 1.80) | 0.449 |
| Second TCMR | 2.98 | (1.55, 5.75) | 0.001 | 2.30 | (1.39, 3.79) | 0.001 |
| ABMR | 5.18 | (2.73, 9.85) | <0.001 | 2.69 | (1.59, 4.54) | <0.001 |
| Sensitivity analysis by second TCMR definition | ||||||
| DGF | 2.19 | (1.17, 4.08) | 0.014 | 2.00 | (1.37, 2.91) | <0.001 |
| First TCMR | 1.81 | (0.91, 3.60) | 0.09 | 1.18 | (0.77, 1.80) | 0.452 |
| Second TCMR persistent | 2.98 | (1.45, 6.12) | 0.003 | 2.38 | (1.37, 4.15) | 0.002 |
| Second TCMR subsequent | 2.99 | (1.30, 6.87) | 0.01 | 2.16 | (1.12, 4.19) | 0.022 |
| ABMR | 5.18 | (2.72, 9.88) | <0.001 | 2.72 | (1.60, 4.62) | <0.001 |
For Model 2 a sensitivity analysis of biopsy type (Table 3) showed that first TCMR on a for-cause biopsy was a significant correlate of death-censored and all-cause graft loss, while first TCMR on a surveillance biopsy showed a trend (p = .09) toward an increased risk of death-censored allograft loss and no significant association with all-cause allograft loss after adjustment for baseline covariates, DGF, and ABMR. A second sensitivity analysis of TCMR Banff grade showed that first Banff Borderline TCMR and a first Banff ≥1A TCMR were both associated with death-censored allograft loss after adjustment for baseline covariates, DGF, and ABMR (Table 3). A first Banff Borderline TCMR was not significantly associated with all-cause allograft loss, while a first Banff ≥1A TCMR was a correlate of all-cause allograft loss after adjustment baseline covariates, DGF, and ABMR.
In Model 3 the hazard attributed to a second TCMR event was added to Model 2 (Table 3). In this analysis, a second TCMR event correlated with significantly increased risk of death-censored (HR 2.98, 95% CI 1.6–5.8, p = .001) and all-cause allograft loss (HR 2.30, 95% CI 1.4–3.8, p = .001) after adjustment for both baseline covariates and the time-dependent covariates of DGF, first TCMR and ABMR. For Model 3 a sensitivity analysis was performed to compare the impact of a second TCMR event when defined as a persistent versus a subsequent TCMR event. This analysis found that both a persistent or subsequent TCMR event increased the risk of death-censored or all-cause allograft loss after adjustment for baseline and time-dependent covariates (Table 3). Directly comparing the impact of persistent versus subsequent TCMR found there was no statistically significant difference between persistent versus subsequent TCMR and their correlation with death censored (HR 1.0, 95% CI 0.44–2.23, p = .99) or all-cause (HR 1.1, 95% CI 0.56–2.17, p = .78) allograft loss.
An additional sensitivity analysis of Model 3 that excluded recipients with no biopsy (n = 144) and those with no follow-up biopsy after a first TCMR event (n = 50), found a second TCMR event remained significantly associated with death-censored and all-cause allograft loss after adjustment for both baseline and time-dependent covariates (Tables S4 and S5).
Tacrolimus mean exposure and coefficient of variation did not correlate with risk of all-cause or death-censored graft loss in multivariable models (data not shown). Transplant era (before versus after 2006) was not a significant baseline covariate and had no impact on the significance of the time-dependent covariates in the models for death-censored or all-cause allograft survival (data not shown).
4 DISCUSSION
In this consecutive cohort of kidney transplant recipients on Tac/MPA-based therapy, 29.5% had a first TCMR event and of these individuals 64% had persistent (37.4%) or subsequent (26.3%) TCMR (≥ Banff Borderline) event. HLA-DR/DQ mMM categories correlated with the risk of one or more TCMR events and the risk of more severe Banff grades of TCMR, supporting its potential utility as a prognostic biomarker in precision medicine or as an enrichment tool in clinical trial design. A first TCMR event correlated with de novo DSA, as well as death-censored or all-cause graft loss. Moreover, recipients with a second TCMR event were at a further increased risk of death-censored and all-cause allograft loss. Taken together this suggests optimizing prevention and/or treatment of a first TCMR event to prevent a second event (i.e., second TCMR or de novo DSA/ABMR) may improve long-term graft and patient outcomes.
In recent years there has been a debate regarding the impact of acute TCMR on allograft survival regardless of whether found on a for-cause vs. surveillance biopsy.22-24 In the context of the current study, a first TCMR event had a significant impact on both death-censored or all-cause graft loss even after adjusting for baseline and other significant time-dependent covariates (i.e., DGF and ABMR). Sensitivity analysis demonstrated: (a) Banff Borderline first TCMR correlated with death-censored graft loss; (b) first TCMR detected on a for-cause biopsy correlated with both death-censored and all-cause graft loss; and (c) a trend for the first TCMR event detected on surveillance biopsy to correlate with death-censored graft loss. Taken together these findings would support retention of acute TCMR as an important primary endpoint for clinical trials.
In 1993 the Banff Working Classification standardized the histologic criteria for the diagnosis of rejection to guide therapy and establish an objective rejection endpoint in clinical trials.25 The distinction between Banff Borderline changes (“very mild acute rejection”) and Acute Rejection Grade I (“mild acute rejection”) was arbitrarily defined by mild tubulitis (t1) with mild or moderate interstitial inflammation (i1-2) versus moderate tubulitis (≥t2) with significant interstitial inflammation (≥i2). In setting the threshold to only consider ≥Grade I as acute rejection “the schema was designed so that the false positive rate in diagnosis of rejection should be very low.” However, this comes with the potential for frequent false negatives depending on the prevalence and impact of Banff Borderline events.25 In the current study, 29.5% of recipients on Tac/MPA-based therapy without evidence of pre-formed donor specific memory (i.e., pre-transplant DSA negative) experienced at least one TCMR event on a for-cause or surveillance biopsy, 62% of which were classified as Banff Borderline confirming prior reports that Borderline is the most frequent TCMR event on Tac/MPA-based therapy.3-6, 26 Importantly, the current study found that Banff Borderline TCMR correlated with the degree of HLA-DR/DQ mMM and death-censored graft loss validating prior reports.2, 27, 28 Moreover, given the high-prevalence, and negative impact of a second TCMR event on both death-censored and all-cause graft loss, we contend that it is important to consider histologic follow-up even after a Borderline TCMR event.
Despite standardization of TCMR classification for more than 25 years, there is limited evidence to inform a standardized treatment of TCMR. In line with the current KDIGO guidelines, recent surveys of Canadian and United States programs reported that high dose steroids given for a brief time period (also poorly defined in terms of dose and duration) was the most common first-line treatment of TCMR.7, 8 A 2017 systematic review and meta-analysis of TCMR treatment found that depletional antibody therapy ±pulse steroids, led to increased reversal of acute rejection, decreased subsequent rejection, but at the expense of increased adverse events as compared to pulse steroid therapy where persistent rejection was found in ≥50% across all studies.29 However, this Cochrane review noted that their conclusions were limited by the absence of trials containing recipients receiving Tac/MPA-based immunosuppression. In our study we confirm that persistent or subsequent BPAR is common after both short-term anti-rejection therapy and augmented maintenance immunosuppression with what is considered to be the most efficacious drug combination (i.e., Tac/MPA).30-32
As expected, in the multivariable analysis of allograft survival both recipient age, deceased versus living donor transplants, and delayed graft function were predictors of allograft loss. Alloimmune events (TCMR or ABMR) were added to the baseline model as time-dependent covariates to capture the level of increased risk more accurately for death-censored or all-cause graft loss after the alloimmune event, even when adjusting for the impact of baseline covariates and DGF. To our knowledge this is the first report to show, in the context of Tac/MPA-based therapy, that a second TCMR increases the risk of subsequent death-censored and all-cause allograft loss even adjusting for baseline and time-dependent covariates (i.e., DGF, first TCMR and ABMR).
The ~30% prevalence of ≥Banff Borderline TCMR on surveillance and for-cause biopsies, and the >50% prevalence of a second TCMR event in these patients, defines two unmet needs in kidney transplantation related to a subset of patients who are clearly under-immunosuppressed despite Tac/MPA-based therapy. Given that these individuals with a first TCMR event are at risk for subsequent de novo DSA/ABMR, death-censored and all-cause graft loss, we postulate that a novel agent for the label indication of “prophylaxis of acute rejection” has the potential to improve long-term graft and patient outcomes. Similarly, the prevalence and negative impact of persistent or subsequent TCMR within the first year of the original TCMR event, provides the rationale and opportunity to develop a novel agent for the label indication of “treatment of acute rejection” to improve outcomes.
The concern in both these scenarios is that more potent immunosuppressive agents (vs. standard of care) could expose a significant number of individuals to over-immunosuppression to benefit only the subset that warrant such an approach. To address this concern we hypothesize that focusing novel drug development utilizing superiority RCT designs on transplant recipients with a high HLA-DR/DQ mMM score may enrich for patients most likely to benefit from more intense immunosuppression and additionally improve the efficiency of the trial. Previous reports have shown that HLA-DR/DQ mMM categories are independent correlates of both de novo DSA development and ≥Banff Borderline TCMR.2, 16 Confirming and building on these findings the current report found that the HLA-DR/DQ mMM score also correlated with the number of TCMR events. Finally, the HLA-DR/DQ mMM score was recently validated in an independent US retrospective cohort setting the stage for prospective clinical trials to determine its utility as a prognostic and predictive biomarker.33
5 LIMITATIONS
Due to the relatively small sample size and the associated risk of type II error, risk quantification should be interpreted with caution and should be validated in independent cohorts. Histology was available in only 81% of recipients’ post-transplant including 78% after the first TCMR event. However, only one recipient experienced a death-censored graft loss without at least one biopsy. Assuming those without follow-up biopsies were free of TCMR, the prevalence of persistent or subsequent TCMR was still ≥50%. A sensitivity analysis specifically restricted to patients with at least one biopsy and a follow-up biopsy post-TCMR (Tables S4 and S5) did not alter the conclusions in the full cohort (in fact, the results were even more significant). Although there were no pre-defined timepoints for follow-up biopsies, median time to post-TCMR biopsy was 2.1 months in those who initially resolved their TCMR prior to a subsequent TCMR and 1.7 months in those with persistent TCMR. Without a normal intervening biopsy there is no way to be certain if a second TCMR is persistent or subsequent, however, their impact on allograft survival was similar in both groups as defined in this cohort. Additional studies will be needed to further clarify if a subsequent versus persistent TCMR are substantially different in terms of their impact on graft outcome. Tacrolimus means and coefficient of variation were available in 93% of the cohort, however, a sensitivity analysis of all multivariable models including tacrolimus measurements did not alter the results. Detailed TCMR treatment records were not available for all recipients—a limitation of the study— thus, a differential response to specific treatment (i.e., intravenous versus oral steroids) could not be assessed.
6 CONCLUSION
A first TCMR event is associated with increased risk for de novo DSA, death-censored and all-cause graft loss. Moreover, a second TCMR event, adjusting for baseline covariates and time-dependent covariates (DGF, first TCMR and ABMR), correlates with an increased risk of both death-censored and all-cause allograft loss. Future studies optimizing prevention and/or treatment of a first TCMR event to prevent a second event (i.e., second TCMR or de novo DSA), especially targeting high-risk individuals based on their HLA-DR/DQ mMM category, may hold the potential to improve long-term graft and patient outcomes.
ACKNOWLEDGMENTS
P.W.N. and C.W. were funded by the Paul I Terasaki Research Fund. J.H. was funded by a CIHR New Investigator award. P.W.N. holds the Flynn Family Chair in Renal Transplantation.
DISCLOSURE
D.N.R. is a consultant with Astellas Pharma, P.W.N. is a consultant with CSL Behring.


