Diagnostic yield of 18F-FDG PET/CT imaging and urinary CXCL9/creatinine levels in kidney allograft subclinical rejection
Abstract
Subclinical kidney allograft acute rejection (SCR) corresponds to “the unexpected histological evidence of acute rejection in a stable patient.” SCR detection relies on surveillance biopsy. Noninvasive approaches may help avoid biopsy-associated complications. From November 2015 to January 2018, we prospectively performed positron emission tomography/computed tomography (PET/CT) after injection of F18-fluorodeoxyglucose (18F-FDG) in adult kidney transplant recipients with surveillance biopsy at ~3 months posttransplantation. The Banff-2017 classification was used. The ratio of the mean standard uptake value (mSUVR) between kidney cortex and psoas muscle was measured. Urinary levels of CXCL-9 were concomitantly quantified. Our 92-patient cohort was categorized upon histology: normal (n = 70), borderline (n = 16), and SCR (n = 6). No clinical or biological difference was observed between groups. The mSUVR reached 1.87 ± 0.55, 1.94 ± 0.35, and 2.41 ± 0.54 in normal, borderline, and SCR groups, respectively. A significant difference in mSUVR was found among groups. Furthermore, mSUVR was significantly higher in the SCR vs normal group. The area under the receiver operating characteristic curve (AUC) was 0.79, with 83% sensitivity using an mSUVR threshold of 2.4. The AUC of urinary CXCL-9/creatinine ratios comparatively reached 0.79. The mSUVR positively correlated with ti and acute composite Banff scores. 18F-FDG-PET/CT helps noninvasively exclude SCR, with a negative predictive value of 98%. External validations are required.
Abbreviations
-
- 18F-FDG PET/CT
-
- fluorodeoxyglucose F18 positron emission tomography coupled with computed tomography
-
- ANOVA
-
- one-way analysis of variance
-
- AR
-
- acute rejection
-
- AUC
-
- area under the curve
-
- ELISA
-
- enzyme-linked immunosorbent assay
-
- FSHS
-
- focal and segmental hyalinosis and sclerosis
-
- GFR
-
- glomerular filtration rate
-
- IFTA
-
- interstitial fibrosis and tubular atrophy
-
- KTR
-
- kidney transplant recipients
-
- KTx
-
- kidney transplantation
-
- mSUVR
-
- ratio of the mean standard uptake value
-
- NPV
-
- negative predictive value
-
- PPV
-
- positive predictive value
-
- ROC curve
-
- receiver operating characteristic curve
-
- SCR
-
- subclinical rejection
-
- SUV
-
- standard uptake values
-
- VOI
-
- volume of interest
1 INTRODUCTION
The full benefits of kidney transplantation (KTx) remain undermined by acute rejection (AR). An early diagnosis of such a reversible cause of graft failure is essential to appropriately reinforce the immunosuppressive regimen. It currently relies on transplant needle biopsy to provide the gold-standard criteria as summarized in the Banff classification.1 Subclinical rejection (SCR) has been defined as “the documentation by light histology of unexpected evidence of AR in a stable patient.” The diagnosis of SCR is important, given that the treatment of subclinical T cell–mediated AR results in similar long-term graft survival to that in patients without rejection.2 Surveillance transplant biopsies are, by definition, required for diagnosis of SCR. Only 17% of transplant centers in the United States perform surveillance biopsies in all patients, whereas 62% do not perform surveillance biopsies at all.3 Noninvasive biomarkers (and iconomarkers) may be developed as “rule out” tests, with the highest negative predictive value, in order to reduce the indiscriminate use of allograft biopsies in stable kidney transplant recipients (KTR).4
Various noninvasive modalities for the diagnosis of SCR are currently under investigation, including imaging, gene expression profiling and omics analyses of blood and urine samples.5-7 In the urine, several biomarkers have been associated with renal AR.8 Currently, the most promising biomarkers are the IFN-γ-induced protein 10 kDa (IP-10, also known as CXCL10) and the IFN-γ-induced monokine (MIG, also known as CXCL9). CXCL9 and CXCL10 are implicated in the recruitment of activated T cells, thereby promoting tissue infiltration and inflammation.9 In 2015, Hirt-Minkowki et al10 concluded that urinary CXCL9 and CXCL10 chemokines may help detect SCR, because their levels increase before clinical manifestations of AR. In 2016, Rabant et al11 demonstrated that early low urinary levels of CXCL9 and CXCL10 predict immunological quiescence in clinically and histologically stable KTR. Similarly, 18F-fluorodeoxyglucose positron emission tomography coupled with computed tomography (18F-FDG PET/CT) may help to noninvasively distinguish nonrejection from AR. Rodent models of allogeneic KTx have suggested that 18F-FDG PET/CT early and specifically detect AR.12, 13 In humans, we have suggested the usefulness of 18F-FDG PET/CT in AR diagnosis in a pilot study of 32 KTR presenting with acute kidney injury and suspected AR.14
In the present prospective study, we assess the yield of 18F-FDG PET/CT and urinary CXCL9/Creatinine levels in the rule out of SCR in stable KTR at ∼3 months post KTx.
2 PATIENTS AND METHODS
2.1 Patients
From November 2015 to January 2018, we prospectively performed 18F-FDG PET/CT imaging in adult KTR who underwent surveillance transplant biopsy at ~3 months post KTx. The present study does not include iABO KTR. Written informed consent was obtained. Clinical and biological parameters were systematically collected (see Table 1). This study has been approved by the institutional review board of the University of Liège Academic Hospital under the number B707201215598. Our database has been registered as NCT03764124. Kidney transplantations have been performed in accordance with the Declaration of Istanbul.
| Cohort (n = 92) | Normal (n = 70) | Borderline (n = 16) | Rejection (n = 6) | P | |
|---|---|---|---|---|---|
| Recipients | |||||
| Age (y): M [range] | 57 [37-68] | 56 [36-68] | 60 [36-68] | 66 [49-70] | .36 |
| Sex (M/F): n; Sex ratio | 64/28; 2.0 | 46/24; 2.0 | 12/4; 3.0 | 6/0 | .19 |
| BMI (kg/m2): m ± SD | 27 ± 5 | 26 ± 5 | 28 ± 5 | 26 ± 4 | .38 |
| PRA max (<5%/5%-85%/>85%): n | 83/6/3 | 64/4/2 | 14/2/0 | 5/0/1 | .38 |
| Donors | |||||
| Age (y): M [range] | 44 [20-60] | 44 [20-60] | 41 [25-55] | 53 [21-68] | .60 |
| Sex (M/F): n; sex ratio | 56/36; 2.0 | 41/29; 1.0 | 12/4; 3 | 3/3; 1 | .42 |
| Donor type [DBD/DCD/LD]: n | 66/20/6 | 53/13/4 | 8/6/2 | 5/1/0 | .50 |
| BMI (kg/m2): m ± SD | 26 ± 5 | 26 ± 5 | 26 ± 5 | 26 ± 4 | .97 |
| Transplantation | |||||
| Rank (1st/2nd/3rd): n | 81/9/2 | 63/6/1 | 14/1/1 | 4/2/0 | .40 |
| CIT (min): m ± SD | 699 ± 291 | 686 ± 280 | 722 ± 303 | 789 ± 422 | .67 |
| HLA mismatches: m (SD) | |||||
| Locus A | 0.89 ± 0.69 | 0.93 ± 0.69 | 0.81 ± 0.75 | 0.67 ± 0.52 | .60 |
| Locus B | 1.21 ± 0.64 | 1.2 ± 0.67 | 1.19 ± 0.54 | 1.33 ± 0.52 | .88 |
| Locus DR | 0.73 ± 0.58 | 0.66 ± 0.59 | 1 ± 0.52 | 0.83 ± 0.41 | .09 |
| Early graft function (n) (immediate/slow/delayed) | 65/18/9 | 49/14/7 | 15/0/1 | 1/4/1 | .46 |
| DSA (none/class I/class II): n | 81/7/4 | 62/5/3 | 15/0/1 | 4/2/0 | .76 |
| Proteinuria (mg/g creat): m ± SD | 134 ± 133 | 137 ± 147 | 98 ± 38 | 194 ± 106 | .30 |
| Status at the time of biopsy | |||||
| Maintenance immunosuppression: n | |||||
| CNI (CsA/FK/none) | 2/90/0 | 1/69/0 | 1/15/0 | 0/6/0 | .47 |
| Antimetabolite (MMF/MPA/AZA/none) | 79/7/0/6 | 59/6/0/5 | 15/1/0/0 | 5/0/0/1 | .53 |
| mTOR inhibitor (yes/no) | 1/91 | 1/69 | 0/16 | 0/6 | .86 |
| CS (yes/no) | 90/2 | 68/2 | 16/0 | 6/0 | .73 |
| Duration of KTx at biopsy (d): M [range] | 97 [84-138] | 96 [83-126] | 102 [89-130] | 101 [99-134] | .77 |
| Creatinine (mg/dL): m ± SD | 1.39 ± 0.42 | 1.39 ± 0.43 | 1.32 ± 0.39 | 1.49 ± 0.38 | .70 |
| eGFR (mL/min/1.73 m2) | 51.7 ± 16.2 | 50.4 ± 16 | 56.6 ± 17.9 | 53.4 ± 14.1 | .62 |
- Data are expressed as mean (m) ± 1 standard deviation and as median (M) (minimum-maximum). No significant difference was observed between groups (ANOVA). AZA, azathioprine; BMI, body mass index; CIT, cold ischemic time; CNI, calcineurin inhibitors; CS, corticosteroids; CsA, cyclosporin A; DBD, donor after brain death; DCD, donor after circulatory death; DSA, donor-specific antibodies; eGFR, estimated glomerular filtration rate; FK, tacrolimus; KTx, kidney transplantation; LD, living donor; MMF, mycophenolate mofetyl; MPA, mycophenolic acid; mTOR, mammalian target of rapamycin; PRA panel reactive antibody.
2.2 Histopathology
Biopsies were assessed by pathologists blinded to the results of 18F-FDG PET/CT. Banff 2017 classification was conventionally used: acute and chronic histological lesions were scored from 0 to 3 on the basis of the severity of infiltration by mononuclear cells in each component – glomeruli (g), peritubular capillaries (ptc), arteries (v), tubules (t), and interstitium (i). The acute composite Banff score was defined as the sum of g, ptc, t, i, and v. The i threshold for “borderline” lesion was “ix t1” or “i0-1 t2-3.” Total inflammation (ti) taking into account interstitial inflammation in both nonsclerotic and sclerotic areas was also examined. C4d staining was performed in all cases using the Benchmark-Ventana Medical Systems SP91 rabbit monoclonal antibody following the manufacturer's instructions and in agreement with the conventional rules of good laboratory practices (GLP). The definition of “suspected antibody-mediated rejection (ABMR)” practically corresponds to [(0<g+ptc<2) OR (v > 0) OR (acute thrombotic microangiopathy (TAM) without other cause) OR (acute tubular necrosis (ATN) in the absence of other cause)] AND (C4d+) AND NOT (DSA+); [(0<g+ptc<2) OR (v > 0) OR (acute TAM without other cause) OR (ATN in the absence of other cause)] AND (DSA+) AND NOT (C4d+); (g+ptc)>=2 AND NOT (DSA+) AND NOT (C4d+).
2.3 18F-FDG PET/CT imaging
PET/CT was performed with late acquisitions (201 ± 18 minutes) after 18F-FDG intravenous injection (3.2 ± 0.2 Mbq/kg) within a 48-hour period around the biopsy, before any modification of immunosuppressive regimens. The mean standardized uptake value (mSUV) of kidney cortex was measured and averaged from 4 volumes of interest (VOI) distributed in the upper (n = 2) and lower (n = 2) poles. The mSUV of kidney was normalized to the mSUV of psoas muscle (VOI of 20 mL) considered as reference tissue in order to obtain the mean SUV ratio (mSUVR).15, 16 Neither the liver nor the mediastinum was within the field of the graft-centered scan, which hampers the use of liver or blood pool as references. PET and CT acquisition using cross-calibrated GEMINI TF Big Bore and GEMINI TF 16 PET/CT systems (Philips Medical Systems, Amsterdam, Netherlands), as well as reconstruction parameters, were described previously.14
2.4 Measurements of urinary CXCL9
Urine specimens were collected before kidney biopsy and PET/CT imaging in fasting conditions. Frozen aliquots (with protease inhibitors at −80°C) were used without any dilution and tested by enzyme-linked immunosorbent assay (ELISA) for CXCL9 (Human CXCL9/MIG DuoSet; R&D Systems, Minneapolis, MN) as recommended by the CTOT-01 Study.17 Urine samples with a chemokine concentration below the detection limit were included as one half of the minimum detectable value (minimum detectable value in the assay: 32.55 pg/mL). Measurement of urine creatinine was performed in the same sample using a Hitachi 917 Analyzer (Roche Diagnostics, Basel, Switzerland). The results were normalized to urinary creatinine levels: uCXCL9/Cr ratio (in nanograms per millimole).
2.5 Statistics
One-way analysis of variance (ANOVA) and Tukey's range tests were performed using the Python library SciPy and StatsModels (http://www.scipy.org/) to compare the mSUVR and uCXCL9/Cr ratio among groups. Additionally, the correlation between the mSUVR or uCXCL9/Cr ratio and acute composite Banff scores or ti was assessed using  . Finally, the receiver operating characteristic (ROC) curve used to extrapolate sensitivity and specificity was built using Python programming language.
3 RESULTS
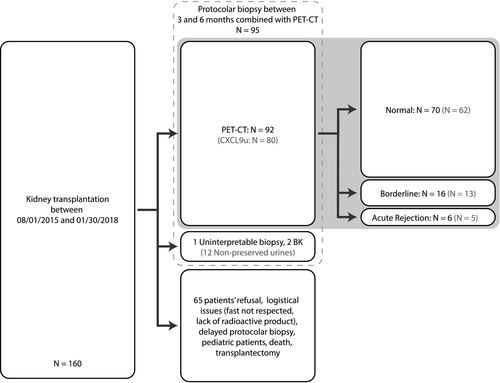
From November 2015 to January 2018, we prospectively performed 95 18F-FDG PET/CT in adult KTRs who underwent surveillance transplant biopsy at ∼3 months post KTx (median duration of KTx at biopsy: 97 days [minimum 84-maximum 138]) (Figure 1). Most of the 18F-FDG PET/CT were performed immediately after kidney allograft biopsy (85/95, ie, 89.5%), before any modification of immunosuppressive regimens. No hematoma or inflammation was observed. Three cases were excluded for polymerase chain reaction-proven BK nephropathy (n = 2) or uninterpretable histology (n = 1, ie, absence of kidney tissue). Notably, the mSUVR of BK-positive cases were 2.68 and 1.87. Concerning the clinical characteristics of the study cohort, the median age of recipients was 57 years [min. 37; max. 68] with a gender ratio (M/F) of 2 and a mean body mass index (BMI) of 27 ± 5 kg/m2. The median age of donors was 44 years [min. 20; max. 60] with a gender ratio of 2 and a mean BMI of 26 ± 6 kg/m2 (Table 1). No significant differences were observed between the study cohort (n = 92) and the remaining patients (n = 68) transplanted during the study period (Table S1). The 92-patient cohort was categorized into 3 groups upon Banff-based histology: normal (n = 70), borderline (n = 16), and SCR (n = 6). None of the surveillance biopsies showed immunoreactivity against C4d. Two 2 patients showed suspected ABMR, with v1 no ptc. No significant difference was observed between groups regarding the clinical and biological features of kidney donors or recipients (Table 1). Particularly, serum levels of creatinine and estimated glomerular filtration rate were similar in all groups.

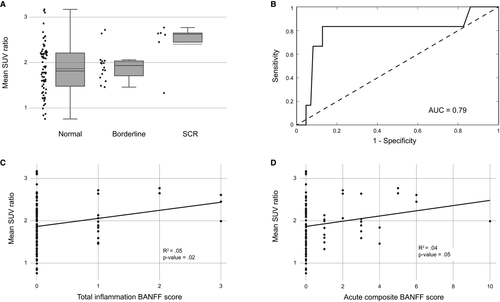
The mSUVR reached 1.87 ± 0.55, 1.94 ± 0.35, and 2.41 ± 0.54 in normal, borderline, and SCR groups, respectively (Figure 2). A significant difference in the mSUVR was found among groups (F-score = 3, P = .05). Furthermore, the mSUVR was significantly higher in SCR vs normal histology. There was no significant difference in the mSUVR between normal vs borderline groups. The mSUVR of the “normal” group was not statistically different from the one of a combined “borderline + SCR” group. A positive correlation was observed between the mSUVR and ti score (R = .22, P = .02) and between the mSUVR and acute composite Banff score (R = .2, P = .05) (Figure 2). Similar observations were made using the absolute raw values of mean or maximal SUV from the 4 renal cortical VOI (data not shown). The associated P values emphasize the statistical significance of these results, although the clinical relevance of R values of ~.2 may be questionable. The area under the ROC curve (AUC) to discriminate the SCR group from nonpathological biopsies (ie, normal + borderline groups) was 0.79, with 83% sensitivity and 87% specificity using an mSUVR threshold of 2.4. The corresponding negative (NPV) and positive predictive values (PPV) reached 98% and 31%, respectively. Of note, the use of isolated kidney mSUV (not corrected to psoas mSUV) in this cohort showed similar observations, with a 96% negative predictive value using a renal mSUV threshold at 1.6.14

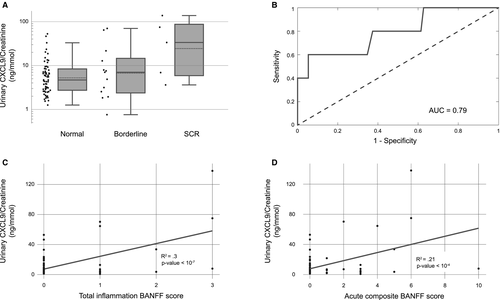
Urine samples were available in 80 patients of our cohort, with a distribution upon the histology as follows: 62 in normal, 13 in borderline, and 5 in SCR groups. Twelve urine samples were missing because of unavailability before kidney biopsy, patients’ refusal, or inadequate samples. The mean uCXCL9/Cr ratios reached 7.9± 9.6, 15.9 ± 23.6, and 51.4 ± 56.2 ng/mmol for the normal, borderline, and “SCR” groups, respectively (Figure 3). A significant difference in mean uCXCL9/Cr ratios was found among groups (F-score = 13.9; P < .001), with a significant difference in mean uCXCL9/Cr ratios between normal vs SCR groups (P < .001). A positive correlation was observed between mean uCXCL9/Cr levels and ti score (R = .55; P < .001), and acute composite Banff score (R = .46; P < .001) (Figure 3). The AUC of the ROC curve was 0.79, with 80% sensitivity and 63% specificity using a threshold of 6.75 ng/mmol of mean uCXCL9/Cr ratios (Figure 3). The corresponding NPV and PPV were 98% and 12.5%, respectively.

The ROC curve obtained by logistic regression integrating the mean SUVR values and the mean urinary CXCL9/creatinine ratios was characterized by an AUC of 0.78.
4 DISCUSSION
The term “SCR” was introduced by Rush et al in the 1990s to refer to stable allografts displaying an interstitial infiltrate and tubulitis.18, 19 Early diagnosis of SCR is clinically relevant, given the efficiency of current immunosuppression.2 In the present cohort, all the SCRs were treated using 3 × 500 mg of intravenous methylprednisolone. The early surveillance biopsies and treatment of SCR by high doses of corticosteroids has been shown to decrease the incidence of late AR episodes and the occurrence of fibrosis, thereby improving long-term graft function in KTR.20 These observations have been confirmed in several independent studies.1, 20-22 Surveillance kidney transplant biopsies are therefore performed between 3 and 12 months post KTx in some transplant centers. However, the indication of surveillance biopsy remains debatable because it is not currently part of the Kidney Disease: Improving Global Outcomes (KDIGO) 2009 guidelines, including broad indications for per-cause biopsy. However, the KDIGO guidelines mention that “altogether, based on very-low-quality evidence, the benefit of performing protocol biopsies in CsA/azathioprine-treated patients without induction therapy may outweigh the harm.”23 This CsA/azathioprine-based immunosuppression is no longer the predominant schema and no other guidelines are currently available.
The development and validation of alternative noninvasive approaches “ruling out” SCR may help avoid biopsy-associated complications and limitations.4, 5 In the present study, we confirm that the mean uCXCL9/Cr levels significantly discriminate SCR from nonrejection, with a diagnostic threshold set at 6.75 ng/mmol. Furthermore, we show for the first time that 18F-FDG PET/CT imaging excludes SCR in stable KTR. One patient presented with moderate intimal arteritis (v1) without interstitial inflammation or tubulitis corresponding to T cell–mediated grade IIA AR according to the Banff 2017 classification. This case was characterized by a low absolute mSUV value (at 1.24) and a low mSUVR (1.33). This observation is in line with the positive correlation between mean SUV and inflammatory infiltrates and may explain the false negative rate of 18F-FDG PET/CT imaging in SCR detection. The “borderline” category is a well-known limitation of the Banff 2017 classification, with recent controversy about the tubulitis without interstitial inflammation (ie, “i0 tx”).24 An attempt to better phenotype this lesion, on the basis of molecular microscopy and omics, is currently ongoing by international consortia of experts in the field. As an example, de Freitas et al25 compared the molecular changes in kidney graft biopsies with (T cell–mediated) AR, borderline lesion, or nonrejection using microarray profiling and found that most borderline cases showed a molecular phenotype similar to nonrejection. Similarly, one may hypothesize that noninvasive bio- and/or iconomarkers may help better distinguish “borderline/normal” lesions from “borderline/rejection” lesions by reflecting the in toto intensity of the inflammation within the kidney allograft. Indeed, the histological conclusions are based (1) on a restricted volume of kidney allograft cortex (~20 mm3) with putative error sampling and (2) on a limited number of infiltrating cells with putative interobserver variability.
The limitations of our study include the limited number of patients with biopsy-proven SCR, although this number fits with the reported prevalence of SCR in the literature.23, 26 Additionally, all cases of SCR were T cell–mediated AR, which hampers the extension of our conclusions to ABMR. To reduce the drawbacks of the technique, we used optimal doses of 18F-FDG and late acquisitions of 18F-FDG PET/CT imaging to limit the quantification bias caused by the physiological urinary excretion of 18F-FDG and to improve the background/noise ratio. The volumes of interest were located beneath the renal capsule away from the urinary pelvis. The use of multiple independent 1-mL VOI distributed in lower and upper renal poles aimed to avert sampling errors and consider a large representative zone of renal parenchyma (in contrast to a focused transplant biopsy of ~20 mm3). The use of the mSUVR reduces the variability of the radiotracer biodistribution. The nature of the radiotracer explains per se the poor specificity of 18F-FDG PETCT in the differential diagnosis of inflammatory conditions. Alternative imaging techniques, including magnetic resonance imaging (MRI), renal scintigraphy and ultrasound, exploit the fact that blood flow is significantly lowered in case of AR-induced inflammation.5 By contrast, 18F-FDG PET/CT may allow a dynamic quantification of the uptake of the radiotracer by inflammatory cells characterized by an increased avidity for glucose.12, 14 Digital PET/CT are increasingly used, which may help reduce radiation exposure and improve image resolution.
The NPV values of both 18F-FDG uptake and mean uCXCL9/Cr ratios reached 98%. One may speculate that such a high NPV may lead to proposing these bio- and iconomarkers as “rule out” tests, thereby better deciding in which patient a protocol biopsy could be avoided.27 The integration of these 2 parameters, ie, the mSUVR and mean uCXCL9/Cr ratios, did not significantly improve the diagnostic yield of SCR, despite a positive significant correlation (Figure S1). The quantification of urinary CXCL9 levels is both cheaper and probably more patient-friendly compared to a PET/CT procedure. Nonetheless, the present pilot study is a proof of concept. Additional studies will evaluate the putative assets (not only cross-sectional/diagnostic but also longitudinal/predictive) of this 18F-FDG-based iconomarker, possibly combined with blood and/or urine biomarkers. The technique of 18F-FDG renal uptake quantification will most probably improve, including automated segmentation, texture analysis, and radiomics.28 Note also that 18F-FDG PET/CT provides images of the entire kidney allograft, which may help distinguish AR from pyelonephritis or kidney infarction and evaluate the global intensity of AR-associated inflammation. It must be acknowledged that surveillance biopsies may provide additional information besides AR, such as fibrosis or calcineurin inhibitor toxicity. More specifically, the 3-month ci and cv scores have been proposed as predictive markers of long-term renal functional decline and overall graft survival.29 The long-term relevance of the mSUVR and mean uCXCL9/Cr levels is unknown. Furthermore, the 3-month surveillance biopsy (and the biopsy-proven absence of any inflammatory lesions) may guide the personalization of immunosuppression, including steroid withdrawal as an example. Prospective studies about the adaptation of the immunosuppressive regimen on the basis of noninvasive tests, like the mSUVR, are needed.
In conclusion, our pilot prospective single-center study suggests that 18F-FDG PET/CT imaging may help rule out SCR in stable KTR, with a NPV of 98%. Additional prospective external and/or multicenter studies are needed to validate the mSUVR threshold and to assess the long-term clinical relevance of noninvasively evaluating the metabolic activity of kidney allograft.
ACKNOWLEDGMENTS
FJ is a Fellow of the Fonds National de la Recherche Scientifique (FNRS). This study was supported by the University of Liège Hospital (Fonds d'Investissement pour la Recherche Scientifique 2015).
DISCLOSURE
The authors of this manuscript have no conflicts of interest to disclose as described by the American Journal of Transplantation.
Open Research
DATA AVAILABILITY STATEMENT
There are no shared data in this article.


