In situ multiplex immunofluorescence analysis of the inflammatory burden in kidney allograft rejection: A new tool to characterize the alloimmune response
See also: Bellamy and Prost
Abstract
The exact composition of leukocyte infiltration during kidney allograft rejection is difficult to comprehend and visualize on the same biopsy slide. Using an innovative technology of multiplex immunofluorescence (mIF), we were able to detect simultaneously NK cells, macrophages, and T cells and to determine their intra- or extravascular localization using an endothelial marker. Twenty antibody-mediated rejection (ABMR), 20 T cell–mediated rejection (TCMR), and five normal biopsies were labeled, with automatic leukocyte quantification and localization. This method was compared to a classic NKp46 immunohistochemistry (IHC) with manual quantification and to mRNA quantification. mIF automatic quantification was strongly correlated to IHC (r = .91, P < .001) and to mRNA expression levels (r > .46, P < .021). T cells and macrophages were the 2 predominant populations involved in rejection (48.0 ± 4.4% and 49.3 ± 4.4%, respectively, in ABMR; 51.8 ± 6.0% and 45.3 ± 5.8% in TCMR). NK cells constituted a rare population in both ABMR (2.7 ± 0.7%) and TCMR (2.9 ± 0.6%). The intravascular compartment was mainly composed of T cells, including during ABMR, in peritubular and glomerular capillaries. However, NK cell and macrophage densities were significantly higher during ABMR in glomerular and peritubular capillaries. To conclude, this study demonstrates the feasibility and utility of mIF imaging to study and better understand the kidney allograft rejection process.
Abbreviations
-
- ABMR
-
- antibody-mediated rejection
-
- DSA
-
- donor-specific antibodies
-
- IHC
-
- immunohistochemistry
-
- mIF
-
- multiplex immunofluorescence
-
- NR
-
- nonrejection biopsies
-
- TCMR
-
- T cell–mediated rejection (TCMR)
-
- TSA
-
- tyramide signal amplification
1 INTRODUCTION
Histologic findings remain the key element for the diagnosis of T cell–mediated rejection (TCMR) and antibody-mediated rejection (ABMR) in kidney transplantation. According to the Banff classification,1 peritubular capillaritis (ptc), glomerulitis (g), interstitial inflammation (i), and tubulitis (t) constitute the main pathologic features of kidney allograft rejection and are characterized by the presence of “mononuclear cells” within peritubular capillaries, glomeruli, interstitium, and tubules respectively. Thus far, it is not recommended to specify the exact phenotype of these immune cells. However, different phenotypic and molecular studies2, 3 uncovered that the composition of the infiltrate may be significant. For example, the quantity of macrophages may be a predictive factor for kidney allograft loss.4, 5 Moreover, both CD20+ B lymphocyte and CD68+ macrophage (but not CD3+ T lymphocyte) densities in early surveillance biopsies inversely correlate with estimated glomerular filtration rate 4 years after transplantation.5 Consequently, the use of a panel of antibodies to determine the in situ immunopathologic component at the time of rejection diagnosis may be relevant.
To characterize an inflammatory infiltrate, pathologists generally use chromogenic immunohistochemistry (IHC) on fixed serial tissue sections. However, using serial tissue sections makes the cellular interplay and the precise location of the cells difficult to analyze. Consequently, multiplexed IHC approaches have been developed, allowing the simultaneous detection of multiple biomarkers on a single slide. In particular, a novel detection strategy based on tyramide signal amplification (TSA), on paraffin-embedded tissue section, is now available.6 Until now, this new technology has mainly been used in oncology to better characterize the in situ immune cell infiltrate in tumors.7, 8
At the same time, numerous transcriptomic studies have been performed in the field of kidney transplantation. In 2013, molecular data have been integrated into the Banff classification as a criteria for the diagnosis of ABMR.9 More specifically, recent molecular analyses uncovered the role of NK cells during kidney rejection, especially during ABMR.10, 11 Since then, NK cells are described as a key player in the pathophysiology of ABMR.12 Nevertheless, the precise in situ detection and quantification of NK cells in renal biopsies remains challenging. Indeed, numerous authors have used an anti-CD56 antibody to identify NK cells, which is not specific and can be expressed by many more types of immune cells, including alpha beta T cells, gamma delta T cells, dendritic cells, monocytes, and NKT cells.13, 14 In human, NK cells are traditionally defined as CD56+ CD3− lymphocytes,13 which means that a monostaining for CD56 is not sufficient to isolate NK cells. Conversely, the NKp46 marker, which belongs to the family of natural cytotoxicity receptors with NKp44 and NKp30, is a much more specific marker for NK cells.15, 16 In human spleen, it was estimated that T cells expressing NKp46 were almost undetectable whereas up to 8% of CD3+ cells expressed the CD56 marker.15
We hypothesized that the composition and localization of immune cells are different between ABMR and TCMR. The aim of this study was to compare the phenotype and the repartition (intra- or extravascular, glomerular or intraperitubular capillaries) of the inflammatory burden during ABMR and TCMR, by using a multiplex immunofluorescent approach in the same paraffin-embedded section. In particular, we targeted NK cells, T lymphocytes, macrophages, and endothelial cells using anti-NKp46, anti-CD3, anti-CD163, and anti-CD34 antibodies respectively.
2 MATERIALS AND METHODS
2.1 Study population
Computerized biopsy registries from 2 French hospitals were screened to identify renal allograft biopsies with a histological diagnosis of pure ABMR or pure TCMR according to the Banff 2017 criteria.9 Biopsies were either protocol (at 3 and 12 months) or for-cause biopsies.
For ABMR, biopsies with at least moderate microvascular inflammation ([g + ptc] ≥ 2) and presence of circulating donor-specific antibodies (DSA) at the time of biopsy and/or positivity for C4d were included. Four cases of suspected acute/active ABMR, defined by at least moderate microvascular inflammation ([g + ptc] ≥ 2), but without circulating DSA at the time of biopsy nor positivity for C4d, were also included. Biopsies with an interstitial inflammation involving > 10% of the total cortex (ti > 0) or an interstitial inflammation involving > 10% of nonsclerotic cortical parenchyma (i > 0) were excluded.
For TCMR, biopsies fulfilling the criteria for acute TCMR – interstitial inflammation involving > 25% of nonsclerotic cortical parenchyma (i2 or i3) with moderate (t2) or severe (t3) tubulitis) or chronic active TCMR (interstitial inflammation involving > 25% of the total cortex (ti2 or ti3) and > 25% of the sclerotic cortical parenchyma (i-IFTA score 2 or 3) with moderate (t2) or severe (t3) tubulitis – were included. Cases with glomerulitis (g ≥ 0) were excluded.
Control biopsies (NR) were randomly selected (preimplantation, protocol or indication biopsies graded as category 1 according to the Banff classification).
All participating patients provided written informed consent.
2.2 Conventional immunohistochemistry (IHC)
Paraffin-embedded tissue sections were manually immunostained against NKp46 (clone 8E5B,17 dilution 1:4000, Innate Pharma, Marseille, France) using the ABC peroxidase procedure as previously described.18 Sections from normal human spleen and tonsils were used as positive controls. Labeled NK cells were manually counted at high power field ×40.
2.3 Multiplex immunofluorescence (IF) staining
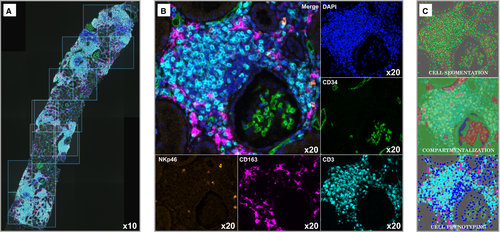
We set up a multiplex immunofluorescence staining (Figure 1A,B) using Opal reagents (PerkinElmer, Waltham, MA). Opal is a method for multiplex immunofluorescence in paraffin-embedded tissue. It is a tyramide-based method involving deposition of fluorophore-conjugated tyramide at the site of the antigen of interest, effectively amplifying the signal. The permanent nature of the tyramide-antigen bond, accomplished through its covalent binding with tyrosine residues on the antigen of interest allows for heat-mediated removal of antibodies, but preservation of the fluorescence signal associated with the antigen of interest. In this manner, sequential applications of targeted antibodies can be utilized with the flexibility of using multiple antibodies raised in the same species, without concern for the cross-reactivity.
Briefly, 3-4 µm thick paraffin-embedded tissue sections were deparaffinized in xylene, rehydrated through an ethanol gradient and fixed in 10% neutral-buffered formalin for 20 minutes. Antigen retrieval was performed using microwave treatment (MWT) for 15 minutes in antigen retrieval solution pH6 or pH9 (AR6 or AR9) according to the target being detected. At each of the four cycles of staining, primary antibodies anti-NKp46 (clone 8E5B,17 Innate Pharma), anti-CD163 (clone 10D6, Leica Biosystems), anti-CD34 (clone QBEnd-10, Dako), and anti-CD3 (clone SP7, Thermo scientific) were incubated for 30 minutes or 1 hour at room temperature or +37°C, followed by Opal Polymer HRP Ms + Rb Kit (PerkinElmer) for 10 minutes at room temperature. Next, tissue sections were incubated with TSA opal fluorophores (Opal 620, 690, 520 and 540) for 10 minutes (Table 1). MWT was performed at each cycle of staining to remove antibody-TSA complex with AR6 or AR9. Finally, all slides were counterstained with DAPI for 5 minutes. Sections from normal human spleen and tonsils were used as positive controls.
| Position | Antigen retrieval (AR) | Antibody | Primary antibody | TSA Opal fluorophore | |||||
|---|---|---|---|---|---|---|---|---|---|
| Clone | Vendor | Dilution | Incubation time | Incubation temperature | Opal fluorophore | Dilution | |||
| #1 | AR pH9 | NKp46 | Clone 8E5B | Innate Pharma | 1:4000 | 60 min | +37°C | Opal 620 | 1:50 |
| #2 | AR pH6 | CD163 | Clone 10D6 | Leica Biosystems | 1:250 | 60 min | RT | Opal 690 | 1:50 |
| #3 | AR pH6 | CD34 | Clone QBEnd-10 | Dako | 1:100 | 60 min | RT | Opal 520 | 1:50 |
| #4 | AR pH6 | CD3 | Clone SP7 | Thermo Scientific | 1:500 | 30 min | RT | Opal 540 | 1:200 |
- RT, room temperature; Min, minutes; TSA, tyramide signal amplification.
The detailed protocol is given in Figure S1.
2.4 Images collection
Whole slides (cortex + medulla) were scanned using the PerkinElmer Vectra (v3.0; PerkinElmer) at low magnification (×10). Under pathologist supervision, the renal cortex was sampled from individual consecutive fields or regions of interest (ROI) measuring 669 µm × 500 µm (0.3345 mm2 each) by using the Phenochart 1.0.4 viewer (PerkinElmer) to scan at high resolution (×20) (Figure 1A). The medulla was not scanned at high resolution. For ABMR and TCMR biopsies, the whole cortex was scanned except for artifact regions (ABMR 72.4 ± 3.9% of the cortex, TCMR 77.2 ± 4.0% of the cortex, P = .37). For NR biopsies, the renal cortex was randomly sampled to analyze at least 50% of the entire cortex (52.4 ± 7.6%). The total surface of renal cortex was used to calculate the cellular density (ie, number of immune cells/mm2).
2.5 Fluorescence analysis and automated cell count
The 45 renal biopsies were analyzed using the software inForm Tissue Finder 2.3.0 (PerkinElmer). Only scanned images at ×20 (ROI fields) were analyzed by inForm.19 This software is based on a supervised machine-learning algorithm. The full procedure is detailed in Figures S2 and S3.
Briefly, the first step consists of creating a “spectral library” as recommended for multiplex analysis: single-stained (CD34, NKP46, CD3, CD163) and unstained slides were analyzed in inForm to integrate the corresponding spectra in a spectral library. The spectral library eliminates fluorophore crosstalk and interference from tissue autofluorescence, allowing precise measurement of each fluorescence signal within a tissue sample.
The second step is the creation of a training set called a “project” containing representative images of the total ROI scanned. This “project” is ultimately used at the end of the study for the “batch analysis,” that is, the final analysis of all the images of the cohort. The representative images are opened using the spectral library then a three-step machine-learning algorithm is performed: tissue segmentation, cell segmentation, and cell phenotyping. The “tissue segmentation” consists to train the software to recognize intravascular and extravascular areas based on the CD34 labeling. The “cell segmentation” consists to train the software to identify every individual cell, based on the recognition of the nuclei using a counterstain-based approach (DAPI). Lastly, the “cell phenotyping” consists in the recognition of different cell subtypes based on CD3, CD163, and NKp46 labeling. Basically, the pathologist identifies at least 5 cells in each phenotype in order to proceed. We chose 376 CD3+ cells, 339 NKp46+ cells, and 380 CD163+ cells. We also chose 412 “other cells” (ie, CD3− NKp46− CD163−).
At the end of the training of the project, a batch analysis is performed after opening all the images of the entire cohort, and we obtain an absolute cell count of each individual cell subtype and their localization.
To further distinguish between glomerular and peritubular capillaries, we manually counted and phenotyped the cells within the glomeruli on every image of the study.
2.6 RNA extraction and real-time quantitative reverse transcription PCR
Total RNA was isolated from all biopsies with frozen tissue sample available, using the miRNeasy Mini Kit (Qiagen, Hilden, Germany) and used to make cDNA using a mix containing RNAse inhibitor, dNTP mix, Random Hexamer, MgCl2 Solution, and MultiScribe Reverse Transcriptase (all from Thermo Fisher, Waltham, MA). PCR reactions were assembled with TaqMan 2x Fast Univ. PCR Master Mix (Thermo Fisher) and predeveloped TaqMan gene expression assays or “home-designed” primers and probes purchased from Thermo Fisher (Table S1). mRNA levels of NKp46 and KLRF1 (NK cells), CD3 and CD25 (T cells), and CD14, CD16, CD68, and CD163 (monocytes/macrophages) were detected by real-time qPCR on a ViiA7 Real-Time system using QuantStudio Real-Time PCR software (Thermo Fisher). Gene expression levels were normalized to the mean of GAPDH and HPRT1 mRNAs, and 18S rRNA. The ΔΔCt method was used to calculate relative expression using human spleen total RNA as reference (AM7970, Thermo Fisher).
2.7 Statistical analysis
Statistical analyses were performed using RStudio, version 1.1.456 for Mac OS X. We compared means between 2 groups using the Mann-Whitney U test, and means among three groups using the Kruskal-Wallis test followed by the Dunn's post-hoc test with Bonferroni adjustment. We compared proportions using the Fisher exact test. Correlation coefficients were determined using Spearman's Rank-Order Correlation. Unless noted otherwise, results are expressed as mean ± SEM.
3 RESULTS
3.1 Description of the study population
The study population consisted of 45 renal allograft biopsies in 44 patients (demographic data are detailed in Tables 2 and 3). The biopsies were performed at a median time of 5.0 months posttransplantation (interquartile range: 1.0-28.0 months). The mean estimated glomerular filtration rate (eGFR) was 41.3 ± 3.6 mL/min/1.73 m2 at the time of rejection diagnosis. Primary pathological diagnoses were 20 ABMR, 20 TCMR, and 5 NR. The mean number of glomeruli and the mean surface of biopsy were 11.3 ± 0.9 and 4.7 ± 0.3 mm2, respectively, with no significant difference between the three groups (Kruskal-Wallis, P = .90 and .81). The mean follow-up duration for the cohort was 53.6 ± 7.8 months. During the follow-up, one patient died and five patients lost their graft. All graft losses were attributed to rejection.
| Variables |
All patients N = 44 |
NR N = 5 |
ABMR N = 20 |
TCMR N = 19b |
P value |
|---|---|---|---|---|---|
| Recipient | |||||
| Age (y) | 44.2 ± 2.9 | 41.4 ± 11.2 | 47.2 ± 3.8 | 41.7 ± 4.7 | .63 |
| Gender (male, n, %) | 27 (61.4) | 2 (40.0) | 11 (55.0) | 14 (73.7) | .30 |
| Retransplantation (n, %) | 4 (9.1) | 0 (0.0) | 2 (10.0) | 2 (10.5) | 1 |
| Cause of end-stage renal disease (n, %) | |||||
| Diabetes | 2 (4.5) | 0 (0.0) | 1 (5.0) | 1 (5.3) | 1 |
| Hypertension | 3 (6.8) | 0 (0.0) | 1 (5.0) | 2 (10.6) | .73 |
| Glomerular diseases | 8 (18.2) | 0 (0.0) | 7 (35.0) | 1 (5.3) | .03 |
| Interstitial nephropathies | 8 (18.2) | 3 (60.0) | 1 (5.0) | 4 (21.0) | .02 |
| Cystic/hereditary/congenital | 8 (18.2) | 0 (0.0) | 4 (20.0) | 4 (21.0) | .74 |
| Miscellaneous/etiology uncertain | 15 (34.1) | 2 (40.0) | 6 (30.0) | 7 (36.8) | .91 |
| Donor | |||||
| Age (y) | 44.2 ± 3.3 | 45.8 ± 9.6 | 48.1 ± 4.6 | 39.9 ± 5.4 | .48 |
| Deceased (n, %) | 33 (75) | 4 (80.0) | 14 (70) | 15 (78.9) | 1 |
| Expanded criteria donora (n, %) | 9 (27) | 1 (25) | 5 (36) | 3 (20) | .74 |
| Transplantation | |||||
| Cold ischemia timea (h) | 18.8 ± 1.5 | 15.6 ± 5.0 | 22.0 ± 1.9 | 17.0 ± 2.2 | .04 |
| Delayed graft function (n, %) | 7 (16) | 0 (0.0) | 5 (25) | 2 (10.5) | .30 |
| Outcome | |||||
| Follow-up posttransplantation (mo) | 53.6 ± 7.8 | 18.8 ± 3.1 | 66.0 ± 15.1 | 49.8 ± 7.5 | .07 |
| Serum creatinine at last follow-up (µmol/L) | 213.5 ± 29.2 | 103.6 ± 22.7 | 200.8 ± 39.3 | 258.2 ± 52.5 | .11 |
| Estimated GFRa, mL/min/1.73 m2 | 47.1 ± 4.7 | 56.5 ± 10.5 | 44.0 ± 5.0 | 48.6 ± 9.2 | .58 |
| Proteinuria (g/g creatininuria) | 0.27 ± 0.05 | 0.25 ± 0.09 | 0.33 ± 0.08 | 0.21 ± 0.07 | .39 |
| Death (n, %) | 1 (2.3) | 0 (0.0) | 0 (0.0) | 1 (5.3) | .55 |
| Retransplantation | 0 (0.0) | 0 (0.0) | 0 (0.0) | 0 (0.0) | NA |
| Dialysis | 5 (11.4) | 0 (0.0) | 2 (10.0) | 3 (15.8) | .82 |
- Unless noted otherwise, results are expressed as mean ± SEM.
- NA, not applicable; ABMR, antibody-mediated rejection; GFR, glomular filtration rate; NR, nonrejection biopsies; TCMR, T cell–mediated rejection.
- a For deceased donors only.
- b One patient had 2 TCMR.
| Variables |
All biopsies N = 45 |
NR N = 5 |
ABMR N = 20 |
TCMR N = 20 |
P value |
|---|---|---|---|---|---|
| Clinico-biological characteristics | |||||
| Time post transplantation (median, range) | 5.0 (0.0 - 205.0) | 3.0 (0.0 - 16.0) | 7.5 (0.0 - 205.0) | 7.0 (0.0 - 101.0) | .43 |
| Serum creatinine (µmol/L) | 212.4 ± 22.2 | 108.2 ± 18.5 | 208.3 ± 32.7 | 242.5 ± 36.0 | .06 |
| Estimated GFRa, mL/min/1.73 m2 | 41.3 ± 3.6 | 64 ± 14.4 | 38.3 ± 4.7 | 38.6 ± 5.1 | .19 |
| Proteinuria (g/g creatininuria) | |||||
| Immunology | |||||
| DSA at time of biopsy (n, %) | 21 (46.6) | 1 (20.0) | 13 (65.0) | 7 (35.0) | .07 |
| DSA Class I (n, %) | 6 (13.3) | 1 (20.0) | 2 (10.0) | 3 (15.0) | .23 |
| DSA Class II (n, %) | 11 (24.4) | 0 (0.0) | 8 (40.0) | 3 (15.0) | .12 |
| DSA Class I + II (n, %) | 4 (8.9) | 0 (0.0) | 3 (15.0) | 1 (5.0) | .76 |
| iDSA MFI | 3074.9 ± 908.6 | 299.4 ± 299.4 | 4549.5 ± 1637.5 | 2289.2 ± 1160.0 | .08 |
| Histologic characteristics | |||||
| Surface of biopsy (mm2) | 4.7 ± 0.3 | 4.2 ± 0.8 | 4.7 ± 0.4 | 4.9 ± 0.6 | .81 |
| Number of glomeruli | 11.3 ± 0.9 | 12.6 ± 5.0 | 11.3 ± 1.2 | 11.0 ± 1.2 | .90 |
| Banff scoresb | |||||
| Glomerulitis (g) | 0.8 ± 0.1 | 0.2 ± 0.2 | 1.7 ± 0.2 | 0 ± 0.0 | <.001 |
| Peritubular capillaritis (ptc) | 1.3 ± 0.2 | 0 ± 0.0 | 2.3 ± 0.1 | 0.6 ± 0.2 | <.001 |
| Interstitial inflammation (i) | 0.9 ± 0.2 | 0 ± 0.0 | 0 ± 0.0 | 2.1 ± 0.2 | <.001 |
| Tubulitis (t) | 1.4 ± 0.2 | 0 ± 0.0 | 0.2 ± 0.2 | 2.9 ± 0.1 | <.001 |
| Total inflammation (ti) | 1.0 ± 0.2 | 0 ± 0.0 | 0 ± 0.0 | 2.4 ± 0.1 | <.001 |
| Intimal arteritis (v) | 0.2 ± 0.1 | 0 ± 0.0 | 0.3 ± 0.2 | 0.1 ± 0.1 | .37 |
| Interstitial fibrosis and tubular atrophy (IF/TA) | 0.7 ± 0.2 | 0 ± 0.0 | 0.8 ± 0.2 | 0.9 ± 0.3 | .21 |
| C4d deposition | 0.6 ± 0.2 | 0 ± 0.0 | 1.2 ± 0.3 | 0.3 ± 0.1 | .03 |
- Unless noted otherwise, results are expressed as mean ± SEM.
- ABMR, antibody-mediated rejection; DSA, donor-specific antibodies; GFR, glomular filtration rate; iDSA, immunodominant DSA; NA, not applicable; NR, nonrejection biopsies; TCMR, T cell–mediated rejection.
- a Calculated with the Chronic Kidney Disease Epidemiology Collaboration (CKD-EPI) equation or the Schwartz equation, depending on the age of the patient at the time of biopsy.
- b Banff scores (0: no significant lesion; 1: mild; 2: moderate; 3: severe).
3.2 Multiplex IF is a reliable technology to study the alloimmune response in kidney transplantation
To characterize the allograft inflammation during rejection, we developed an in situ mIF technique with automated counting (Figure 1). NKp46, CD3, and CD163 positive cells were quantified in the renal cortex only, using consecutive individual fields scanned at ×20.
To validate this new strategy, we also realized an anti-NKp46 labeling using conventional IHC on a serial tissue section (Figure 2A) and an RT-qPCR from a frozen sample obtained at the same time to compare cellular densities (ie, number of cells/mm2) (Figure 2B) and gene expression levels (Figure 2C). Among the 45 included biopsies, a frozen sample was available for RT-qPCR for 24 biopsies (11 ABMR, 10 TCMR, and 3 NR).
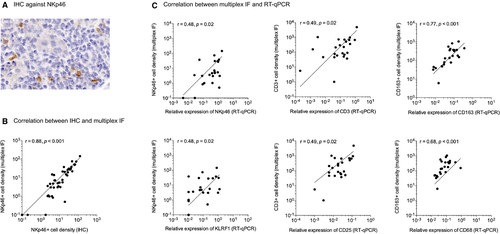
We first correlated the NKp46+ cell density manually measured by IHC to the NKp46+ cell density automatically measured by mIF (Figure 2B) and found a strong positive correlation between the 2 techniques (r = .91, P < .001). Then we correlated the densities of NKp46+, CD3+, and CD163+ cells measured by mIF to the relative mRNA expression levels of NKp46 and KLRF1 (for NK cells), CD3 and CD25 (for T cells), and CD14, CD16, CD68, and CD163 (for monocytes/macrophages) measured by RT-qPCR (Figure 2C). For all the tested genes, we found a positive correlation between the two techniques (r between .47 and .61, P value between .001 and .021).
3.3 CD163, CD3, and NKp46 positive cells are recruited during kidney allograft rejection
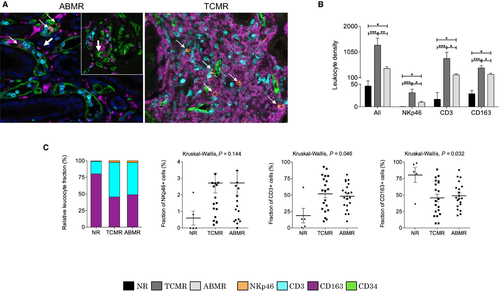
Using mIF, we first analyzed whether leukocyte densities were associated with rejection (Figure 3B). Figure 3A illustrates 2 images obtained during ABMR and TCMR, with the visualization of extravascular and intravascular inflammatory cells based on the CD34 staining. We found that the total immune cell density was low in NR biopsies (45.8 ± 19.6/mm2) and significantly increased during ABMR (435.1 ± 70.1/mm2) and TCMR (1303.2 ± 254.3/mm2), with significantly more immune cells in TCMR than ABMR (P = .003) (Figure 3B). NKp46, CD3, and CD163+ cells were significantly more abundant in grafts with either ABMR or TCMR compared to NR biopsies and were higher in TCMR compared to ABMR. In particular, the NKp46+ cell density was higher in TCMR (31.7 ± 7.8/mm2) compared to ABMR (9.6 ± 2.2/mm2, P = .01). In term of relative proportions, CD3 and CD163+ cells were the 2 predominant cell types involved in both ABMR and TCMR (51.8 ± 6.0% and 45.3 ± 5.8% in TCMR respectively; 48.0 ± 4.4% and 49.3 ± 4.4% in ABMR respectively) (Figure 3C). Conversely, NKp46+ cells represented a rare population (NR: 0.6 ± 0.4%; ABMR: 2.7 ± 0.7%; TCMR: 2.9 ± 0.6%), with no significant difference between ABMR and TCMR (P = .58).
3.4 The composition of the inflammatory infiltrate is different between the intravascular and extravascular compartments
After a period of machine learning by a pathologist, the image analysis software was able to distinguish the intravascular (ie, glomerular and peritubular capillaries) and extravascular compartments, according to the CD34 labeling as endothelial cell marker (Figure 1C). Using this marker, the localization (intra- or extravascular) of each cell was determined.
CD3+ and CD163+ cells were the 2 predominant cell types in the extravascular compartment (Figure 4A), for both TCMR (CD3: 708.1 ± 207.2/mm2; CD163: 456.2 ± 89.3/mm2) and ABMR (CD3: 108.2 ± 26.8/mm2; CD163: 205.5 ± 45.8/mm2). On the other hand, CD3+ cells were the predominant cell type in the intravascular compartment (Figure 4C) for both TCMR (CD3: 89.4 ± 2.6%; CD163: 7.8 ± 2.5%; NKp46: 2.8 ± 0.8%) and ABMR (CD3: 79.3 ± 3.8%; CD163: 15.4 ± 3.6%; NKp46: 5.3 ± 1.2%).
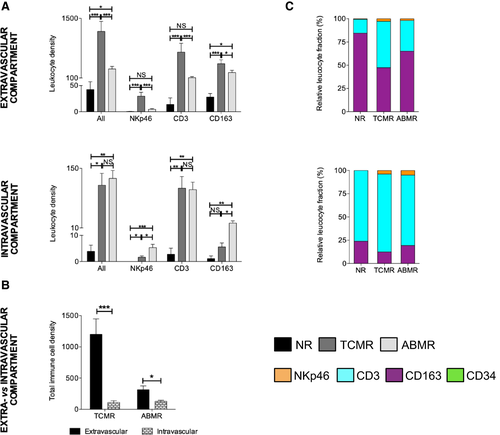
Interestingly, NK cells and macrophages densities were significantly higher in the intravascular compartment during ABMR compared to TCMR (5.0 ± 1.2/mm2 vs 1.5 ± 0.5/mm2 for NK cells (P = .006) and 14.5 ± 3.1/mm2 vs 5.0 ± 1.5/mm2 for macrophages (P = .013)).
As expected, we observed much more leukocytes in the extravascular compartment than in the intravascular compartment during TCMR (1194.5 ± 234.7/mm2 vs 108.7 ± 28.0/mm2, P < .001) (Figure 4B). But surprisingly, we made the same observation in ABMR (318.3 ± 62.9/mm2 vs 116.8 ± 18.4/mm2, P = .012), even if the difference was less pronounced, and despite the fact that we included only ABMR cases with less than 10% of interstitial inflammation in the nonatrophic cortex (i-score = 0) or in the total cortex (ti = 0). In ABMR, a careful analysis of all the images of the cohort showed that even if we observed numerous immune cells in the intravascular compartment (ie, glomerulitis and peritubular capillaritis), there were also many leukocytes in the extravascular compartment, in particular around the vessels.
3.5 Differential composition of the microcirculation inflammation in peritubular and glomerular capillaries
Distinction between microcirculation compartments revealed a significantly higher total leucocyte density within the glomerular compartment during ABMR compared to TCMR (18.8 ± 5.6 vs 2.2 ± 0.4, P < .001) (Figure 5A). We did the same observation for each cell type, with higher NKp46+, CD3+, and CD163+ glomerular cell densities during ABMR. Furthermore, we did not observe a significant difference between TCMR and NR biopsies regarding the total leucocyte density in the glomeruli (2.2 ± 0.4 vs 0.3 ± 0.2, P = .06).
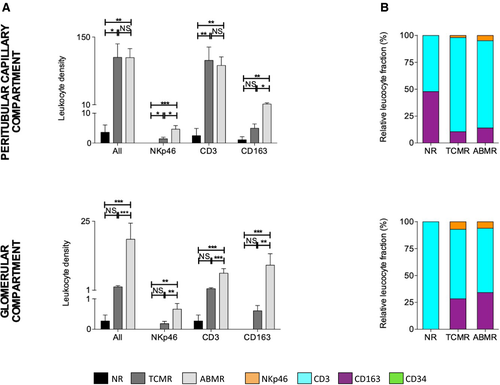
On the other hand, we did not find any significant difference concerning the total leukocyte density within the peritubular capillary compartment between ABMR and TCMR (107.6 ± 18.4 vs 108.2 ± 27.9, P = .36) (Figure 5A). However, we found more NKp46+ cells and CD163+ cells in the peritubular capillaries during ABMR than TCMR (4.7 ± 1.2 vs 1.5 ± 0.5, P = .01 and 11.6 ± 2.5 vs 5.0 ± 1.5, P = .02, respectively).
CD3+ cells were the predominant cell type in the peritubular capillaries and glomeruli (Figure 5B), for both TCMR (peritubular capillaries: CD3 87.6 ± 3.3%; CD163 10.5 ± 3.3%; NKp46 2.0 ± 0.6%; glomeruli: CD3 64.6 ± 7.9%; CD163 28.4 ± 6.8%; NKp46 7.1 ± 3.4%) and ABMR (peritubular capillaries: CD3 81.1 ± 3.5%; CD163 14.0 ± 3.3%; NKp46 4.8 ± 0.9%; glomeruli: CD3 59.8 ± 5.9%; CD163 34.2 ± 6.0%; NKp46 6.1 ± 1.9%).
We correlated the total immune cell densities with the respective Banff inflammatory components (ie, correlation between glomerular density and glomerulitis score, peritubular capillary density and peritubular capillaritis score, and extravascular density and inflammation score). The results showed a good correlation between glomerular density and glomerulitis, as well as between the extravascular density and the “i” score. However, the correlation was not as good for peritubular capillaritis, due to the presence of many inflammatory cells within the peritubular capillaries during TCMR, in the inflammation clusters (Figure S4).
3.6 Important heterogeneity in the global composition of the inflammatory burden during renal allograft rejection
Interestingly, we observed an important heterogeneity in the proportion of CD3+ cells and CD163+ cells whatever the type of rejection (Figure 6A). Variations between the highest and the lowest fraction of CD3+ cells ranged from 10.0% to 92.7% for TCMR and from 9.9% to 81.0% for ABMR, whereas for CD163+ cells, the variations ranged from 7.0% to 89.0% for TCMR and from 18.8% to 87.7% for ABMR (Figure 6A). These extreme situations are illustrated in Figure 6B.
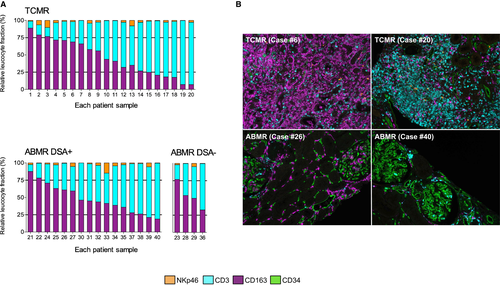
We did not observe any difference between ABMR DSA- (n = 16) and ABMR DSA+ (n = 4) cases (Figure 6A). Furthermore, a patient with TCMR rejection had 2 biopsies 1 month apart (biopsies #10 and 11) and we did not observe a significant difference in the global immune composition between the 2 biopsies (Figure 6A).
We compared clinical, biological, and histological data between rejection biopsies with high and low proportion of CD163, CD3, and NKp46 cells, respectively, according to the median percentage of each cell type (44.4% for CD163, 53.0% for CD3, and 2.1% for NKp46 positive cells) (Table S2). Despite a trend toward significance regarding the time of biopsy in T cell-enriched cases compared to low T cell rejection cases (40.5 ± 11.6 vs 20.6 ± 11.0 months, P = .071), we could not find any significance differences between groups.
4 DISCUSSION
This study establishes the feasibility of detecting 4 distinct markers in a same tissue section in the field of allograft transplantation. This mIF method can be used on fixed paraffin-embedded biopsies and consequently can be easily applied on routine material. Furthermore, the TSA detection allows the use of unlabeled primary antibodies raised in the same species, which solves one of the main limits of the previous multiplex approaches. Together with mIF, we used multispectral image analysis software for automated counting and compartmentalization, significantly improving reproducibility between the cases. This new technology (mIF + image analysis software) constitutes an essential complement to transcriptomic analyses in transplantation for the understanding of the pathophysiology of allograft rejection. Indeed, most of the current molecular approaches are based on averaged gene expressions, which mask single-cell transcriptomic heterogeneity,20 and of course do not allow correlation with morphological features. On the other hand, our approach enables to analyze the phenotype of each single cell and to describe the tissue morphology and the cellular interplay in a same tissue section.
In this study, CD3 and CD163 positive cells were the 2 predominant cell types involved during either T cell–mediated or antibody-mediated rejection. Furthermore, we confirmed the presence of NK cells during allograft rejection, not only in ABMR, but also in TCMR despite that NK cells represented a small cluster, around 3% for the 2 types of rejection. The recruitment of NK cells during allograft rejection has been first described by transcriptomic analyses. Indeed, Hidalgo et al10 observed a high NK cell transcript expression during ABMR (genes: CX3CR1, MYBL1, FGFBP2, KLRF1, SH2D1B, and GNLY) but also during TCMR in early biopsies.11 However, some of the transcripts previously used are not specific for NK cells. In a single-cell RNA sequencing study of a human kidney allograft biopsy with mixed rejection,21 CX3CR1 and GNLY were indeed overexpressed in monocytes and T lymphocytes respectively. Moreover, no NK cells were found in this study evaluating 8746 single-cell transcriptomes.21 In view of the fact that we found many macrophages and T lymphocytes in both ABMR and TCMR, these “NK cell transcripts” may be difficult to interpret. In our study, we used the membrane marker NKp46, which targets NK cells with a very high specificity and is evolutionary conserved in mammals.15, 16 NKp46 is also expressed by innate lymphoid cells (ILC), especially ILC3,22 but ILC so far do not seem to be implicated in rejection.21, 23
Regarding the macrophage quantification, we used the marker CD163 in place of CD68, the latter being the most well-known pan-macrophage marker, because of an overall stronger intensity of staining as well as a cleaner background with CD163 compared to CD68. This experience with the quality of CD163 immunohistochemistry is in agreement with other investigators.24-26 We observed an excellent correlation between CD163+ cell density in mIF and relative mRNA expression level of CD68 as well as between mRNA expression levels of CD68 and CD163 (r = .83, P < .001). Furthermore, even if it has been shown that CD163 is expressed on anti-inflammatory/tolerogenic and profibrotic macrophages (M2 macrophages), a recent study showed that many CD163+ cells co-expressed the nuclear factor STAT1 (which is a M1 macrophage marker) in conditions associated with Th1-predominant immune responses, demonstrating that CD163 cannot be considered a reliable M2 marker when used on its own.27 Consequently, we believe that using CD163 as a marker for macrophages did not introduce a significant bias compared to CD68 in this study.
In addition to quantification, we were able to perform a topological analysis using an endothelial marker to distinguish the intravascular and extravascular compartments. Interestingly, despite small proportions, we found a higher density of NK cells and macrophages within the intravascular glomerular and peritubular capillary compartment during ABMR compared to TCMR, which is consistent with the suspected role of intravascular NK cells during ABMR, through antibody-dependent cell cytotoxicity and missing self-theory.28 This point is in support of current understandings of ABMR and further corroborates the value of this technique. Furthermore, despite the fact that we included “pure” ABMR cases, we detected numerous leukocytes in the extravascular compartment during ABMR, which is consistent with other studies in the field of kidney4 and heart transplantation.29 This point highlights the difficulty of precisely localize the cells without an endothelial marker, especially macrophages. Moreover, we observed important differences in the composition of inflammation between the intravascular and extravascular compartment. Indeed, whereas the extravascular compartment was composed of both T lymphocytes and macrophages, the intravascular compartment was mainly composed of T lymphocytes. This is consistent with a previous phenotypic study in the field of heart transplantation,29 where Fedrigo et al also quantified many T lymphocytes within the capillaries during ABMR. These data stress the role of T cells in the pathophysiology of antibody-mediated rejection.
We observed an important heterogeneity in the global composition of the inflammatory burden during renal allograft rejection. Indeed, for both TCMR and ABMR, the balance between lymphocytes and macrophages was variable, with cases enriched in CD3 positive cells and others enriched in CD163+ cells. We could not find any significant differences between those cases, probably because of the size of our cohort. This heterogeneity may have a clinical importance and needs to be further explored in a larger cohort of patients, in particular its determinants and its prognostic value. In view of these findings, it appears interesting to better characterize the immunopathologic component during rejection using a panel of antibodies at the time of diagnosis.
Finally, despite interesting results, some technical issues should be raised. First, this technique was time consuming in order to find the best order to apply the antibodies, as well as to determine the antibody dilutions and antibody/fluorophore combinations. Second, accurate cellular segmentation and phenotyping in highly clustered regions were challenging due to 3-dimensional axial overlap. Third, the tissue segmentation based on CD34 staining was also sometimes difficult. Indeed, the close perivascular region could be considered as intravascular and few cells, in close contact with the endothelial staining, may have been considered as intravascular. However, this segmentation step was similarly applied to all the slides and we believe that it did not introduce a significant bias in our analysis.
In conclusion, multiparametric IF analysis with automated counting constitutes a novel approach to characterize and quantify cell populations in tissue. Although this methodology needs to be validated in other cohorts, our work brings evidence of its applicability in the field of solid organ transplantation. Multiparametric IF may be a powerful tool to better understand allograft rejection, as a companion and a morphological support to other -omics.
ACKNOWLEDGMENTS
This work was supported by a grant from the French “Agence de la Biomédecine (ABM)” and the “Fondation pour la recherche médicale (FRM)” (no. DEA20170638449). Furthermore, the authors are indebted to the Emmanuel Boussard Foundation, whose generous funding supports the research in nephrology and kidney transplantation at Necker Hospital. We thank Chantal Mandet for her valuable technical assistance and Innate Pharma for monoclonal antibody against NKp46.
DISCLOSURE
The authors of this manuscript have no conflicts of interest to disclose as described by the American Journal of Transplantation.
Open Research
DATA AVAILABILITY STATEMENT
The data that support the findings of this study are available from the corresponding author upon reasonable request.


