A Comprehensive Analysis of the Cellular and EBV-Specific MicroRNAome in Primary CNS PTLD Identifies Different Patterns Among EBV-Associated Tumors
Abstract
Primary central nervous system (pCNS) posttransplant lymphoproliferative disorder (PTLD) is a complication of solid organ transplantation characterized by poor outcome. In contrast to systemic PTLD, Epstein–Barr virus (EBV)-association of pCNS PTLD is almost universal, yet viral and cellular data are limited. To identify differences in the pattern of EBV-association of pCNS and systemic PTLD, we analyzed the expression of latent and lytic EBV transcripts and the viral and cellular microRNAome in nine pCNS (eight EBV-associated) and in 16 systemic PTLD samples (eight EBV-associated). Notably although 15/16 EBV-associated samples exhibited a viral type III latency pattern, lytic transcripts were also strongly expressed. Members of the ebv-miR-BHRF1 and ebv-miR-BART clusters were expressed in virtually all EBV-associated PTLD samples. There were 28 cellular microRNAs differentially expressed between systemic and pCNS PTLD. pCNS PTLD expressed lower hsa-miR-199a-5p/3p and hsa-miR-143/145 (implicated in nuclear factor kappa beta and c-myc signaling) as compared to systemic PTLD. Unsupervised nonhierarchical clustering of the viral and cellular microRNAome distinguished non-EBV-associated from EBV-associated samples and identified a separate group of EBV-associated pCNS PTLD that displayed reduced levels of B cell lymphoma associated oncomiRs such as hsa-miR-155, -21, -221 and the hsa-miR-17-92 cluster. EBV has a major impact on viral and cellular microRNA expression in EBV-associated pCNS PTLD.
Abbreviations
-
- BART
-
- BamHI-A rightward transcript
-
- DLBCL
-
- diffuse large B cell lymphoma
-
- EBV
-
- Epstein–Barr virus
-
- FFPE
-
- formalin-fixed, paraffin-embedded
-
- IS
-
- immunosuppression
-
- ISH
-
- in situ hybridization
-
- LCL
-
- lymphoblastoid cell line
-
- LMP
-
- latent membrane protein
-
- NFκB
-
- nuclear factor kappa-light-chain-enhancer of activated B cells
-
- OS
-
- overall survival
-
- pCNS
-
- primary central nervous system
-
- PTLD
-
- posttransplant lymphoproliferative disorder
-
- qRT-PCR
-
- quantitative real-time polymerase chain reaction
-
- SOT
-
- solid organ transplantation
Introduction
Primary central nervous system (pCNS) posttransplant lymphoproliferative disorder (PTLD) is a rare complication after solid organ transplantation (SOT) frequently affecting adult renal transplant recipients. Most pCNS PTLD are classified as monomorphic lymphomas 1, 2 with diffuse large B cell lymphoma (DLBCL) being the most frequent subtype 1, 2. More than 90% of pCNS PTLD cases show Epstein–Barr virus (EBV)-association by immunohistochemistry 3. pCNS PTLD frequently involves multiple supra-tentorial sites causing nonspecific neurological symptoms such as headache, dizziness or personality changes 1, 4. The majority of pCNS PTLDs (>80%) occur late after transplantation (>1 year) and >30% occur very late (>10 years). In systemic DLBCL-PTLD after adult SOT the rate of EBV-association is about 50% overall and less than 10% in late cases 5, 6. Therefore, pCNS PTLD has been suggested to represent a distinct entity within the PTLD family 1. Currently, there is no consensus on treatment, but response rates to reduction of immunosuppression (IS) alone are low and rituximab monotherapy does not result in long lasting remission. High-dose methotrexate and whole brain irradiation—either alone or in combination with rituximab—results in response rates of up to 60% with a 3-year progression free and overall survival (OS) of 43% and 34%, respectively 2, 7.
EBV is a strong but not exclusively lymphotropic virus that has been implicated in the development of multiple types of lymphomas and carcinomas 8. After primary infection EBV latently infects memory B cells. While a restricted expression of viral latent proteins is found in immunocompetent individuals, an expression of all nine latent proteins can be found in immunocompromised patients. Latency often is interrupted by EBV reactivation resulting in intercurrent expression of lytic proteins such as BZLF1, BRLF1 and BLLF1 9. The EBV-specific T cell response is reduced by iatrogenic IS, and immune evasion is further facilitated by restricted viral protein expression. Moreover, immune surveillance within the CNS is likely to be less stringent than outside the CNS 10, 11. Studies of EBV-positive cell lines have identified three forms of virus latency. All are positive for two small nuclear RNAs (EBERs) and the BamHI-A rightward transcripts (BARTs). In latency III up to six nuclear antigens (EBNA1, 2, 3A/B/C, LP) driven by Cp/Wp promotors and three latent membrane proteins (LMP1, 2A/B) are expressed 9. In latency II, EBNA1 (driven by Qp) and LMP1, 2A/B are expressed, whereas latency I expression is restricted to EBNA1. Although categorizing EBV-associated lymphomas is a useful approximation (e.g. BL: latency I; HL: latency II; PTLD: latency III; DLBCL: latencies II and III), patterns of virus gene expression vary between samples of the same histology 12.
MicroRNAs are a class of single-stranded 18–23 nucleotide noncoding RNAs with broad influences on host biological processes. They function by targeting mRNAs for degradation and/or translational repression. Strong correlations between microRNA expression profiles and specific cancer lineages have been observed and this most likely reflects their fundamental importance in establishing and maintaining the tumor phenotype. An aberrant microRNA expression signature is a hallmark of a variety of B cell lymphoproliferative disorders 13-16. In these studies, human microRNA profiling is reflective of malignant and infiltrating nonneoplastic tissue.
Currently, 44 EBV-specific microRNAs are expressed from two regions within the EBV genome. One of these is located within introns of the BHRF1 gene and encodes four microRNAs. The second is located within the BART region, an area of complex spliced alternative transcripts. With the exception of miR-BART2, all BART-microRNAs are located within introns in two broad clusters. The expression of individual BART-microRNAs within a cell can differ by 50-fold despite the fact that many microRNAs are likely transcribed together as a single primary transcript 17. Quantitative real-time polymerase chain reaction (qRT-PCR) is quantitative, reproducible and requires little amounts of RNA. Assays are highly sensitive and specific over a broad range of expression, and are generally unaffected by single nucleotide polymorphisms. We recently have shown that expression profiling of EBV-encoded microRNAs from archival formalin-fixed, paraffin-embedded (FFPE) EBV-positive B cell lymphoma samples based on qRT-PCR is reliable and effective, and correlates strongly with the cellular EBV-load. As calibrators for cellular EBV-load we have shown that EBER2 expression was optimal with the advantage of not requiring additional assays, which enables specific and simultaneous detection of numerous EBV-microRNAs 18.
Considering the pathogenetic role of EBV and microRNA expression, this is the first comprehensive profiling of primary lymphoid tissue comparing expression profiles of patients with pCNS PTLD, EBV-associated systemic PTLD and non-EBV-associated systemic PTLD. We demonstrate that differential cellular microRNA expression is influenced by viral gene expression and localization of the lymphoma.
Materials and Methods
Patient samples
To assess the clinical features, treatment options and outcome of PTLD subtypes, a prospective PTLD-registry has been initiated in Germany in 2006. Adult SOT recipients diagnosed with PTLDs confined to CNS, also known as pCNS PTLD, reported to this registry (n = 10) or treated at Princess Alexandra Hospital, Brisbane, Australia (n = 1) were identified and selected based on availability of tumor tissue, quality and quantity of FFPE-extracted nucleic acids. Two patients were excluded due to insufficient amounts of tissue (n = 1) and the presence of additional systemic disease (n = 1). Sixteen patients with systemic DLBCL-PTLD and without CNS involvement were used as controls (eight with/without EBV-association). The participating centers were Berlin (n = 9), Göttingen (n = 2), Essen (n = 2), Hannover, Munich, Passau, Rostock (n = 4), Germany, Vienna (n = 1) and Graz (n = 2), Austria and Brisbane, Australia (n = 5). This study was approved by respective Institutional Review Boards at participating institutions. Diagnosis of PTLD was based on histopathological examination of tissue samples, which were centrally reviewed by an expert pathologist (IA) and classified according to the WHO 2008 classification 19. Staging studies and therapy were completed at the discretion of treating physicians. Follow-up data were reviewed for all patients up to April 2011. All microRNA and viral gene profiling were carried out on sections of routinely FFPE material.
Cell lines
The EBV-WIL transformed lymphoblastoid cell line (LCL) ScBu was used for comparative quantification of EBV gene expression and EBV-microRNA expression. EBV-WIL does not contain deletions within the BART locus.
Immunohistochemistry and EBER-ISH
Central review included conventional histology (hematoxylin and eosin and Giemsa stains) and immunohistochemistry (CD20, CD10, CD30, BCL6, BCL2, CD3, CD21, Ki67, TdT, LMP1, EBNA2, BZLF1). EBV-association was confirmed by in situ hybridization (ISH) for EBER as per standard methodology.
Latency and lytic gene expression quantification
Total RNA from patient samples was isolated using the RecoverAll™ Total Nucleic Acid Isolation Kit (Ambion, Austin, TX) and from cell lines using the miRvana microRNA Isolation Kit (Ambion) according to the manufacturer's instructions. RNA concentration and purity were assessed by Nanodrop® ND-1000 UV-Vis Spectrophotometer (Thermo Fisher Scientific Inc., Wilmington, DE).
Quantification of latent and lytic gene expression was performed as previously described 18. In brief cDNA was produced using Superscript III (Life Technologies Australia, Victoria, Australia) primed with random hexamers. RT-PCR was performed with previously described forward and reverse primers 18 (Table S1) using SYBR Green Master Mix (Thermo Fisher Scientific Inc.). Comparative Quantification method and is reported as levels relative to the EBV-WIL LCL control. Expression levels were calibrated to the ß2-microglobulin gene. Varying levels of EBV-positive cells were adjusted to the samples' EBER expression. All experiments were performed in duplicate. Sensitivity, specificity and robustness of this methodology in FFPE samples of EBV-positive lymphomas have been previously demonstrated 18. Statistical analysis of gene expression was performed using Microsoft Excel (Microsoft Pty., North Ryde, NSW, Australia) and GraphPad Prism 5 (GraphPad Software, Inc., La Jolla, CA).
MicroRNA expression analysis
MicroRNA expression of cellular/viral microRNAs was analyzed in 100 ng of total RNA by hybridization on Agilent's microRNA Microarray “Human microRNA-Microarray Release 16.0, 8 × 60K” (Ramaciotti Centre for Gene Function Analysis, Sydney, Australia). This array tests for 1262 human and viral microRNA. Labeling was performed with Agilent's “microRNA Complete Labeling and Hyb Kit (p/n 5190–0456),” hybridization followed Agilent's “microRNA Microarray System with microRNA Complete Labeling and Hyb Kit Protocol, Version 2.2, October 2009.” “Agilent high resolution scanner” and “scan control software version 8.0” were used for fluorescence detection. Normalization to background was performed by Agilent's “feature extraction software” followed by a quantile normalization using “genespring software.” Microarray data are available in the ArrayExpress database (www.ebi.ac.uk/arrayexpress) under accession number A-MEXP-2277.
Statistical analyses and nonhierarchical clustering were performed using “genepattern” software. Expression differences of pCNS and systemic PTLD (Figure 4) were assessed using Student's t-test (p < 0.05) with a correction of p-values for multiple testing performed by using the positive false discovery rate (FDR) <0.05.
qRT-PCR analyses were performed in triplicate on 11 human microRNAs in seven pCNS (CNS6, -1, -2, -4, -7, -8, -10) and seven systemic PTLD (PTLD3, -5, -6, -7, -10, -12, -13) using the Qiagen miScript-PCR system (Qiagen Pty. Ltd, VIC, Australia), including miScript reverse transcription kit, SYBR® Green and primers outlined in Table S2. Results were adjusted to the housekeeping small RNA U6. Comparative quantification was used with results reported relative to a pCNS PTLD sample (CNS6).
Results
Patient characteristics
Eight of nine patients diagnosed with pCNS PTLD were female and the lymphoma was EBV-associated in 8/9 cases (as defined by EBER RNA positivity). Lymphomas were classified as monomorphic DLBCL-type PTLD in 8/9 cases and as monomorphic plasmacytoma-like PTLD in one. Median age at diagnosis was 54.3 years. All patients had late PTLD (>1 year after transplantation) and 6/9 had very late PTLD (>10 years after transplantation). Most patients were kidney transplant recipients (7/9) and IS contained mycophenolate mofetil in 7/9 cases. The diagnosis of pCNS PTLD led to IS reduction in 5/9 cases or to a change of IS regimen in 2/9 cases. Rejection of the transplanted organ was observed only in CNS11. First line therapy included surgery (4/9), rituximab (4/9), HD-cytarabine (3/9) and radiation (3/9). At the last follow-up, 6/9 patients were dead, and the median OS was 5.6 months. Details on the number of cerebral lesions, treatment and outcome are given in Table 1.
| Number | Age/sex | Transplanted organ | IS before diagnosis of PTLD | IS after diagnosis of PTLD | Reduction of continued immuno-suppression | Time from SOT to PTLD (months) | Number of lesions | Ann Arbor | Therapy | Status last FU | Organ rejection | OS (month) | Current status |
|---|---|---|---|---|---|---|---|---|---|---|---|---|---|
| CNS1 | 67/f | Kidney | MMF | MMF | Yes | 115 | >1 | IV E | First line | 2 | No | 2.6 | Dead |
| Surgery/Rituximab i.th. | |||||||||||||
| CNS2 | 57/f | Kidney | FK/MMF/St | FK/St | Yes | 163 | >1 | IV BE | First line | 2 | No | 2.5 | Dead |
| Surgery/HD-MTX | |||||||||||||
| Second line | |||||||||||||
| Radiation | |||||||||||||
| CNS3 | 54/f | Kidney | MMF/St | St | Yes | 162 | >1 | IV E | First line | 2 | No | 32.6 | Dead |
| HD-AraC | |||||||||||||
| CNS4 | 74/f | Kidney | MMF/St | CyA/St | No | 101 | 1 | I E | First line | 1 | No | 1.8 | Dead |
| Surgery/Radiation/Rituximab | |||||||||||||
| CNS6 | 43/m | Liver | CyA/St | mTOR | n.a. | 58 | 1 | I AE | First line | 2 | No | 3.8 | Dead |
| HD-AraC | |||||||||||||
| Second line | |||||||||||||
| Radiation | |||||||||||||
| CNS7 | 60/f | Kidney | MMF/CyA/St | MMF/CyA/St | Yes | 46 | 1 | I AE | First line | 2 | No | 21.4 | Dead |
| Surgery/Radiation | |||||||||||||
| Second line | |||||||||||||
| HD-AraC | |||||||||||||
| Third line | |||||||||||||
| Radiation | |||||||||||||
| CNS8 | 43/f | Kidney | MMF | St | n.a. | 142 | >1 | IV E | First line | 1 | No | 66.2 | Alive |
| HD-AraC/Rituximab | |||||||||||||
| CNS10 | 53/f | Kidney | MMF/CyA | MMF/CyA | No | 320 | >1 | IV AE | First line | 1 | No | 5.6 | Alive |
| Radiation | |||||||||||||
| CNS11 | 39/m | Kidney/pancreas | CyA/FK/St | FK/St | Yes | 120 | >1 | IV E | First line | 1 | Yes | 106 | Alive |
| Rituximab | |||||||||||||
| Second line | |||||||||||||
| Rituximab |
- m, male; f, female; pCNS, primary central nervous system; PTLD, posttransplant lymphoproliferative disorder; SOT, single organ transplantation; IS, immunosuppression; MMF, mycophenolate mofetil; i.th., intrathecal; St, steroids; FK, tacrolimus; CyA, cyclosporine A; mTOR, mammalian target of Rapamycin inhibitor; E, extra nodal lesions; B, B-symptoms; A, no B-symptoms; HD, high-dose; MTX, methotrexate; AraC, cytarabine; OS, overall survival; FU, follow-up (1, remission; 2, relapse/progress).
Comparator samples were eight monomorphic EBV-associated and eight monomorphic non-EBV-associated DLBCL-type PTLD (Table 2). Clinical information on these patients is given in the Table S3.
| PTLD | Histolog. subtype | Latent proteins/transcripts | Lytic proteins/transcripts | EBER | LT | ||||
|---|---|---|---|---|---|---|---|---|---|
| LMP1 | EBNA2 | EBNA3A | BZLF1 | BRLF1 | BLLF1 | ||||
| CNS 1 | DLBCL | + | + | + | — | + | + | + | III |
| CNS 2 | DLBCL | +/+ IHC | +/+ IHC | + | +/+ IHC | + | + | + | III |
| CNS 3 | DLBCL | +/+ IHC | −/− IHC | + | −/+ IHC | + | + | + | III |
| CNS 4 | DLBCL | +/+ IHC | +/+ IHC | + | +/+ IHC | + | + | + | III |
| CNS 6 | DLBCL | −/− IHC | −/− IHC | — | −/− IHC | — | — | — | — |
| CNS 7 | Plasmocytoma-like | +/+ IHC | + | + | + | + | + | +/+ ISH | III |
| CNS 8 | DLBCL | + | + | + | — | + | + | +/+ ISH | III |
| CNS 10 | DLBCL | +/+ IHC | +/+ IHC | + | +/+ IHC | + | + | + | III |
| CNS11 | DLBCL | + | — | — | + | + | — | +/+ ISH | II |
| PTLD 8 | DLBCL | −/− IHC | — | + | + | + | + | + | III |
| PTLD 10 | DLBCL | +/+ IHC | +/+ IHC | + | +/+ IHC | + | + | + | III |
| PTLD 12 | Polymorphic | +/+/− IHC | +/+ IHC | + | — | + | + | +/+ ISH | III |
| PTLD 13 | DLBCL | −/− IHC | +/+ IHC | + | +/+ IHC | + | + | + | III |
| PTLD 22 | DLBCL | + | + | + | + | + | + | + | III |
| PTLD 23 | DLBCL | + | + | + | + | + | + | + | III |
| PTLD 24 | DLBCL | + | + | + | + | + | + | +/+ ISH | III |
| PTLD 25 | DLBCL | + | + | + | + | + | + | + | III |
| PTLD 1 | DLBCL | −/− IHC | −/− IHC | — | −/− IHC | — | — | −/− ISH | — |
| PTLD 2 | DLBCL | −/− IHC | −/− IHC | — | −/− IHC | — | — | −/− ISH | — |
| PTDL 3 | DLBCL | −/− IHC | −/− IHC | — | −/− IHC | — | — | −/− ISH | — |
| PTLD 4 | DLBCL | −/− IHC | −/− IHC | — | −/− IHC | — | — | −/− ISH | — |
| PTLD 5 | DLBCL | −/− IHC | — | — | −/− IHC | — | — | −/− ISH | — |
| PTLD 6 | DLBCL | −/− IHC | −/− IHC | — | −/− IHC | — | — | −/− ISH | — |
| PTLD 7 | DLBCL | −/− IHC | −/− IHC | — | — | — | — | — | — |
| PTLD 20 | DLBCL | −/− IHC | −/− IHC | — | −/− IHC | — | — | −/− ISH | — |
- The majority of primary central nervous system (pCNS) and systemic posttransplant lymphoproliferative disorder (PTLD) have been classified as diffuse large B cell lymphoma (DLBCL) by histopathological examination. Immunohistochemistry (IHC) and in situ hybridization (ISH) for EBER transcripts were performed, and an EBV-association was found in 8/9 pCNS and 8/16 systemic PTLD. Results of analyses of the protein expression of latent (EBNA2, EBNA3A, LMP1) and lytic protein expression (BZLF1, BRLF1, BLLF1) by IHC and results of ISH for EBER transcripts are displayed in correspondence to the expression of latent/lytic gene transcript resulted by quantitative polymerase chain reaction (qPCR) analyses. Latency type (LT) defined according to qPCR results.
EBV gene expression profiles in pCNS and systemic PTLD
All EBER-positive samples expressed at least one of the latent EBNA2, EBNA3A or LMP1 and one of the lytic transcripts BZLF1, BRLF or BLLF1, but the expression pattern was highly variable in pCNS and systemic PTLD as previously reported 18. Cells expressing EBNA2 or EBNA3A (both initiated at the Cp/Wp promoter) whose expression defines latency III 9, were found in 7/8 EBV-associated pCNS and in 8/8 of the EBV-associated systemic PTLD samples. The remaining pCNS PTLD sample expressed neither EBNA2 nor EBNA3A but LMP1, consistent with latency II. Six of eight EBV-associated pCNS and 7/8 EBV-associated systemic PTLD samples expressed BZLF1, BRLF1 and BLLF1 transcripts suggesting that in the majority of EBV-associated PTLDs, EBV can undergo lytic replication. qRT-PCR results confirmed previous immunohistochemistry results in 46/47 analyses and results of EBER ISH in 12/12 cases. Discordant results were observed in a single case and only for BZLF1 expression where immunohistochemistry has limitations. Mean expression levels of latent and lytic genes did not differ in pCNS and systemic PTLD (Figure 1). In summary, we could not find a difference in EBV-association of pCNS and systemic PTLD by analysis of latent and lytic gene expression. Latency type III was the most frequent latency pattern in DLBCL-type PTLD and the viral expression pattern was consistent with lytic viral replication in the majority of the lymphomas.

EBV microRNA expression pattern in pCNS and systemic PTLD
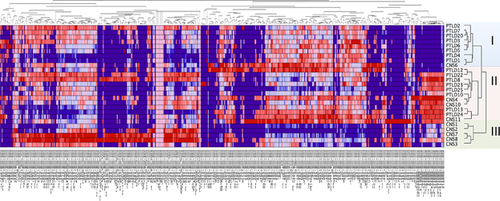
Analysis of the EBV microRNA expression pattern in PTLD by microarray identified the expression of 39 of 44 known microRNAs in EBV-associated PTLD samples, though at variable expression levels. Nonhierarchical clustering identified three major groupings or “clusters” (I, II, III; Figure 2). Cluster I contained all non-EBV-associated samples and a single EBV-associated pCNS PTLD (CNS3), which was characterized by a weak viral microRNA expression and ranked 16 out of 16 EBV-positive PTLD samples by comparison of ß2-microglobulin normalized EBER expression levels. Cluster II contained EBV-associated lymphomas with a globally reduced microRNA expression compared to samples with a globally strong EBV microRNA expression in cluster III. Comparison of ß2-microglobulin normalized EBER expression data ranked cluster III samples 1–2, 6–7, 10–12 and 14–15 out of the 16 EBV-associated PTLD samples. Thus, differences in the strength of global viral microRNA expression do not simply reflect differences in tumor cell content, while both, EBV-associated systemic and pCNS PTLD samples, can show either weak or strong viral microRNA expression.
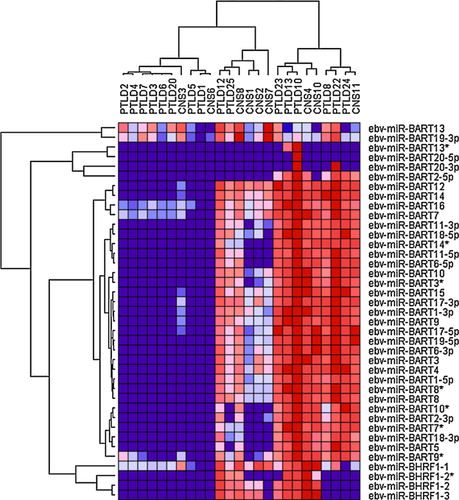
The EBV microRNA cluster BHRF1, containing ebv-miR-BHRF1-1 to -3, is important in malignant B cells transformation 20 and was expressed throughout in 5/6 cluster II samples and 5/9 cluster III samples. One sample was negative for all BHRF1 microRNAs (PTLD24), while the others showed at least expression of miR-BHRF1-1. Low-level hybridization to ebv-miR-BHRF1-1 was found in EBV-negative samples, suggesting some degree of unspecific cross-hybridization or the expression of a cellular homolog. ebv-miR-BHRF1-2* was expressed in 3/6 cluster II and in 4/9 cluster III samples.
All cluster III samples homogeneously expressed a broad spectrum of BART-microRNAs, while cluster II samples showed two different expression profiles. One that shows expression of ebv-miR-BART10*, -BART2-3p, -BART7*, -BART18-3p, -BART5 and -BART9* as well as expression of ebv-miR-BART11-3p, -BART18-5p, -BART14*, -BART11-5p and -BART6-5p; and one lacking expression of these microRNAs. Interestingly, none of the cluster II samples, but 8/9 of the cluster III samples expressed ebv-miR-BART2-5p that is known to repress viral polymerase BALF5 21.
Notably ebv-miR-BART13 and -BART19-3p were detectable in the majority of non-EBV-associated PTLD samples. ebv-miR-BHRF1-1, -BART7, -BART16 and -BART9* probes also showed signals in a proportion non-EBV-associated PTLD samples, although this was less pronounced. Most likely these indicate nonspecific cross-hybridization.
microRNA expression profiling of cellular and viral microRNAs in pCNS and systemic PTLD
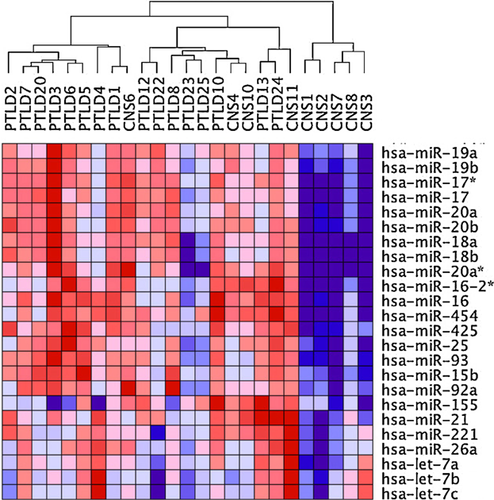
Five hundred sixty-eight of 1262 microRNAs were expressed in at least one of the tested lymphoma samples, including the 39 EBV-microRNAs already discussed. Nonhierarchical clustering of all expressed microRNAs again defined three major clusters. Strikingly, cluster I contained all non-EBV-associated pCNS and systemic PTLD, but no EBV-associated lymphoma samples. Cluster II contained 3/8 EBV-associated pCNS as well as all EBV-associated systemic PTLD samples, while cluster III exclusively contained the remaining EBV-associated pCNS PTLD samples (CNS1, 2, 3, 7, 8; Figure 3). Even the EBV-associated lymphoma sample demonstrating very low-level of viral microRNA expression (CNS3) here clustered with EBV-associated samples, consistent with EBV impacting on the cellular microRNA expression profile in EBV-associated PTLD. Separate clustering of some EBV-associated pCNS samples resulted from a considerably lower expression of specific cellular microRNAs. Interestingly, these included hsa-miR-155, -21, -221 and microRNAs of the hsa-miR-17-92 cluster (hsa-miR17, -18a, -19a, -19b, -92a) that are known to have important and regulatory roles and to be over-expressed in non-EBV-associated DLBCL in immunocompetent patients (Figures 3 and 4).
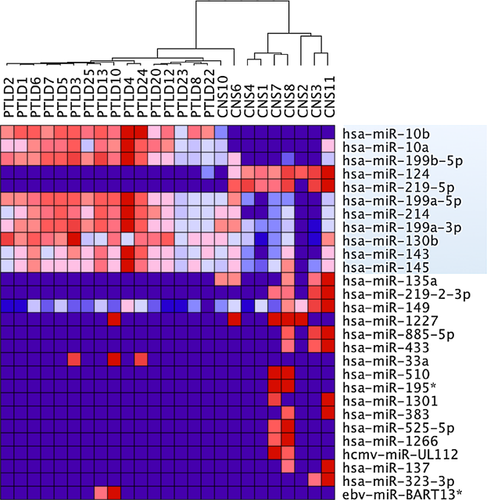
Analysis of differential microRNA expression in the complete set of pCNS and systemic PTLD further identified single microRNAs with significant different mean expression levels (p < 0.05, FDR < 0.05) in the two lymphoma entities. From a total of 28 differentially expressed microRNAs, 11 showed expression differences throughout several samples (Figure 5). These 11 microRNAs included two CNS-specific microRNAs (hsa-miR-124 and -219-5p) and nine microRNAs that are known to be involved in apoptosis, proliferation and chemosensitivity (hsa-miR-10b, -10a, -199b-5p, -199a-5p/3p, -214, -130b, -143 and -145). The level of microRNA expression differences considered as significant ranged between an expression fold change of max. 61.5 (hsa-miR-124) and min. 1.3 (hsa-miR-130b).
Confirmation of microRNA expression profiling data by qRT-PCR
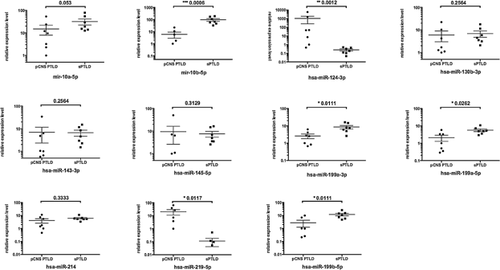
To confirm the identified differences in expression levels of single cellular microRNAs we performed qRT-PCR analyses of selected microRNAs. Due to minimal amount of tissue from these stereotactically derived biopsies, analysis was restricted to seven pCNS and seven systemic PTLD samples. However, qRT-PCR generally confirmed the data observed by expression profiling. Although the statistical power was limited by the reduced number of cases, significant different mean expression levels were found for 6 of the 11 microRNAs identifed as differentially expressed in pCNS and systemic PTLD by microRNA expression profiling. This included the two CNS-specific microRNAs, hsa-miR-124 and hsa-miR-219-5p and the microRNAs hsa-miR-10b, -199b-5p and -199a-5p/3p (Figure 6).
Discussion
This is the first report on EBV latent and lytic gene expression profiles and the cellular and viral microRNAome in pCNS PTLD and the first analysis of the cellular and viral microRNAome in PTLD. pCNS samples were compared to monomorphic EBV-associated and non-EBV-associated systemic DLBCL-PTLD. Baseline data of pCNS and systemic PTLD patients are in line with previous reports, suggesting that the analyzed lymphomas are representative for this entity 2-4, 22. We demonstrated that EBV-viral gene expression is similar in systemic and pCNS PTLD, but identified two distinct pCNS PTLD microRNA profiles. This suggests the existence of two different EBV-associated pCNS PTLD entities, one where EBV microRNA expression interacts with the cellular microRNAome in the same way as in EBV-associated systemic PTLD and one that might be restricted to the immunological niche of the CNS.
In vitro EBV-infected B cells express all six EBNA and two LMP genes. In vivo studies, however, have reported that the complete gene panel is rarely fully expressed 23. Recently, some cell lines from EBV-associated African Burkitt's lymphomas have been shown to convey an EBNA2-deletion while expressing EBNA3 24. In EBV-associated systemic PTLD previous analyses have shown that a restricted expression of latency genes is common, while the latency type still can be considered latency III based on promoter usage 23. In pCNS PTLD we identified a single case of DLBCL-PTLD showing a classical latency II expression pattern. However, the expression of viral latency genes did not significantly differ between pCNS and systemic PTLD samples, neither in their latency type nor in their mean expression level. Immediate early and late lytic transcripts also were similarly expressed and present in all EBV-associated pCNS and systemic PTLD samples, demonstrating that in both, gene expression is consistent with lytic replication. Montone et al 25 reported similar results in approximately 90% of analyzed PTLD samples by BZLF1-staining and ISH for BZLF1 and late lytic mRNA transcripts. Nonspecific B cell receptor stimulation by nonself antigens and oxidative stress have been suggested to facilitate entry of the lytic cycle in these lymphomas 26, 27. While expression of BZLF1 is indispensable for the initiation of lytic replication and is up-regulated in response to oxidative stress 28, we also found BRLF1 and BLLF1 constantly expressed. BRLF1 has been described to activate the c-myc promoter and to inhibit Rb leading to cell cycle progression 29. Furthermore, BZLF1 and BRLF1 enhance VEGF and IL-6 expression 30, 31. While the role of VEGF in DLBCL is controversial, we recently reported a positive correlation of systemic IL-6 levels and PTLD tumor mass adding to the body of evidence that IL-6 acts as an auto- and paracrine-growth factor in PTLD 32.
Thirty nine of the 44 known EBV-microRNAs were expressed in pCNS and systemic PTLD samples. Some showed preferential expression of the BHRF1 microRNA cluster, while others mainly expressed BART-microRNAs and others expressed both microRNA families. Both, BART- and BHRF1 microRNAs have been implicated in growth of normal B cells and B cell lymphomas with BHRF1-1 microRNA expression being sufficient for B cell proliferation 20, 21. The BHRF1 microRNA cluster expression has been associated with EBV latency III expression profile and lytic replication 1, 33, in line with our data on viral gene expression in PTLD. We found six cases that did not express all BHRF1 microRNAs. However, four of them expressed BART-microRNAs, including the case with no BHRF1 expression at all. We cannot exclude that the failure to identify the BHRF1 microRNAs in these cases reflects a technical limitation of our approach. However, we deem it unlikely as these cases expressed high levels of BART transcripts suggesting that latency III transcripts do not always give rise to BHRF1 microRNAs. While miR-BHRF1-2* is expressed at much lower levels than miR-BHRF1-2 34, 35, nondetection of miR-BHRF1-2* in most of the analyzed samples positive for miR-BHRF1-2 might identify the sensitivity level of our method or reflect that EBV-infected B cells in PTLD differ from EBV-infected LCLs.
From the two different EBV-microRNA expression profiles identified in PTLD by nonhierarchical clustering of viral microRNAs (Figure 2), the one with a globally strong EBV-microRNA expression showed a cellular microRNA profile similar to the cellular microRNA expression profile of EBV-negative PTLD and reminiscent of DLBCL in the nonimmunosuppressed host, characterized by the high expression of hsa-miR-21, -155 and the miR-17-92 cluster (Figure 4). OncomiRs hsa-miR-21 and -155 activate cell growth and both microRNAs have been described to be essential for growth of EBV-infected LCL. Transgenic expression of hsa-miR-21, -155 and the miR-17-92 cluster leads to high-grade B cell lymphomas in animal models 36-39. In contrast, nonhierarchical clustering of the cellular and viral microRNA expression of the four pCNS PTLD samples (CNS8, 1, 2, 7) and the two systemic PTLD samples (PTLD12, 25), which exhibited globally reduced EBV microRNA expression (Figure 2), resulted in separation of the pCNS from the systemic EBV-associated PTLD samples (Figure 3). The two systemic PTLD samples clustered with the above mentioned cluster reminiscent of DLBCL in the nonimmunosuppressed host, while the resulting pCNS PTLD-only cluster was characterized by a reduced expression of the majority of the tumor suppressor family hsa-let7 and a reduced expression of hsa-miR-19a/b, -101. It would be interesting to test whether the identified specific cellular miRNA signature could be detected in cerebrospinal fluid and thus facilitate earlier diagnosis. Interestingly, the EBV-associated sample CNS3 that showed almost no EBV microRNA expression (Figure 2) was also included in this cluster, but the non-EBV-associated sample CNS6 was not. While a low expression of hsa-let7 family members was shown to favor tumor growth 40, low amounts of miR-19a/b and -101 have been shown to repress c-myc 41 and might activate the c-myc pathway in these lymphomas. The OS of patients with pCNS PTLD is generally low, although OS greater than 6 months were observed more frequently in the pCNS PTLDs from group III (3/5) than those from group II (1/4). Therefore, the increased expression of cellular oncomiRs might lead to more aggressive/therapy-resistant pCNS PTLD than a potential activation of the c-myc pathway. Whether expression of DLBCL oncomiRs represent a valuable negative predictor for pCNS OS needs to be assessed in a larger series of cases. It is important to recognize that the similarity of microRNA expression profiles of the EBV-associated lymphomas included in the pCNS-only cluster, was higher than the differences induced by the presence of EBV in other pCNS and systemic PTLD samples (Figure 3). A molecular relevance of our observation therefore is very likely.
A direct comparison of microRNA expression of systemic and pCNS PTLD samples further identified 28 microRNAs as associated with one of the two PTLD subtypes (Figure 5). While 17/28 microRNAs showed a private expression in a few lymphoma samples, only 11 microRNAs characterized the whole panel of systemic and pCNS PTLD samples. Two of these microRNAs are known to be relatively over-expressed in the human brain (hsa-miR-124, -219-5p) 42-44 reflecting a certain degree of contamination or a simple consequence of brain lymphoma 45. Other significantly different expressed microRNAs included microRNAs involved in cell cycle progression (hsa-miR-130b) 46, regulators of phosphatase and tensin homolog (hsa-miR-10, -214) 47, 48, microRNAs working as repressor of TP53 (hsa-miR-145) 49 or as repressor of c-myc (hsa-miR-199, -143) 49, 50. Specifically, the lower expression of hsa-miR-10 and -199 in pCNS than in systemic PTLD could be confirmed by qRT-PCR. hsa-miR-10 is involved in translational activation 46, 51 and hsa-miR-199 is a known regulator of nuclear factor kappa-light-chain-enhancer of activated B cells (NFκB) and HIF-1 α 52, 53. These findings could suggest new therapeutic avenues for pCNS PTLD. Drugs that interfere with the NFκB pathway such as bortezomib 54, a proteasome inhibitor which blocks degradation of IκBα and consequently inhibits NFκB activity has been successfully tested in preclinical studies of the DLBCL 55 and could find a role in pCNS PTLD therapy.
In conclusion, our results suggest that EBV has a major impact on cellular microRNA expression in PTLD, and suggest that EBV-associated pCNS PTLD may utilize two different mechanisms to activate tumor cell growth and to inhibit apoptosis. One mechanism is associated with a microRNA expression profile similar to EBV-associated systemic PTLD. The other is different from non-EBV-associated and EBV-associated systemic PTLD. The reason for these differences may be related to the far higher frequency of EBV-association in pCNS PTLD as compared to systemic PTLD.
Acknowledgments
This work was funded by an ROTRF grant to MKG and RUT (ID number: 27519104). MKG is supported by the Cancer Council Queensland and by Queensland Health and Medical Research.
Disclosure
The authors of this manuscript have conflicts of interest to disclose as described by the American Journal of Transplantation. The German PTLD Study Group was supported by Roche, AMGEN, Mundipharma and CSL Behring to run the National PTLD Registry DPTLDSG-2006-2012 with an unrestricted grant. RUT received payment for lectures and consultancy from CSL Behring, Mundipharma and/or Roche and grant support from AMGEN, CSL Behring, Mundipharma, Novartis and Roche. All other authors declare no conflicts of interest.


