Time course of diacetyl formation during vinification with Saccharomyces cerevisiae and Oenococcus oeni co-cultivation
Abstract
Background and Aims
Diacetyl accumulation in wine, which has undergone malolactic fermentation by Oenococcus oeni, is often associated with aromatic off-flavours. Characterisation of the diacetyl-related metabolic pathway helps to explain bacterial diacetyl formation during winemaking. The present study describes the time-dependent formation of diacetyl during the vinification process after simultaneous, induced malolactic fermentation by freeze-dried O. oeni on the basis of gene-expression analysis of the citrate- and pyruvate-derived pathways.
Methods and Results
After simultaneously induced malolactic fermentation in Pinot Blanc by O. oeni, the dynamics of diacetyl formation were compared with citrate consumption and gene-expression of the diacetyl-related metabolic pathways. Diacetyl concentration showed two maxima: the first increase was primarily influenced by the activity of Saccharomyces cerevisiae; however, the second increase was induced only by O. oeni and correlates with bacterial citrate degradation. Expression of the alsS gene showed two significant responses; however, only the second response was affected by the citrate-associated genes maeP and citE. Additionally, alsD and butA2 were found to be continuously underexpressed during the winemaking process.
Conclusions
Taken together, we suggest that diacetyl accumulation during the vinification process by O. oeni is affected by citrate fermentation. The diacetyl-related alsS gene, however, is also overexpressed independently by other substrates, which may also increase the intracellular pyruvate level resulting in diacetyl formation.
Significance of the Study
Characterisation of the time-dependent diacetyl accumulation and its degradation during the vinification process is essential for the development of strategies that focus on the suppression of the diacetyl concentration below the sensory threshold.
Introduction
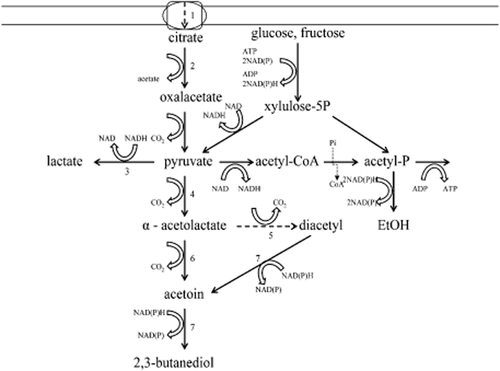
Diacetyl accumulation in wine, which has undergone malolactic fermentation (MLF) by Oenococcus oeni, is a frequently discussed topic and has been the subject of many studies in the last decades (Rankine et al. 1969, Martineau et al. 1995a,b, Bartowsky et al. 1997, Bartowsky and Henschke 2005). Diacetyl is associated with a nutty and toasty flavour when present above its sensory threshold in the wine matrix of between 0.2 and 2.8 mg/L (Martineau et al. 1995a). A higher diacetyl concentration, however, imparts a buttery or lactic off-odour. While diacetyl is produced by yeasts within the valine biosynthetic pathway (Gjermansen et al. 1988), most of the diacetyl found in wine is associated with lactic acid bacteria (Martineau et al. 1995b). Oenococcus oeni starter cultures are primarily involved in the accumulation of a diacetyl concentration above the sensory threshold in the wine matrix (Bartowsky and Henschke 2004). Citrate degradation by O. oeni has been reported as the main source of bacterial-induced diacetyl formation (Bartowsky et al. 1997). This finding is supported by the detection of citrate-derived carbon fluxes to the diacetyl-related pathway (Ramos and Santos 1996). Controversial results have also been described by other authors (Martineau and Henick-Kling 1995) and indicate that the diacetyl concentration found in wine was not related to the amount of citric acid metabolised, nor was the course of citric acid metabolism necessarily related to the course of diacetyl production. While bacterial citrate degradation displays one source for diacetyl accumulation, hexose sugars may also increase the diacetyl concentration, as pyruvate, the central metabolite in diacetyl-associated pathway, is formed in both pathways (Figure 1).

Metabolic pathways of citrate and glucose, fructose depletion by Oenococcus oeni [adapted from Ramos and Santos (1996)]. 1. citrate permease (maeP), 2. citrate lyase (citE), 3. lactate dehydrogenase (ldh), 4. α-acetolactate synthase (alsS), 5. non-enzymatic oxidative decarboxylation, 6. α-acetolactate decarboxylase (alsD), 7. acetoin reductase/diacetyl reductase (butA2).
Metabolic biosynthetic degradation of pyruvate by O. oeni can yield lactate, acetate, ethanol, diacetyl, acetoin, and 2,3-butanediol. Lactate formation by lactate dehydrogenase is associated with energy generation forced by a change in intracellular pH (Henick-Kling et al. 1991, Konings 2002) and secondary Nicotinamide adenine dinucleotide formation, which is coupled with additional ATP synthesis in co-metabolism of glucose and fructose. Formation of diacetyl, acetoin and 2,3-butanediol depends on the reduction of pyruvate to α-acetolactate by α-acetolactate synthase. This appears to be the key step in diacetyl formation, particularly as in the presence of oxygen, α-acetolactate can be converted non-enzymatically to diacetyl by oxidative decarboxylation (Hugenholtz and Starrenburg 1992). Additionally, α-acetolactate can be metabolised to acetoin by α-acetolactate decarboxylase and further to 2,3-butanediol by acetoin reductase (Ramos and Santos 1996). Because of its reductase activity, acetoin reductase may also be able to reduce diacetyl to acetoin (Ramos and Santos 1996). Because of additional Nicotinamide adenine dinucleotide phosphate generation, the metabolic shift from citrate to 2,3-butanediol displays another alternative pathway to increase ATP synthesis in co-metabolism with glucose.
To improve our understanding of diacetyl formation during vinification, gene-expression analysis of the pyruvate-associated pathway in O. oeni may be a suitable molecular tool to complement analytical methodologies. Recently published studies showed a significant influence of ethanol and pH on the expression of the citrate pathway in O. oeni (Olguin et al. 2009). Our goal in this work was to describe the dynamics of diacetyl concentration and the time-dependent gene-expression analysis of the citrate- and diacetyl-associated pathway. Furthermore, the importance of bacterial growth and citrate fermentation related to diacetyl accumulation was also a focus of this study.
Materials and methods
Grape juice, microorganisms and vinification procedure
Experiments were undertaken in 3 L Erlenmeyer flasks that were covered with cellulose plugs and filled with 3-L pasteurised (72°C for 2 min) sterile-filtered (0.45 μm) grape juice (Pinot Blanc). Grapes were harvested in September 2011 (Staatsweingut mit Johannitergut, Neustadt-Mußbach, Germany). Initial grape-must composition was determined by Fourier transform infrared spectroscopy (Foss WineScan FT 120; Foss, Hillerød, Denmark) with the results as follows: glucose 94.3 g/L, fructose 89.9 g/L, L-malic acid 3.5 g/L, ethanol <0.5 g/L, tartaric acid 5.9 g/L, gluconic acid 0.1 g/L, nitrogen by ortho-phthalaldehyde 131 mg/L and NH4+ 70 mg/L. Initial pH was 3.2, and the soluble solids content was 19.4°Brix (80.3°Oe). No volatile acids and glycerol were found. Alcoholic fermentation (AF) was initiated by inoculation of Saccharomyces cerevisiae (Lalvin CY 3079, Lallemand, Montréal, QC, Canada), and MLF was induced by adding freeze-dried O. oeni (Enoferm ALPHA, Lallemand, Renningen, Germany), 24 h after the wine yeast was added. Both microorganisms were used according to the manufacturer's instructions. Fermentation assays were performed in triplicate, and bacterial growth was monitored by counting agar plates in MRS (De Man et al. 1960) medium treated with cycloheximide (AppliChem GmbH, Darmstadt, Germany) at a final concentration of 0.1 g/L.
Chemical analysis
Alcoholic fermentation and MLF were monitored by analysing ethanol, glucose, fructose, and L-malic acid with FTIR-spectroscopy (Foss WineScan FT 120) using a calibration based on partial least squares. Citrate concentration was measured by an enzymatic assay (Enzytech™ UV-Test, R-Biopharm AG, Darmstadt, Germany) using the Random Access System Konelab 20i (Thermo Fisher Scientific, Dreieich, Germany). Diacetyl was assayed after derivatisation with 1,2-diaminobenzene (Sigma-Aldrich, Steinheim, Germany) by gas chromatography-mass spectrometry (Organisation Internationale de la Vigne et du Vin 2012). The Fisons Instruments (Thermo Fisher Scientific) GC 8000 series instrument was equipped with a split/splitless injector and connected to an MD 800 quadrupole MS (Fisons). Samples (3 μL) were injected in splitless mode (45 s) with an injector temperature of 220°C using an AS 800 autosampler (Fisons). A 30 m × 0.25 mm i.d. fused silica capillary, coated with 0.5 μm of a polyethylene glycol stationary phase (ZB-Wax, Phenomenex, Aschaffenburg, Germany) was used as a separation column. Helium was the carrier gas with a constant inlet pressure of 75 kPa. The oven temperature was initially held at 40°C for 2 min and then programmed to 240°C at a rate of 5°C/min, and finally held for 5 min. The MS transfer line and ion source temperature was held at 240°C. Electronic ionisation was realised at 70 eV. Detection (EI+) was in the full scan mode (m/z 29–250), and quantification was done on extracted ion traces of fragment ions. Quantifier and qualifier ions were m/z 117 and 158 (diacetyl), respectively, m/z 158 and 171. 2,3-Hexanedione (Sigma-Aldrich) was used as the internal standard. Instrument control and data acquisition were performed with Xcalibur software version 1.2 (Thermo Fisher Scientific).
Gene sequences and primer design
Specific primers (Table 1) were designed using gene sequence information from the National Center for Biotechnology Information. As whole genome sequence information from O. oeni Enoferm ALPHA used in the present study was not available at that time, gene information from O. oeni PSU-1 (NC_008528) was used instead. Sequence references are listed as follows: butA2 OEOE_0693 (652702. 653481, complement); alsS OEOE_1763 (1682932.1684575, complement); alsD OEOE_1704 (1623953.1624669, complement); citE OEOE_0423 (407936.409474, complement); maeP OEOE_0419 (404701.405684, complement); ldh OEOE_1182 (1628200.1629177, complement).
| Gene product | Gene | Forward primer (5′3′) | Reverse primer (5′3′) | Amplicon length (bp) |
|---|---|---|---|---|
| Acetoin/diacety reductase | butA2 | ATGGACCTGGAAAATCAACG | TCTGGATTGCCTTGAACTCC | 132 |
| α-Acetolactate synthase large subunit | alsS | GAAGTTGAAGCGGAGATTGC | GCAAAGACCAGGACATCGTT | 217 |
| α-Acetolactate decarboxylase | alsD | TCAGCAGCGATGTATGAAGG | GATGCAACTGGAAATCCTGAA | 148 |
| Citrate lyase α subunit | citE | TAGGGGACGCTGTTTCTCAC | CGGAATTTGGTACTCCGAGA | 129 |
| Citrate permease | maeP | TGGTTACGCCTTTGTCATTG | GTCCCAATAAAGCCAGCAAA | 102 |
| D-Lactate dehydrogenase | ldh | TTCGGTTGCCGAACATGCAG | TGTCGGTGCCCAACGTAAATCG | 103 |
All primers were designed to a primer length between 20 and 25 bp with a resulting amplicon length between 100 and 220 bp, and an annealing temperature (Ta) of 60°C. Primers were designed with the software Primer3 v.0.4.0 (Whitehead Institute for Biomedical Research, Cambridge, MA, USA). To avoid secondary structures and dimer formation, primers were characterised with the Software Oligo Analyzer v. 3.1 (Integrated DNA Technologies, Inc., Coralville, IA, USA). All primers used in the present study were synthesised by biomers.net GmbH (Ulm, Germany).
RNA extraction
Total bacterial RNA was isolated with an RNeasy kit (Qiagen, Hilden, Germany) along with RNAprotect bacteria reagent (Qiagen) according to the manufacturer's instructions. Cells were harvested by centrifugation (5000 g for 10 min) using a Rotina 420R (Hettich, Bäch, Switzerland). Yeast cells were removed by centrifugation (7000 g for 10 s) after bacterial lysis was completed. The resulting yeast-free supernatant was used for further analysis. Purified RNAs were suspended in 40 μL of 0.1% diethylpyrocarbonate (DEPC)-treated water and stored at −80°C. To remove genomic DNA, DNAse digestion was carried out, using the DNase 1 RNase free kit (Thermo Fisher Scientific) according to the manufacturer's instructions. The concentration of RNA was calculated by measuring absorbance at 260 nm with a NanoDrop 2000 spectrophotometer (Thermo Fisher Scientific). Extracts of RNA were diluted with 0.1% DEPC-treated water to a final concentration of 100 ng/μL. The integrity of RNA was determined by agarose gel electrophoresis (0.8% agarose gel, 1 h at 100 V) and GelRed (Biotrend Chemikalien GmbH, Köln, Germany) staining.
Synthesis of complementary DNA and real-time quantitative polymerase chain reaction
Complementary DNA (cDNA) was synthesised with the Maxima First-Strand cDNA Synthesis Kit (Thermo Fisher Scientific) as specified by the manufacturer. Resulting cDNAs were diluted in 60 μL nuclease-free water for further application. Real-time quantitative polymerase chain reaction (qPCR) was undertaken with the Maxima SYBR Green qPCR Master Mix (Thermo Fisher Scientific) as recommended.
Polymerase chain reactions were performed in a total reaction volume of 25 μL containing 2 μL cDNA and 0.1 μmol of each primer. All samples were run in triplicate, and no template controls were included in each run. Real-time qPCRs were carried out using the Rotor-Gene Q cycler (Qiagen). The PCR program was established as follows: initial denaturation for 10 min at 95°C followed by 40 cycles denaturation for 15 s at 95°C and annealing/elongation for 60 s at 60°C.
Fluorescence of DNA SYBR green complexes (510 nm) was detected at the end of each cycling step. Specific PCR products were verified by melting curve analysis between 50 and 99°C. Threshold cycle value (Ct) was set manually at 0.003 relative fluorescence units. Validation experiments of the gene expression were assayed as described in the comparative critical threshold method (Livak and Schmittgen 2001). Because of its stable expression from O. oeni in wine-related media, lactate dehydrogenase ldh (Desroche et al. 2005) was chosen as the internal control (housekeeping gene). Calibrator ΔCt0 (CtTarget − Ctldh) was defined at time zero, were ΔCt0 describes the Ct difference between ldh and the gene of interest 3 h after bacterial inoculation.
Results
Dynamics of fermentation process and bacterial growth
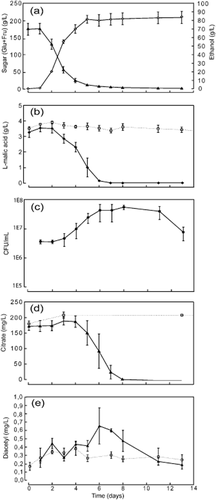
Alcoholic fermentation was observed 2 days after wine yeast was inoculated into the grape must (Figure 2a). The highest rate of glucose and fructose fermentation was observed between days 2 and 3. During AF, 174 g/L sugar was consumed, and 83 g/L EtOH was formed.

Products of the fermentation of grape juice by Saccharomyces cerevisiae (control) and the growth of Oenococcus oeni and the products of fermentation after simultaneous inoculation with S. cerevisiae and O. oeni. (a) Sugar (glucose + fructose (▲) and ethanol (◇); (b) L-malic acid [O. oeni (◆), control (□)]; (c) viable cell count of O. oeni; (d) citric acid [O. oeni (▲), control (□)]; and (e) diacetyl [O. oeni (▲), control (□)]. Control assay (dotted line) shows the dynamics of fermentation products only by the activity of S. cerevisiae in the absence of O. oeni. Data shown are mean values with standard deviations (n = 3).
At day 3 (Figure 2b), MLF was observed when the bacterial population was 4.65 × 10⁶ CFU/mL (Figure 2c) and was completed at day 7. During MLF, the initial concentration of 3.5 g/L L-malic acid was completely consumed.
Control assays, without the addition of O. oeni, were established to differentiate between diacetyl formation by O. oeni and by S. cerevisiae. The dynamics of diacetyl concentration showed two responses (Figure 2e). First, the increase in diacetyl concentration (days 1–4) was also found in the control assays in which O. oeni was absent; however, samples with bacteria added showed a greater diacetyl increase during this period. The second increase in diacetyl concentration (days 5–7) was influenced only by O. oeni, as the control assays showed no further increase in diacetyl concentration: during this time, citric acid was degraded (Figure 2d). No further increase in diacetyl content was found in the late stage of bacterial citrate fermentation (days 7–8) and after the citrate had been completely consumed. Diacetyl degradation was detected after day 7, and during that time, the diacetyl concentration decreased from 0.6 to 0.2 mg/L.
Gene expression analysis
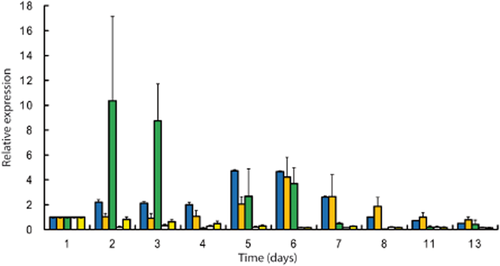
Figure 3 shows the expression profile of the genes maeP (putative citrate permease), citE (citrate lyase), alsS (α-acetolactate synthase), alsD (α-acetolactate decarboxylase) and butA2 (acetoin/diacetyl reductase). Significant changes in expressional responses were found for maeP, citE and alsS; however, alsD and butA2 were continuously underexpressed during vinification. The alsS gene showed two responses (days 2–3, 5–6) interrupted by a complete loss in the transcription level at day 4. The first increase of alsS reached a 10-fold overexpression at days 2 and 3, and was detected prior to the expression of the citrate pathway.

Expression level of the genes maeP ( ), citE (
 ), alsS (
 ), alsD (□) and butA2 (
 ) involved in the citrate and pyruvate metabolism in Oenococcus oeni relative to their expressional profile 3 h after bacterial inoculation (calibrator). Data shown are mean values with standard deviations (n = 3).
During citrate fermentation (Figure 2d), the expression level of maeP and citE rose fourfold where maeP showed the previous response. The maximum expression level of maeP and citE was found at days 5 and 6 in the mid-stage of citrate degradation (Figure 3). Similar transcriptional behaviour was found for alsS with a threefold overexpression at day 5 and a fourfold overexpression at day 6. Underexpression of alsS was found in the end stage of citrate metabolism when citrate concentration reached 24 mg/L.
Discussion
Bacterial-induced MLF is mentioned as the central cause for a buttery off-flavour in wine (Bartowsky and Henschke 2005). Therefore, a characterisation of the time-dependent diacetyl accumulation and its degradation during vinification is essential for the development of strategies, which focus on the suppression of diacetyl concentration below the sensory threshold. The purpose of this investigation was to describe the dynamics of diacetyl concentration and the time-regulated gene expression in O. oeni of the citrate- and diacetyl-associated pathway.
Although the concentration of acetoin and 2,3-butanediol was not determined as such, the expression level of alsD and butA2 may predict the level of formation. Our results showed that both the alsD and butA2 genes were continuously underexpressed suggesting that most α-acetolactate formed accumulates or is decarboxylated to diacetyl. It has been postulated that the alsS and alsD genes of O. oeni were organised in a single operon (Garmyn et al. 1996); however, our study revealed no correlation between the gene expression profiles of alsS and alsD. These results are in agreement with a previous study that showed no dependency between alsS and alsD expression, suggesting that alsD could be transcriptionally regulated independently of alsS as a response to stress conditions (Olguin et al. 2009). Citric acid is mentioned as the main source of diacetyl formation (Bartowsky et al. 1997). Any other substrate that is converted to pyruvate could also be a precursor of diacetyl (Martineau and Henick-Kling 1995).
Intracellular-formed pyruvate is mainly converted to lactate (Ramos and Santos 1996) by lactate dehydrogenase. As the ldh gene in O. oeni is highly and stably expressed (Desroche et al. 2005), formation of lactate and acetyl coenzyme A may not degrade all generated pyruvate resulting in intracellular pyruvate accumulation. Therefore, pyruvate degradation to α-acetolactate by α-acetolactate synthase seems to be an alternative pathway to remove an excess amount and may prevent toxic implications because of high concentration of accumulated pyruvate.
Diacetyl derives from α-acetolactate by spontaneous, non-enzymatic, oxidative decarboxylation (Hugenholtz and Starrenburg 1992). Therefore, a high expression level of alsS forces α-acetolactate formation and may predict diacetyl formation. Our results demonstrated that overexpression of alsS was characterised by two significant responses (Figure 3). Although alsS overexpression was found during citrate degradation, significant expressional response was also located prior to citrate fermentation. This suggests that diacetyl formation by O. oeni may not be influenced only by citrate degradation.
Changes in diacetyl concentration were characterised by two peaks. An initial increase in diacetyl concentration was found in controls as well as in samples inoculated with bacteria and therefore appears to be primarily influenced by the activity of wine yeast. The second increase in diacetyl concentration was induced only by O. oeni and was observed within bacterial citrate degradation. Moreover, during that time, overexpression of the alsS gene was observed as a result of the expressional response of the citrate-related genes maeP and citE. This suggests that diacetyl formation by O. oeni was directly influenced by citrate degradation. Although alsS overexpression was found prior to citrate degradation, diacetyl concentration was not clearly higher than that in the control samples. One explanation for the low diacetyl accumulation despite the alsS response may be the reduced bacterial viability that was sevenfold to ninefold lower than during citrate degradation. Furthermore, a higher diacetyl reduction capacity of S. cerevisiae at the beginning of fermentation may also influence the diacetyl accumulation. Diacetyl concentration, however, is the result of formation and degradation that makes it difficult to correlate diacetyl concentration with the dynamics of the fermentation process.
Acknowledgement
This investigation was supported by the Ministry for Environment, Agriculture, Nutrition, Viticulture, and Forests and Lallemand, Montréal, QC, Canada.


