The worst drought in 50 years in a South African savannah: Limited impact on vegetation
Data Availability Statement: This article does not contain data.
Abstract
enSouth Africa experienced a severe multiyear drought from 2014 to 2016. Here, we explore the response of a South African savannah ecosystem to this drought focusing on tree and grass dynamics. We used open long-term monitoring plots established in 2000 and distributed across broad rainfall gradients in the Hluhluwe-iMfolozi Park in KwaZulu-Natal. Analysis showed negligible tree mortality due to drought in 2016 (0.03%) and 2017 (0.49%). However, there was an apparent increase in the tree population especially among the small size classes (0.1–0.3 m) in 2016 and 2017 relative to the predrought 2012 census. Drought effects may be confounded with changes in browser populations. The impala population declined in a mesic savannah (Hluhluwe), as measured with dung counts; however, this decline started before the drought. Impala decline in a semi-arid savannah (iMfolozi) was more coincident with drought. Grass biomass and cover decreased in 2016 compared to predrought 2012 but showed rapid recovery once rains began. In iMfolozi grass species, composition improved from a grazing perspective as a result of the recovery of the decreaser species, an increase in palatable species and a marked decline of unpalatable species. The minor changes in woody plants and grasses from before the drought until rain resumed and the rapid recovery of grasses suggest that this South African savannah ecosystem was resilient to severe drought.
Résumé
frL’Afrique du Sud a connu une sévère sécheresse de plusieurs années à partir de 2014-2016. Nous explorons ici les réponses d’un écosystème de savane sud-africaine à cette sécheresse axée sur l’arbre et l’herbe dynamique. Nous avons utilisé des parcelles de surveillance ouvertes à long terme établies en 2000 et réparties sur de larges gradients de précipitations dans le parc Hluhluwe-iMfolozi au KwaZulu-Natal. L’analyse a montré une mortalité des arbres négligeable en raison de la sécheresse en 2016 (0,03 %) et 2017 (0,49 %). Cependant, il y avait une augmentation apparente de la population d'arbres en particulier dans les petites classes de taille (0,1 à 0,3 m) en 2016 et 2017 par rapport au recensement de 2012 précédant la sécheresse. Les effets de la sécheresse peuvent être confondus avec les changements dans les populations de navigateurs. La population d'impala a décliné dans une savane mésique (Hluhluwe), mesurée par le dénombrement des excréments, mais ce déclin a commencé avant la sécheresse. Le déclin de l'impala dans une savane semi-aride (iMfolozi) coïncidait davantage avec la sécheresse. La biomasse et la couverture herbacée ont diminué en 2016 par rapport à la période précédant la sécheresse en 2012, mais ont montré une récupération rapide une fois que les pluies ont commencé. Chez iMfolozi, la composition des espèces d’herbe s’est améliorée du point de vue du pâturage, grâce au rétablissement de l’espèce décroissante, à l’augmentation du nombre d’espèces au goût agréable et à un déclin marqué des espèces inutilisables au goût. Les changements mineurs survenus dans les plantes ligneuses et les herbes depuis la sécheresse jusqu'à la reprise des pluies et la récupération rapide des herbes suggèrent que cet écosystème de savane sud-africaine était résistant aux sécheresses sévères.
1 INTRODUCTION
Extreme climatic events, such as drought, are predicted to occur more frequently in future due to human-induced climate change (Easterling et al., 2000; Hulme, Doherty, Ngara, New, & Lister, 2001; Kruger, 2006; New et al., 2006; Solomon, Qin, Manning, Averyt, & Marquis, 2007; Twidwell et al., 2014). Observed trends are an increase of 0.6°C in the global mean temperature and an increase in land surface precipitation since the start of the 20th century (Easterling et al., 2000; Ziervogel et al., 2014). Models project increased frequencies of extreme events for future climates, such as frequent extreme precipitation and temperature events (Burke, Brown, & Christidis, 2006; Dai, 2013; Easterling et al., 2000; Fensham, Fairfax, & Ward, 2009; Stott et al., 2016). In this context, severe drought has been recognised as a cause of negative long-term effects on socioeconomic and natural environments (Walker, Emslie, Owen-Smith, & Scholes, 1987). Both models (McDowell & Allen, 2015) and observations (Allen et al., 2010; Choat et al., 2012) indicate widespread tree mortality in forests linked to drought and increased temperatures. Our study explored drought-induced vegetation change in an African savannah. Previous studies of drought impacts on woody plant and grass dynamics in South African savannahs produced contradictory conclusions (Swemmer et al., 2018). Elsewhere, extensive tree mortality as a result of drought has been reported for eucalypt savannahs in Queensland, Australia (Fensham & Holman, 1999), as well as increased forest tree mortality worldwide (Allen et al., 2010; Choat et al., 2012; Williams et al., 2013).
Severe drought has the potential to induce tree mortality in all demographic stages (Allen et al., 2010; Fensham et al., 2009; Roques, O'Connor, & Watkinson, 2001). According to a global analysis of drought impacts in savannahs, Fensham et al. (2009) argued that mortality of large trees in severe droughts is the main cause of the open structure of savannahs, rather than constraints on recruitment of woody plants. In contrast, others have argued that droughts may cause the release of woody saplings and an increase in mature trees because there is little grass to fuel fires or to compete with woody plants (February, Higgins, Bond, & Swemmer, 2013; Lehmann, Prior, Williams, & Bowman, 2008). As regards grasses, some studies suggest that it takes many decades for a grass sward to recover from severe drought (e.g. O'Connor, 2015), whereas others suggest recovery is on the order of a year or two (Danckwerts & Stuart-Hill, 1988). There is widespread agreement that grass species in different areas respond differently to environmental drivers (Noble & Slatyer, 1980; O'Connor, 1994) and that the recovery period of a droughted community is variable (Tainton, 1999). Also, it has been suggested that full community recovery might depend on the frequency of rainfall and drought events as well as the management strategies applied pre/postdrought such as the intensity of grazing pressure and burning (Bosch & Kellner, 1991; O'Connor, 1994). For instance, if veld was grazed immediately after drought, recovery would be slower than in rested veld (Danckwerts & Stuart-Hill, 1988).
Recently, South Africa experienced a severe multiyear drought from 2014 to 2016. The previous two severe droughts were in the early 1980s (Danckwerts & Stuart-Hill, 1988) and the early 1990s (Viljoen, 1995). In the 90s multiyear drought in Kruger National Park, there were negligible rates of tree dieback with the lowest mortality, surprisingly, in the arid savannah (Viljoen, 1995). Elsewhere, the response of savannah plant communities to severe drought has barely been studied except in Australia (Fensham & Holman, 1999). Opportunities to study drought are scarce, because multiyear rainfall deficits are naturally rare and occur at unpredictable intervals (Fensham & Holman, 1999).
- Does drought cause tree mortality?
- Does drought cause perennial grass mortality?
- Are drought impacts on tree demography confounded with changes in herbivory levels (specifically the mixed feeder impala population)?
- What is the relative impact of drought on woody plants and perennial grasses in a mesic versus semi-arid savannah?
2 MATERIALS AND METHODS
2.1 Study area
The study was carried out in the Hluhluwe-iMfolozi Park (HiP), located in the northern part of Kwazulu-Natal, South Africa (28°0′ – 28°26′S; 31°43′ – 32°9′E). The park is fenced, and the area of the park is about 900 km2 (see details Balfour & Howison, 2002; Whateley & Porter, 1983). The climate, topography and geology of the park are described in Howison, Olff, Owen-Smith, Cromsigt, and Archibald (2017). Soils in our study sites were predominantly well-drained fine textured sandy clay loams derived from shales and basalt. Mean minimum and maximum temperatures in the Hluhluwe portion of the park are, respectively, 18 and 29°C in summer (January) and 11 to 23°C in winter (July). Frosts are unusual but sometimes occur. Rainfall varies from <600 mm per annum in the low-lying southern regions of iMfolozi to ~1,000 mm in the north-western hills of Hluhluwe (Archibald, Nickless, Govender, Scholes, & Lehsten, 2010; Balfour & Howison, 2002). The vegetation is predominantly acacia savannahs, mesic in Hluhluwe and semi-arid in iMfolozi, but also includes patches of forest and thicket (Howison et al., 2017; Whately & Porter, 1983). Fire frequency in the park is positively correlated with rainfall (Balfour & Howison, 2002; Staver et al., 2009). Most mesic areas experienced high fire frequency and have burned more than ten times between 1956 and 1996, while arid areas have a lower fire frequency and some areas have scarcely burned once in the same period (Balfour & Howison, 2002; Staver et al., 2009). The park hosts an African megafauna with many large mammal species, densities of which vary according to their habitat preference (Staver & Bond, 2014; Waldram, Bond, & Stock, 2008). The study area provides a unique opportunity to study drought impact on plant dynamics along a rainfall gradient and to compare drought impacts on the mesic savannah in Hluhluwe Game Reserve with the semi-arid savannah in iMfolozi Game Reserve.
2.2 Data collection
Ten sites were previously established in 1999 across a broad altitudinal gradient with five sites in the Hluhluwe Game Reserve and five sites in iMfolozi Game Reserve (Staver et al., 2009). At each site, grids were laid out for plant monitoring in various herbivore exclusion fencing treatments. Each grid was at least 20 m × 40 m. In this study, we used only data from the control treatments, which were accessible to all herbivores. All these plots were annually monitored from 2000 to 2012 (Staver & Bond, 2014). During the dry seasons after the 2000, 2002, 2004 and 2008 censuses, all sites were burned following management practice for the surrounding areas (Staver et al., 2009). Data collected at each site included identification of trees and grass species and measurement of tree heights and grass biomass as well as impala dung counts. Data from the period preceding the 2014–2016 drought could be used as a long-term control to compare the role of extreme drought in savannah dynamics. The drought ended with the start of the rainy season at the beginning of October 2016. Sampling took place, after the onset of rains, from 1 to 10 December 2016, before significant summer rains or growth. Repeat sampling took place in 1 to 10 December 2017. Each plot was divided into 20 transects of 2 m × 20 m by placing a pair of ropes with a length of 20 m in parallel. Thereafter, subplots were surveyed by walking systematically across each transect. Tree species were identified, and tree heights were measured of all woody stems throughout the control plots. Tree mortality and survival were monitored and grouped into four size classes: very small (0.1 m < h ≤ 0.3 m), small (0.3 m < h ≤ 2.0 m), medium (2.0 m < h ≤ 4.0 m) and large trees (h > 4.0 m) for analysis. Tree death and the causes of tree death were recorded. Tree dieback was recorded for each tree by identifying trees as undisturbed (no sign of damage by disturbance), disturbed (top-killed with dead stem still remaining) or dead. Top-kill (i.e. the death of one or more primary stems) might be caused by either drought, fire or herbivory. Top-kill was attributed to fire if there were signs of stems having been burned and these were corroborated by local fire records. Top-kill was attributed to herbivory if the stem was broken or pruned. Tree death was attributed to drought only or the combination of drought, fire and/or herbivory if there was sign of burning and no resprouting.
Perennial grass recovery was investigated by determining whether grasses resprouted from tussocks or recruited from seeds. It was relatively obvious as to whether a plant was a seedling or a resprout, as plots were censused soon after rains had commenced and thus seedlings would be small. Resprouting was confirmed by noting plant size and the presence of underground roots or tussocks. For each plot, only a single transect was taken through the middle of the plot. Grass biomass was measured using a Disk Pasture Meter (DPM). This consists of an aluminium disc of diameter 45 cm dropped from a standard height (Waldram et al., 2008). Twenty DPM readings were recorded at two-metre intervals along the transect. Under the disc, the four most common grass species were recorded and were categorised as emerging from seeds or resprouted from tussocks. As an index of relative importance, we estimated the DPM per species, by multiplying overall DPM values by 0.4 for the most common grass species, 0.3 for the second, 0.2 for the third and 0.1 for the least common grass species. Grass species were recorded as was the estimated percentage of grass cover beneath the disc for every DPM reading.
To determine herbivory pressure, dung was identified and counted in quadrats of 2 m × 2 m at every 2 m intervals along the middle of the plot. Here, we focused on impala browsing pressure since they are the most influential browsers that constrain sapling release (O'Kane et al., 2012; Staver et al., 2009).
2.3 Data analysis
2.3.1 Drought intensity

2.3.2 Drought impact on grass community

The ecological index method (EIM) was used to assess grass condition along the successional pathway varying from poor pioneer state to excellent state as assessed for livestock or wild grazers (Tainton, 1999; Westoby, Walker, & Noy-Meir, 1989). We categorised grass species (see definitions in the supplementary section) as decreaser (weighted as 10), increaser Ia and increaser IIa (weighted as 7), increaser Ib and increaser IIb (weighted as 4), and increaser IIc (weighted as 1) as summarised in Table S1. The veld condition was calculated as the sum of the product of relative abundance of each grass species by its ecological index method weighting (Tainton, 1999).
2.3.3 Drought impact on tree and impala demography
The plot surveys were used to assess comparative characteristics of tree and impala dynamics at two periods: predrought (2000–2009 and 2012) (Staver & Bond, 2014) and postdrought (2016 & 2017). The comparison was done for all sites and all years (except Sokwazela in 2012 due to the lack of data in that year). Tree height records were used to test drought impact on the changes in tree number distribution for each height class before and after the drought. The chi-squared test was used to assess whether changes in the tree number count per size class were significant or not. The Spearman correlation coefficient was calculated to assess correlation between annual rainfall and changes in tree frequencies for each size class at Hluhluwe and iMfolozi sites. Dung counts were used to assess drought impact on the changes in impala number.
3 RESULTS
3.1 Drought intensity
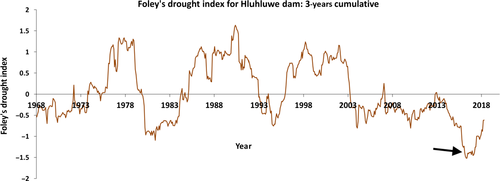
Annual rainfall at Hluhluwe dam station, just outside the park (Lat.: -28°.1214ʺS- Long.: 32°.1792ʺE), was lowest in the early 1980s and 2014–2016, with mean annual total of 526.7 and 382.6 mm, respectively. The records indicate that the recent 2014–2016 period experienced the lowest precipitation compared with any previously recorded period since records started in 1968 (Figure S1). Foleys index reveals major drought events in the early 1980s, early 1990s and 2014–2016 (Figure 1). The drought of 2014–2016 was the most intense drought of the entire rainfall record with Foleys index dropping below −1.5.
3.2 Drought impact on tree demography
The total number of trees surveyed in all sites in 2017 was 2047, which included 1838 undisturbed, 183 top-killed and 26 dead trees. Drought had negligible effects on tree mortality (2% mortality). The combined impact of predrought fire and drought was deemed to be responsible for only 0.15% of woody mortality, while the combination of drought and herbivory (mostly caused by elephants) caused 0.05% mortality (Table 1).
| Cause of damage | Totally killed | Top-killed | Total |
|---|---|---|---|
| Drought | 10 (0.49%) | 32 (1.56%) | 42 (2.05%) |
| Fire | 2 (0.10%) | 111 (5.42%) | 113 (5.52%) |
| Herbivory | 9 (0.44%) | 36 (1.76%) | 45 (2.20%) |
| Drought & herbivory | 1 (0.05%) | 1 (0.05%) | 2 (0.10%) |
| Drought & fire | 3 (0.15%) | 3 (0.15%) | 6 (0.29%) |
| Lightning | 1 (0.05%) | 0 | 1 (0.05%) |
In comparing the frequency distribution of woody plant height classes across the years for all Hluhluwe and iMfolozi sites, the very small and small size classes increased strongly in 2016 compared with 2012 (χ2 = 450, df = 1, p-value < 0.001), (χ2 = 177.8, df = 1, p-value < 0.001), respectively. The medium trees declined in 2016 and remained the same in 2017 compared with 2012 (χ2 = 3.2, df = 1, p-value = 0.07), while changes in the count of large trees were negligible (χ2 = 0.4, df = 1, p-value = 0.5, χ2 = 0.67, df = 1, p-value = 0.4 in 2016 and 2017 compared with 2012, respectively).
Generally, the fluctuation of tree numbers was independent of drought, as the increases and the decreases in tree numbers were small and occurred both pre- and postdrought (Figure 2). The above-mentioned behaviour of woody plants was noticed along the rainfall gradient in both Hluhluwe (mesic) and iMfolozi (semi-arid) sites (Figure 2).
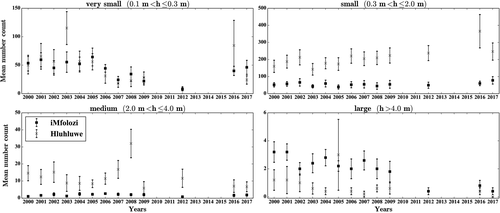
The relative change in woody plant numbers (Figure 2, Figure S2) showed greater increases in mesic (Hluhluwe) sites than semi-arid (iMfolozi) sites. A noticeable general increase from 2016 compared with 2012 was detected across all size classes in both Hluhluwe and iMfolozi sites except for the medium size class in Hluhluwe sites (Figure 2, Figure S2). The very small, small and large size classes increased by a factor of 10, 1.5 and 1, respectively, and the medium class decreased by a factor of about 3 in Hluhluwe sites (Figure S2). The very small, small, medium and large size classes increased by a factor of 4, 1.2, 2 and 2 in iMfolozi sites (Figure S2).
Correlations between rainfall variation and tree size classes changes were weak and nonsignificant (p > 0.10; Figures S3 and S4).
3.3 Drought impact on grass demography
During the drought, grass mortality appeared to be extensive as the ground was completely bare. After the drought broke, however, grasses resprouted vigorously. Grass biomass and especially grass cover displayed a strong decline from 2012 predrought to 2016 after 2 years of drought, but rapidly recovered in 2017 compared with 2012 in both Hluhluwe and iMfolozi sites (Table 2). Veld condition score deteriorated from 70% in 2012 to 27% in 2016 but subsequently improved to 90% in 2017 in both Hluhluwe and iMfolozi sites. This indicates that the long-term drought impact on veld condition was minor (χ2 = 2.5, df = 1, p-value = 0.11), as the veld condition had largely improved in 2017 after a significant decline in 2016 (χ2 = 16.98, df = 1, p-value < 0.001). Comparing mesic Hluhluwe sites with the more arid iMfolozi sites, veld condition showed the same trends in both sites. Veld condition scores were 96% in both sites in 2012, 48% and 51% in 2016, and 78% and 86% in 2017 at Hluhluwe and iMfolozi sites, respectively.
| Sites | Hluhluwe | iMfolozi | ||||
|---|---|---|---|---|---|---|
| Years | 2012 | 2016 | 2017 | 2012 | 2016 | 2017 |
| Average dpm (cm) | 4.3 | 2.0 | 3.5 | 2.8 | 2.2 | 3.9 |
| Grass cover (%) | 60% | 22% | 46% | 55% | 33% | 55% |
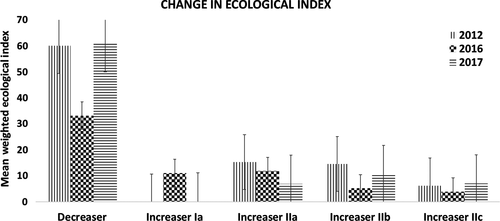
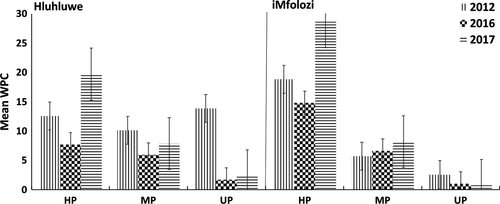
The drought impact on the ecological index also showed similar trends in both Hluhluwe and iMfolozi sites. The decreaser grass species responded to drought by a significant decline from 2012 to 2016 and a subsequent recovery in 2017 (see Figure 3). Drought slightly favoured increaser Ia species in 2016, while the increaser IIa, increaser IIb and the increaser IIc did not show any significant changes across the years. Regarding the changes in weighted palatability composition (WPC), there was no significant change in the highly palatable and moderately palatable grass species in response to severe drought in both Hluhluwe and iMfolozi sites. However, the response of unpalatable grass was a drastic decline of 86% in Hluhluwe and a smaller decrease from an already low base in iMfolozi in 2016 and 2017 relative to 2012 (Figure 4). The drought effect on grass composition and biomass was determined as the relative change in the average DPM per species, across 2012, 2016 and 2017 (Figures S5 and S6). The most marked effects in Hluhluwe sites were a sharp decline for the most common perennial Sporobolus pyramidalis (UP) (only occurs in Hluhluwe), Digitaria longiflora (MP) and Bothriochloa insculpta (UP) in 2017 and 2016 compared with 2012 (Figure S5). With regard to iMfolozi sites (see Figure S6), Urochloa mosambicensis (HP) showed a conspicuous surge after the drought and became one of the most dominant grasses. The annual Tragus berteronianus (MP) had no previous records before drought but showed a noticeable increase during droughts and disappeared subsequently after the drought ended.
3.4 Drought impact on impala demography
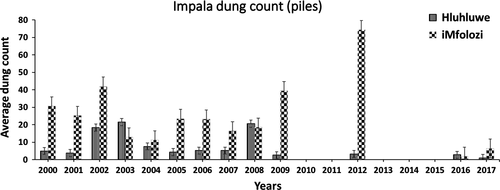
Impala dung counts were highly variable in the mesic (Hluhluwe) sites with low values in 2009 and 2012 prior to the drought. Impala dung counts in 2004–2007 were fairly low despite above-average rainfall. Therefore, herbivory impacts during the drought were likely negligible in Hluhluwe (Figure 5). Impala presence in the semi-arid (iMfolozi) sites clearly declined from their highest levels before the drought in 2012 to their lowest levels in the record during the drought in 2016 with minor recovery after the drought in 2017 (Figure 5).
4 DISCUSSION
Our rainfall analysis shows that our study area experienced the worst drought in the entire rainfall record (since 1968) and even worse than the severe droughts of the early 1980s and 1990s (Figure 1, Figure S1). Despite the severity of the drought, it did not have any substantial negative effect on tree demography (Table 1). This finding concurs with Viljoen (1995) who also found low tree mortality (7%) after the 1990s drought in the Kruger National Park. This indicates that the South African savannah system is strikingly different from other savannahs worldwide, or at least the examples selected by Fensham et al. (2009). HiP savannahs experienced a dramatic increase of 46% of the medium size trees from 2007 to 2014, before the drought (Case & Staver, 2017). After the drought, in 2016 and 2017 the small trees increased significantly compared to predrought censuses in 2012 (Figure 2). The increase in woody plants (0.1–4 m) in Hluhluwe was about double that in iMfolozi (Figure S2). However, increases in the very small woody plants have occurred previously such as in 2000–2005 which were not drought years (Figure 2). This might partially explain the weak correlation between rainfall variation and tree count (Figures S3 and S4). However, a significant increase for the very small size classes, relative to the usual response to rainfall variation, is seen during the drought years (Figures S3 and S4). This suggests that the significant increase in small trees might not necessarily be directly due to drought. As there was no fire during drought, and reduced competition from grasses, growth of small trees may have been favoured which could lead to an increase in the number of stems and their transition into larger size classes. As we found very few new recruits, increases in small trees probably reflect resprouting rather than recruitment. On the other hand, the role of drought in offsetting browsing pressure by reducing impala populations may also have favoured small trees. The crash of the impala population in Hluhluwe preceded the drought, confounding the analysis of drought effects on herbivory in Hluhluwe, while impala decline in iMfolozi would seem to be more directly linked to the drought (Figure 5). It is possible that the dense trees in Hluhluwe led impala to migrate to iMfolozi which is more open and has lower predation pressure (le Roux, Kerley, & Cromsigt, 2018).
Nevertheless, it is not clear whether the increase in woody plants was facilitated by drought via its direct adverse effect on grass productivity and thereby the competitive effect of the grass and the reduced fuel load for fires (February et al., 2013), or via its effect on reducing browsing pressure (Prins & van der Jeugd, 1993; Staver & Bond, 2014). Further studies are needed to investigate the interaction between droughts, herbivores and tree dynamics. Monitoring of grass biomass and grass cover as a response to the severe drought revealed a rapid and vigorous recovery by perennial grasses (Table 2). Our results are not consistent with O'Connor (2015) where he suggested that grass recovery from severe drought may take several decades under favourable condition of above-average rainfall, reduced grazing and absence of disturbance. Classic rangeland theory predicts that drought acts like heavy grazing causing a successional shift to increaser II (pioneer) species (Westoby et al., 1989). Our findings partly support these predictions, since the decreaser species responded to drought by noticeable decline, with a concomitant slight increase in the proportion of increaser Ia and the persistence of “pioneer” grass species ( increaser IIa, increaser IIb and increaser IIc) (Figure 4).
Veld condition experienced severe declines during the drought (from 70% to 27%) followed by rapid recovery (90%) in the subsequent year after the drought ended, in both Hluhluwe and iMfolozi despite the environmental differences in the two parks. The decline of veld condition during the drought was associated with the dramatic decline of the decreaser species in 2016.
One of the most interesting and unexpected results was the marked decline in unpalatable species over the drought period (Figure 4). There was a dramatic decline of the unpalatable perennial Sporobolus pyramidalis (increaser IIc), which was the most common grass in Hluhluwe before drought as seen in Figure S5. Bothriochloa insculpta, an unpalatable grass, common in places, also declined sharply. In contrast, there was a conspicuous boost of the highly palatable Urochloa mosambicensis (increaser IIc) during and after the drought, as it became one of the most common grasses in iMfolozi (Figure S6). However, in iMfolozi, droughts also triggered the recruitment of the pioneer, annual Tragus berteronianus which is considered to be an indicator of disturbed veld and emerges as a result of long droughts or overgrazing (Tainton, 1999). Tragus berteronianus was not recorded prior to 2012 in any of our study sites but exhibited a marked increase exclusively at the iMfolozi sites (Figure S6). There is no record for Tragus in our Hluhluwe sites (Figure S5). It is possible that the steep decline of perennial grass cover in semi-arid iMfolozi served to enhance the emergence of Tragus berteronianus from a seed bank, and possibly the grass cover in mesic Hluhluwe is seldom reduced sufficiently for Tragus to occur. However, our analysis lacks continuous representation of grass layer before the drought. Grass compositional changes can vary greatly across seasons and years, and we based our comparison on a single year (2012) to represent the predrought condition. Long historical records of grass biomass and cover are needed to corroborate the compositional changes in the grass layer during severe drought.
5 CONCLUSIONS
Our study suggests minor drought mortality, and possible tree gains during a very severe drought. The generality of these findings needs to be explored on a wider geographical basis, at multiple scales. The literature is dominated by studies claiming high tree mortality in droughts (Allen et al., 2010; Choat et al., 2012; Fensham et al., 2009; McDowell & Allen, 2015). Exceptions to the generalisations of severe impacts are of interest in pointing to which species, ecosystems and geographical regions may show opposite trends. Unfortunately, the unpredictability of major droughts means that researchers are often ill-prepared for the drought events.
ACKNOWLEDGEMENTS
We thank Hluhluwe-iMfolozi Park staff for logistical and technical support, particularly Dr. Dave Druce. We also thank Phumlani Zwane, Falakhe Dlamini, Vezokwakhe Frederick Ntshaba, Nhlakanipho Cabangokuhle Zulu and Sultan Hassan for logistical fieldwork support. Funding was provided by Alliance for Collaboration on Climate and Earth Systems Science (ACCESS), the National Research Foundation of South Africa (NRF) and South African Environmental Observation Network (SAEON), and data support from A. Carla Staver, Department of Water Affairs and Sanitation (DWAS), the Zululand Grass Project (ZLGP) and the Zululand Tree Project (ZLTP).
Open Research
DATA AVAILABILITY
This article does not contain data.


