Human settlement drives African elephant (Loxodonta africana) movement in the Sebungwe Region, Zimbabwe
Abstract
enUnderstanding the key drivers that influence the potential distribution of herbivore species in changing landscapes has been at the centre of enquiry in wildlife science for many decades. This knowledge is particularly important for keystone species like the African elephant (Loxodonta africana) whose population is declining even in conservation areas. The Sebungwe Region is part of the Kavango-Zambezi Transfrontier Conservation Area and supports ~4,000 elephants. The Sebungwe Region has lost an estimated 76% of its elephant population over the years. This study aimed to determine how the elephant distribution in the Sebungwe Region was affected by human settlement and whether the patches for elephant distribution were large enough for elephant habitation. The prediction of the potential distribution of the elephant was based on presence-only data modelled through an ensemble algorithm that combined several candidate models to enhance predictive ability. We observed that human settlement drives the potential distribution of elephants in the Sebungwe Region (test AUC = 0.95), and patches from the model were on average <1.5 km2. Our results provide initial insights into the key habitat factors that drive distribution of elephants in the Sebungwe landscape. Future conservation of the elephant could benefit from our study through systematic planning of settlements, which might help minimise human interaction with wildlife.
Résumé
frComprendre les principaux facteurs qui influencent la répartition potentielle des espèces herbivores dans des paysages en mutation est au cœur des recherches en science de la faune depuis plusieurs décennies. Cette connaissance est particulièrement importante pour les espèces clés telles que l'éléphant d'Afrique (Loxodonta africana) dont la population diminue même dans les zones de conservation. La région de Sebungwe fait partie de la zone de conservation transfrontière Kavango-Zambezi et abrite environ 4 000 éléphants. La région de Sebungwe a perdu environ 76 % de sa population d'éléphants au fil des ans. Cette étude visait à déterminer dans quelle mesure la répartition de l’éléphant dans la région de Sebungwe était affectée par les établissements humains et si les zones de répartition de l’éléphant étaient assez grandes pour l’habitation des éléphants. La prévision de la distribution potentielle de l'éléphant était fondée sur des données de présence uniquement modélisées à l'aide d'un algorithme d'ensemble combinant plusieurs modèles candidats afin d'améliorer la capacité de prédiction. Nous avons observé que les établissements humains déterminent la répartition potentielle des éléphants dans la région de Sebungwe (test AUC = 0.95), et que les parcelles du modèle mesuraient en moyenne <1.5 km2. Nos résultats fournissent un premier aperçu des principaux facteurs de l’habitat qui déterminent la répartition des éléphants dans le paysage de Sebungwe. La conservation future de l’éléphant pourrait bénéficier de notre étude par la planification systématique des colonies, ce qui pourrait aider à minimiser l’interaction humaine avec la faune.
1 INTRODUCTION
Half a century ago, scientists realised that increase in human population was exhausting available natural resources (Crutzen, 2006). To date, the human footprint has continued to grow unprecedentedly because of humanity's strong reliance on natural resources for its survival (Washington, 2013). For instance, previously reserved land for wildlife has been turned to agricultural fields, urban areas or logging sites, and this has resulted in habitat fragmentation and loss (Homewood et al., 2001). Poaching, habitat loss and fragmentation remain one of the main threats to wildlife especially for species that require extensive landscapes, for example, lions (Panthera leo) (Riggio et al., 2013) and African elephants (Loxodonta Africana; Lee & Graham, 2006).
At first, a few individual species were extinct and it was considered trivial because more were still available (Alcamo, 2003), but currently, species that were present half a century ago are now extinct from poaching and habitat loss (e.g., the Western black rhino [Diceros bicornis; Spillane, 2018]) and more are on the brink of extinction. Key factors that drive habitat loss include, but are not limited to, crop production for food security (e.g., in Ntshane and Gambiza (2016)), mineral exploration (e.g., in Neke & Du Plessis, 2004) and infrastructure development for tourism (e.g., in Reid, Thornton, & Kruska, 2004). In fragmented habitats, fragments may be insufficiently connected or too small to support viable populations (Fahrig, 2003) and this has been the case with most landscapes dominated by the African elephant. Isolated metapopulations are at risk if their patches are not connected well enough to satisfy species space requirements (Fahrig, 2013). This is usually the case with fragmented landscapes, and the isolated patches are not large or proximal enough to support the species therein (Fahrig, 2003). However, when the patches from habitat fragmentation are small and well connected, they can be able to support habitation as compared to small and isolated patches.
Previous studies on elephants in Zimbabwe have focused on their distribution and foraging patterns in different landscapes (Matawa, Murwira, & Schmidt, 2012; Muposhi, Chademana, Gandiwa, & Muboko, 2016) but what remains unanswered is whether the distribution patches from species distribution models (SDMs) are large or proximal enough to support elephant occupancy. In this study, we aimed to improve our understanding of elephant distribution in the Sebungwe Region of Zimbabwe, through the use of SDMs. This is because the Sebungwe Region has lost an estimated 76% of its elephant population over the years. This was after a marked increase in the utilisation of arable land after the land reform programme in Zimbabwe (Moyo, 2000). More importantly, this was done in areas previously left for wildlife to utilise (Murwira, Skidmore, Huizing, & Prins, 2010). Thus, we tested whether elephant occurrence in the Sebungwe Region is driven by interference from human settlement and whether the potential distribution patches of elephants are proximal or large enough for elephant utilisation.
2 MATERIALS AND METHODS
2.1 Study area
This study was conducted in the Sebungwe Region (hereafter Sebungwe) located in north-western Zimbabwe (Figure 1). The study area measures ~15,600 km2. The Sebungwe Region is part of the Kavango-Zambezi Transfrontier Conservation Area (KAZA TFCA) and has several protected wildlife areas including national parks (Chizarira and Matusadona National Parks), safari areas (Chete and Chirisa Safari Area) and a forest area (Sijarira Forest). In the safari areas, there is consumptive tourism, whereas in the national parks, there is nonconsumptive tourism. The landscapes between the protected areas are largely communal, and the land use is dominated by grazing land, cotton and maize fields. The area was deemed suitable for this study as it represents a landscape characterised by the expansion of human settlements, which could pose a threat to the existence of wildlife due to habitat fragmentation. There are no fences between the communal land and the protected areas. Previously, the Sebungwe Region was heavily infested with tsetse fly (Glossina sp); hence, there was minimal habitation in the area; however, after tsetse fly eradication, human settlement in the area increased (Murwira et al., 2010).
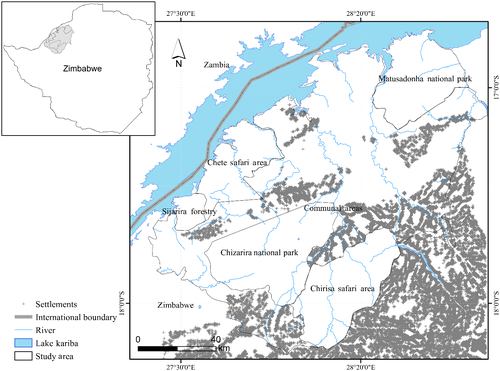
Natural vegetation in the study area is predominantly setaria grasslands and Miombo woodlands. This is supported by a unimodal rainfall pattern received between November–March averaging at least 500 mm (Murwira & Skidmore, 2005).
As of 2014, Sebungwe held an estimated four per cent of Zimbabwe's elephant population, and this was after a remarkable decline from 15,000 elephants in 2006 to 3,500 in 2014 (ZPWMA, 2015). Additionally, the estimated number of elephant carcasses expressed as a proportion of both live and dead elephants increased from 5.8% in 2001 to 30.2% in 2014 (Dunham, Mackie, Nyaguse, & Zhuwau, 2015). Owing to the declining elephant population, Sebungwe presents an opportunity to explore the key drivers for the distribution of large herbivores within an African savannah landscape.
2.2 Elephant presence data
Elephant presence data (n = 148) were collected towards the end of the dry season in September 2014 during a systematically designed aerial survey, for the Great Elephant Census to monitor large herbivores. Two observers aboard a Cessna 185 fixed wing aircraft searched 150-m-wide belt transects located to the right and left of the aircraft. Following laid out procedure, the aircraft maintained a flying height of about 300 feet (91.44 m) and a ground speed of ~160 km/hour. The location of elephants within the belt transects was marked using a Garmin hand-held GPS set. The locational error was limited to ±5 m when recording the species coordinates. The aerial survey was primarily conducted to estimate the population of large herbivores and not for the purpose of predicting the distribution of elephants. A detailed account of the procedure for the survey is documented by Dunham et al., (2015) and Dunham, Westhuizen, Westhuizen, and Ndaimani (2013).
2.3 Environmental variables
Five environmental variables (fire frequency, Normalised Difference Vegetation Index (NDVI), distance from water, distance from settlements and per cent tree cover change) were used to predict the spatial distribution of elephant in Sebungwe. Prior to their use in modelling, the environmental variables were tested for multicollinearity using the variance inflation factor (VIF) and the variables did not exhibit any multicollinearity as their VIF < 10 (Dormann et al., 2013).
Normalised difference vegetation index is an accepted proxy for vegetation vigour and was therefore used in modelling since it has been reported to be a key driver of elephant movement (Bohrer, Beck, Ngene, Skidmore, & Douglas-Hamilton, 2014). NDVI values range from −1 to 1, and areas with positive NDVI values are indicative of vegetation, whereas areas with negative NDVI values are either bare or completely covered by water. Distance from water was also used since elephants are water dependent and their use of the landscape could thus be driven by availability of water (Loarie, Aarde, & Pimm, 2009). Water surfaces were extracted from the Normalised Difference Water Index (NDWI) where areas with water were identified as those with NDWI > 0.5 (McFeeters, 1996). NDWI values range from −1 to 1 where negative values are representative of soil and high positive values are water surfaces. NDVI and NDWI were calculated from preprocessed Landsat eight imagery freely downloaded from www.earthexplorer.usgs.gov/ (accessed 1 August 2017) for the month of September 2014 to coincide with the time when elephant presence data were collected.
Distance from settlements was used as a proxy for human disturbance and human interference. The variable was included since human-dominated landscapes affect elephant habitat selection and resource use (Barnes, Barnes, Alers, & Blom, 1991; Lewis, 1986). The use of distance from settlement as a proxy has been used in several studies including in Mpakairi et al., (2017). All settlements in the study area were digitised from very high-resolution images freely available on the Google Earth platform. A settlement was defined as the central hut, even where a compound existed. Distance from settlements and distance from water were calculated using the Euclidean distance function in ArcMap 10.1 (ESRI, 2012).
Fire frequency drives vegetation structure and pattern; thus, it was used to predict elephant distribution in this study. For instance, elephants have been reported to avoid areas characterised by high fire frequency (Woolley et al., 2008). Additionally, the area is a wildfire hot spot (Mpakairi, Tagwireyi, Ndaimani, & Madiri, 2019). Fire frequency was derived from cumulating the fire scars using overlay analysis of monthly burnt scars for the period of 2007–2014.
Per cent tree cover change was used as a predictor variable since elephants prefer less fragmented patches for foraging (Gara et al., 2017). Per cent tree cover for 2007 was subtracted from that for 2014 to get change in tree cover over the 8 years. Per cent tree cover and fire frequency data were downloaded free from www.earthexplorer.usgs.gov/ (accessed 2 August 2017).
Data for all the environmental variables were projected and resampled to the same coordinate reference system and cell size, respectively, prior to their use in the final model.
2.4 Modelling technique
The elephant presence data and the five environmental variables were used to build an ensemble model in R (Team, 2013) using the Biomod2 package (Thuiller et al., 2016). Ensemble modelling was selected because of its ability to create a highly predictive consensus model from several other models. When models are used in isolation, they have several shortfalls hence the use of ensemble modelling. Seventy per cent of the data were used to calibrate the model, while the remaining 30% were set aside for model validation. The area under the receiver operating curve (ROC) was used to evaluate model performance and environmental variable contribution was based on permutations. The ensemble model was built from all the models yielding a ROC > 0.6; the ensemble model was used in predicting elephant distribution. Maps showing the potential distribution of elephants in Sebungwe were converted to binary (thresholded) using the equal test sensitivity (proportion of true positives) and specificity (proportion of false positives).
2.5 Proximity analysis
The level of fragmentation of the predicted elephant distribution was tested using the proximity patch index in Fragstat (McGarigal & Marks, 1995). The proximity index measures how well a patch relates to its neighbouring patch. More details on the proximity index are provided in Gustafson and Parker (1994) This analysis helped understand whether the size and proximity of patches were adequate for a thriving elephant population as stipulated by the island biogeography theory (Losos & Ricklefs, 2009).
3 RESULTS
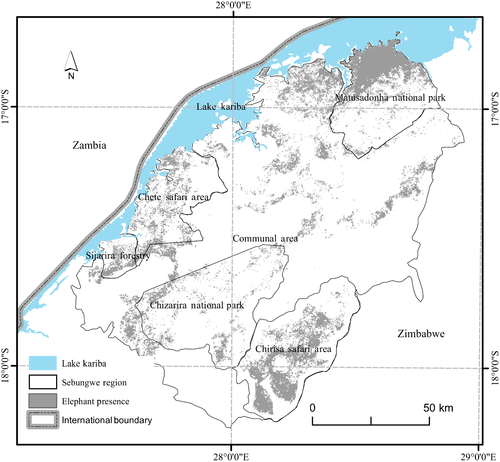
Based on the area under the receiver operating curve (ROC), results illustrate that the ensemble model managed to predict 95% of variability in the potential distribution of elephants in the Sebungwe Region. Of the five environmental variables used, disturbance, as depicted by distance from settlements, importantly influenced the likely distribution of elephants (82%) followed by NDVI, vegetation change, distance from water and fire frequency (Table 1). The probability of elephant presence was higher in the protected landscapes than in communal lands (Figure 2).
| Environmental variable | Variable contribution |
|---|---|
| Distance from settlements | 0.82 |
| Normalized difference vegetation index | 0.15 |
| Vegetation change | 0.09 |
| Distance from water | 0.07 |
| Fire frequency | 0.03 |
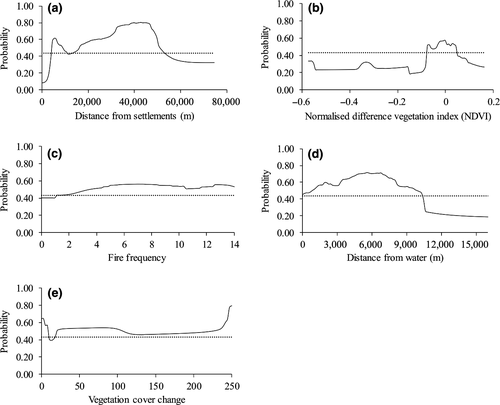
Our results illustrate that elephants prefer areas far from human settlements (>4,514 m), close to water (<10,449 m), with relatively low NDVI (−0.06 to 0.05), increased vegetation cover change (>18 of vegetation cover change) and average fire frequency (>1.2 fires in 7 years; Figure 3).
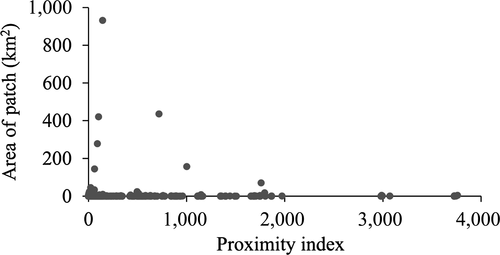
Notwithstanding the outliers, our data show that the patches of predicted elephant distribution are significantly different in size (p < 0.001). On average, the patches were ~1.13 km2 and relatively two km (2 km) apart (Figure 4).
4 DISCUSSION
We hypothesised that the predictor variables, fire frequency, NDVI, distance from water, distance from settlements and per cent tree cover change, could adequately explain variability in the potential distribution of elephants in the Sebungwe Region. We found that elephants select less disturbed areas located far from human settlement and areas with low vegetation greenness (i.e., low NDVI). Selection of areas far from humans could possibly be a strategy to avoid disturbance which is associated with edge effects, for example human–wildlife conflicts (King, Lawrence, Douglas-Hamilton, & Vollrath, 2009) or poaching (Muposhi et al., 2016). Additionally, in most human-dominated landscapes, the way elephants utilise their habitats can be affected as a result of human settlement (Pozo, Coulson, McCulloch, Stronza, & Songhurst, 2017). This is usually through urbanisation or clearing large parcels of vegetated land for agriculture. As such, when elephants are driven from landscapes that previously supported their nutritional needs, they are usually driven to degraded environments with limited resources (Kushwaha & Hazarika, 2004). Protected areas become havens of safety if they possess the amount of resources needed; otherwise, elephants move back to human settlements for crop raiding (Granados, Weladji, & Loomis, 2012). Our findings that elephants prefer areas distant from humans are in tandem with those by Barnes et al., (1991) and Murwira and Skidmore (2005). Barnes et al., (1991) found out that human settlements largely drove elephant movement in savannah environments of Gabon.
Our results show that areas mostly suitable for elephant habitation are on average ~1.13 km2 and proximal. Patches that are close together allow for easier elephant movements (Hargis, Bissonette, & David, 1998), since elephants are known bulk feeders that utilise large home ranges and proximal patches allow for such movement (Shannon, Page, Slotow, & Duffy, 2006). Although proximal and regardless of season, the patches from our study are relatively small when compared to literature (e.g., in Shannon et al., (2006)). In ecological niche modelling, it is usually advantageous that the modelled patches be extensive in size. This is because habitat size is strongly linked to population size (Bohrer et al., 2014). These small patches are rarely utilised by elephants as noted in Amboseli ecosystems by Gara et al., (2017). Elephants are keystone species and have remained endangered for decades. Their potential distribution as well as how their patches are proximal to one another is crucial to conservationists (Sanderson, Redford, Vedder, Coppolillo, & Ward, 2002). This study goes beyond the mere documentation of elephant potential distribution and further attempts to look at elephant habitat proximity from modelled patches. This study reinforces previous studies on the need to conserve elephants under a backdrop of habitat loss (e.g., Kushwaha and Hazarika (2004) and Hoare and Du Toit (1999)). Understanding elephant distribution makes cost-effective conservation plausible. Although the study lacks temporal detail (since it is a point in time prediction), the findings are useful because they give valuable insights on the influence of human settlement on elephant distribution. Since elephants seem to select areas far from humans, should there be deliberate attempts to create sharp divides (e.g., fences) between elephants and humans? Future studies on elephant distribution could focus on the optimal connectivity and spacing of their habitat patches, even in well-established transboundary parks such as the KAZA TFCA.
5 CONCLUSION
In the study, we found out that human disturbance, measured using distance from settlements, was the most important variable explaining elephant distribution in the Sebungwe area. We also found that predicted elephant habitat patches were relatively small and proximal. This finding provides preliminary explanation of habitat use by elephant in the Sebungwe Region. Future planners could benefit from our study through systematic planning of settlements to minimise elephant interaction with humans.
ACKNOWLEDGEMENTS
Data used in this study were collected during surveys funded by the “Great Elephant Census, a Paul G. Allen Project,” as part of a national survey of the African elephant in Zimbabwe. The surveys were conducted in partnership with the Zimbabwe Parks and Wildlife Management Authority.
CONFLICT OF INTEREST
The authors declare no competing interests.
AUTHOR CONTRIBUTIONS
KM and THM conceptualised the study. KM and HN helped with data processing and modelling. KM, HN and PTK helped in the writing of the manuscript.
Open Research
DATA ACCESSIBILITY
The location data that support the findings of this study were made available by the Paul G. Allen Project. Restrictions apply to the availability of these data.


