Assessing edge effect on the spatial distribution of selected forest biochemical properties derived using the Worldview data in Dukuduku forests, South Africa
Abstract
enThis work explores the potential of the high-resolution WorldView-2 sensor in quantifying edge effects on the spatial distribution of selected forest biochemical properties in fragmented Dukuduku forest in KwaZulu-Natal, South Africa. Specifically, we sought to map fragmented patches within forested areas in Dukuduku area, using very high spatial resolution WorldView-2 remotely sensed data and to statistically determine the effect of these fragmented patches on the spatial distribution of selected forest biochemical properties. Edge effects on carbon, LAI and foliar nitrogen were quantified based on the models derived by Omer et al. (IEEE Journal of Selected Topics in Applied Earth Observations and Remote Sensing, 2015, 8, 4825). Edge effect statistical results on the spatial distribution of carbon, LAI and nitrogen showed significant (α = 0.05) variations with change in distance from fragmented patches (>150 m2). Forest foliar carbon concentrations significantly (p-value = 0.016) increased from 44.8% to 45.3% with increasing distance (25–375 m) from fragmented patches. A similar trend was observed for LAI. Nevertheless, for nitrogen the results show that its concentration significantly (p = 0.016) decreased with increase in distance from the fragmented patches. Overall, the findings of this work underscore the invaluable potential and strength of WorldView-2 data set in assessing edge effect on the spatial distribution of selected forest biochemical properties.
Résumé
frCe travail étudie le potentiel du capteur de haute résolution WorldView-2 dans la quantification des effets de bord sur la distribution spatiale des propriétés biochimiques de forêt sélectionnées dans la forêt fragmentée de Dukuduku du KwaZulu-Natal, en Afrique du Sud. Plus précisément, nous avons cherché à cartographier des parcelles fragmentées au sein des surfaces forestières dans la région de Dukuduku, en utilisant des données de télédétection WorldView-2 à très haute résolution spaciale et à déterminer statistiquement l'effet de ces parcelles fragmentées sur la distribution spatiale des propriétés biochimiques forestières sélectionnées. Les effets de bord sur le carbone, le LAI et l'azote foliaire ont été quantifiés sur la base des modèles dérivés par Omer et al. (2015). Les résultats statistiques d'effet de bord sur la distribution spatiale du carbone, du LAI et de l'azote ont montré des variations significatives (α = 0,05) avec le changement de distance par rapport à des parcelles fragmentées (> 150 m2). Les concentrations de carbone foliaires des forêts ont augmentées de manière significative (valeur p = 0,016) de 44,8 à 45,3% avec l'augmentation de la distance (25 m à 375 m) des parcelles fragmentées. Une tendance similaire a été observée pour le LAI. Néanmoins, pour l'azote, les résultats montrent que sa concentration (p = 0,016) a diminué avec l'augmentation des parcelles fragmentées. Globalement, les résultats de ce travail soulignent le potentiel et la force inestimables de l'ensemble des données du WorldView-2 dans l'évaluation de l'effet de bordure sur la distribution spatiale de propriétés biochimiques des forêts sélectionnées.
1 INTRODUCTION
Forest fragmentation resulting from deforestation and disturbance has been identified as one of the most pervasive and deleterious processes threatening the existence of the tropical forests (Adams & McShane, 1992; Couts, 1970). Forest fragmentation may be caused by a variety of factors, including both natural processes, such as fires, climate variability, insect infestation and anthropogenic activities, for example, logging and road development (Pu, Ge, Kelly, & Gong, 2003). Fragmentation exposes the forest ecosystems to microclimatic environments, resulting in what has been coined as “edge effects” (Murcia, 1995a; Stimson, Breshears, Ustin, & Kefauver, 2004).
Edge effects include accelerated dynamics of forest biochemical properties, such as biomass (Laurance et al., 1997), altered biodiversity and composition of fragment biotas (Tabarelli, Mantovani, & Peres, 1999), increase in wildfire vulnerability (Cochrane & Laurance, 2002), tree mortality rates (Nascimento & Laurance, 2004; Tabanez & Viana, 2000) and carbon emissions (Broadbent et al., 2008). Land use activities, such as agriculture within the fragmented patches, may also influence nitrogen dynamics and ecological processes on the remnant vegetation (Pocewicz, Morgan, & Kavanagh, 2007). In addition, the edges may function as traps and concentrators for windborne nutrients and pollutants, thereby greatly influencing the below canopy chemical fluxes (Weathers, Kadenaso, & Pickett, 2001). Such fluxes have a cascading effect on the health and productivity of the edge vegetation. While the majority of detrimental edge effects extend from the transitional zone into interior forest areas to no further than one kilometre (Murcia, 1995b), some may extend as far as 5–10 km into intact forest areas (Curran et al., 1999).
In South Africa, indigenous forest fragmentation is considered to be one of the most important environmental issues facing the country. Studies have shown that only 10% of the original indigenous coastal lowland forests remain intact in South Africa, and 40% of this remnant can be found in Dukuduku forest in KwaZulu Natal Province (Cho & Debba, 2010). However, a total of 29% of the Dukuduku forest was lost to settlement and subsistence farming between 1992 and 2005, resulting in fragmented patches (Cho & Debba, 2010; Cho et al., 2012). Quantifying the edge effects on the spatial distribution of selected forest biochemical properties, emanating from fragmentation, helps to improve our understanding of the dynamics of indigenous forest ecosystem which is critical for conservation.
An understanding of the extent of edge effects on indigenous forest ecosystems requires quantitative, accurate and repeatable techniques that can measure the intensity of the effects into the forest habitat patches. Broadband multispectral remote sensing has been used to monitor forest fragmentation through traditional land cover classification techniques (Mucina, 2018; Newmark & McNeally, 2018; Thanh Noi & Kappas, 2018). However, understanding the edge effects requires detailed vegetation inventories, including species composition mapping, structure, nutrient variation, as well as biogeochemical dynamics (Cho & Debba, 2010; Cho et al., 2012; Omer, Mutanga, Abdel-Rahman, & Adam, 2015). Hyperspectral remote sensing has proven effective in characterising these vegetation features, due to high spectral resolution, which is capable of discerning subtle variations (Curran, Dungan, Macler, Plummer, & Peterson, 1992; Mutanga & Skidmore, 2004). More recently, a new generation of multispectral sensors, such as WorldView-2, Rapid Eye and SumbandilaSat (Mutanga, van Aardt, & Kumar, 2009), which include strategically positioned spectral bands in the red edge region of the electromagnetic spectrum, provides an affordable and effective remotely sensed data for forest mapping and monitoring (Cho et al., 2012). The objective of this study was to explore the potential of remote sensing in quantifying the effects of edge derived from forest fragmentation on the biochemical, biophysical and biological processes within an adjacent, fragmented area in Dukuduku forest in KwaZulu-Natal, South Africa. Specifically, we examine the gradient of edge effect from the fragmented patches into the interior, within a forest ecosystem.
2 MATERIALS AND METHODS
2.1 Study area
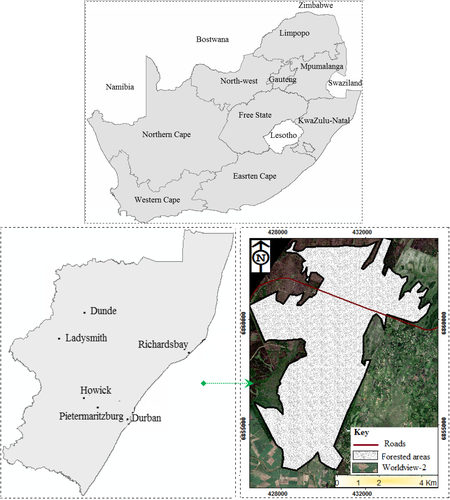
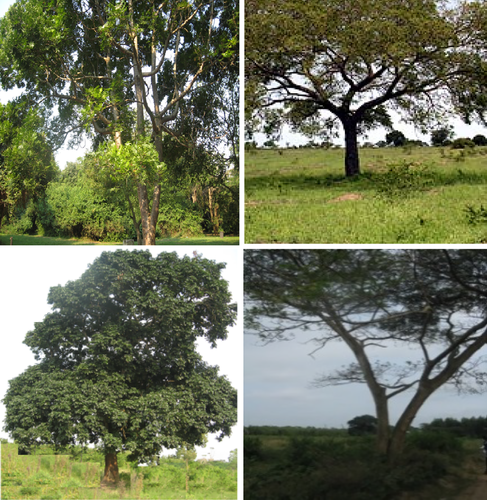
This work was conducted in the Dukuduku indigenous forests (i.e., between latitude 28°52′25″S and longitude 32°17′23″E), situated in the northern bank of Umfolozi River floodplain in KwaZulu-Natal, South Africa, at the entrance to the iSimangaliso Wetland Park (Figure 1). In the early 1960s, the area occupied ±6,000 ha of indigenous coastal forests and due to uncontrolled deforestation in 2011 the forest was decimated to 3,200 ha (Cho et al., 2013; Karumbidza & por los Bosques, 2006). Despite the ecological importance of this pristine indigenous forest area, field surveys and literature show that the area remains under threat from illegal settlements associated with agricultural activities (Cho et al., 2013; Karumbidza & por los Bosques, 2006; Ndlovu, 2013; van Wyk, Everard, Midgley, & Gordon, 2006). For instance, the study by Cho, Malahlela, and Ramoelo (2015) reported that forest conversion into squatter settlements (12,000–30,000) and small farms led to 29% forest loss in the area between the year 1992 and 2005 and the area remains at the risk of being replaced with commercial forest and sugarcane plantations. Dominant tree species in the area include Syzygium cordatum and Cussonia zuluensis, and recent research findings have established that certain tree species are under severe threat, due to rapid harvesting for woodcarving and traditional medicine (i.e., Albizia adianthifolia, Ekebergia capensis, Harpephyllum caffrum, Hymenocardia ulmoides, Sclercarya birrea and Trichilia dregeana; Mlambo, 2013; Omer et al., 2015). Figure 2 shows typical Dukuduku forest species, namely Albizia adianthifolia, E. capensis, H. ulmoides and Trichilia dregeana. Real-time spatially explicitly data would be needed to assess forest degradation to inspire timely intervention to prevent further destruction to the forest (Cho & Debba, 2010). The choice of this study site was driven by the rate at which vegetation is lost in this area and the need to inform policy makers and conservation of this pristine forest.
2.2 Field surveys and laboratory analysis
Field data collection was conducted between the 1 and 7 December 2013. The LAI was measured on 263 plots in Dukuduku forest indigenous forests. The measurements were conducted following a stratified purposive sampling method. A handheld LAI-2200 plant canopy analyzer (PCA) was used to measure LAI of the indigenous forests, and corresponding GPS locations were measured using a handheld Leica Geosystem GS20 to a submeter accuracy (±0.25 m; Geosystems, 2004). LAI was measured on clear sky weather conditions (Lottering & Mutanga, 2012). LAI samples were collected below and above canopy. During data collection, six indigenous tree species were selected for nitrogen and carbon concentration sampling. Tree leaf samples from the selected trees were clipped using a pair of scissors and kept in sealed brown paper bags to avoid the effects of the moisture loss and the sun. A total of 85 leaf samples were collected and then stored in a cooler box for transportation and chemical analysis. The chemical analysis procedure used in this study was that conducted by Lu (2006). A detailed description of this approach is documented in Lu (2006). Leaf samples were first oven-dried at 70°C for 48 hr and them mill-crushed to about 1 mm and then processed for complete feed analysis to estimate the N and CN concentrations in percentage.
2.3 Remote sensing data acquisition and preprocessing derivation of fragmentation patches/edges
To evaluate the utility of remotely sensed data (WorldView-2 sensor), in understanding the effect of forest edges on the spatial distribution of selected forest biochemical properties (i.e., carbon, LAI and nitrogen), a WorldView-2 satellite image was used. The image was acquired on the 1 December 2013, during the rainy season when forest plants productivity was approaching its peak. The image was captured under a clear sky. Worldview-2 is one of the few multispectral commercial sensor, with a very high spatial resolution, eight spectral bands (blue, green, red, NIR1, coastal blue, yellow, red edge and a new NIR-2 covering between 400 and 1,400 nm portions of the electromagnetic spectrum. The image has a spatial resolution of 2.0 m and 0.5 m for the eight bands multispectral and panchromatic bands, respectively (DigitalGlobe, 2010). To enhance accuracy in retrieving plant biochemical properties, the image was atmospherically corrected and transformed to canopy reflectance using the Quick Atmospheric Correction (QUAC) procedure in ENVI (Environment for Visualizing Images) 4.7 software (ENVI, 2009). QUAC performs in-scene-based atmospheric correction in the visible and near- to-shortwave infrared (VNIR-SWIR) regions of the electromagnetic spectrum for multi- and hyperspectral imagery. This algorithm determines atmospheric compensation parameters directly from information contained within the image (pixel spectra), thus allowing for the retrieval of accurate reflectance spectra (Shen et al., 2005). The acquired image was geometrically corrected (Universal Transverse Mercator: UTM zone 36 South and WGS-84 Geodetic datum) by DigitalGlobe™.
2.4 Spectral vegetation indices derived from the high spatial resolution WorldView-2 data
To estimate and map the selected forest biochemical properties, that is foliar carbon, LAI and foliar nitrogen, twenty-four spectral vegetation indices were derived from WorldView-2 satellite imagery based on two or more band combinations (Table 1). Literature shows that vegetation indices provide more stable vegetation information when compared to the use of raw spectral band information (Dube & Mutanga, 2015a; Dube, Mutanga, Elhadi, & Ismail, 2014; Dube, Mutanga, & Ismail, 2013; Jackson & Huete, 1991; Jawak & Luis, 2013). The twenty-four spectral vegetation indices were also computed based on the findings from previous work, which highlighted their successful application in the estimation of key forest biophysical and chemical properties (Dube & Mutanga, 2015a, 2015b; Güneralp, Filippi, & Randall, 2014). Detailed description of the indices applied is summarised in the study by Omer, Mutanga, Abdel-Rahman, and Adam (2016).
| # | Vegetation index | Equation | |
|---|---|---|---|
| 1 | SRI | Simple Ratio Index | NIR1/RED |
| 2 | NDVI | Normalized Difference Vegetation Index | NIR1 − RED/NIR1 + RED |
| 3 | RVI | Ratio Vegetation Index | RED/NIR1 |
| 4 | ARVI | Atmospherically Resistant Vegetation Index | (NIR2 (2 * RED − BLUE)/(NIR2 + (2 * RED − BLUE) |
| 5 | NLI | Non-Linear Index | (NIR2 RED)/(NIR2 + RED) |
| 6 | TVI | Transformed Vegetation Index | pNIR1 RED/NIR1 + RED + 0.5 |
| 7 | SIPI | Structure-Insensitive Pigment Index | (NIR1 BLUE)/(NIR1 RED EDGE) |
| 8 | RDI | Renormalized Difference Index | (NIR1 − RED)/(NIR1 + RED)½ |
| 9 | GNDVI | Green Normalized Difference Vegetation Index | (NIR1 − GREEN)/(NIR1 + GREEN) |
| 10 | MSR | Modified Simple Ratio | (NIR1/RED 1)/(NIR1/RED)½ + 1 |
| 11 | PSSRa | Pigment Specific Simple Ratio (Chlorophyll a) | NIR1/RED EDGE |
| 12 | PSSRb | Pigment Specific Simple Ratio(Chlorophyll b) | NIR1/RED |
| 13 | PSRI | Plant Senescence Reflectance Index | (RED EDGE − BLUE)/NIR1 |
| 14 | EVI | Enhanced Vegetation Index | 2.5 * ((NIR1 RED)/(NIR1 + 6 * RED − 7.5 * BLUE + 1)) |
| 15 | MCARI | Modified Chlorophyll Absorption in Reflectance Index | [(RED EDGE − RED) 0.2(RED EDGE − GREEN)](RED EDGE/RED) |
| 16 | MSR | Modified Simple Ratio | (NIR1 − BLUE)/(RED − BLUE) |
| 17 | NDI | Normalized Difference Index | (NIR1 − RED)/(NIR1 + RRED) |
| 18 | TCARI | Transformed Chlorophyll Absorption in Reflectance Index | 3[(RED EDGE − RED) − 0.2(RED EDGE − GREEN)(RED − EDGE/RED) |
| 19 | VARI | Visible Atmospherically Resistant Index | (GREEN − RED)/(GREEN + RED BLUE) |
| 20 | VGI | Visible Green Index | (GREEN − RED)/(GREEN + RED) |
| 21 | MND | Modified Normalized Difference | (NIR1 − BLUE)/(NIR1 + RED EDGE − 2BLUE) |
| 22 | CRI | Carotenoid Reflectance Index | (1/BLUE) − (1/RED EDGE) |
| 23 | GI | Green Index | (NIR1/RED) − 1 |
| 24 | RI | Red Index | (NIR1/RED) − 1 |
- a Blue, green, red, red edge, Near Infrared 1 and Near Infrared 2 are WorldView-2 bands.
2.5 Statistical modelling
To estimate and map the three selected forest biochemical properties, the models developed by Omer et al. (2015), based on the support vector machine algorithm, were used in this study. Support vector machine algorithm is one of the robust machine-learning algorithms which is characterised by the usage of kernels, and absence of local minima (Karamouz, Ahmadi, & Moridi, 2009). Omer et al. (2015) illustrate in detail the application of this model.
To assess the potential of high-resolution WorldView-2 sensor in quantifying edge effects on the spatial distribution of selected forest biochemical properties in fragmented Dukuduku forest of KwaZulu-Natal in South Africa, statistical analysis was performed using remotely sensed derived carbon, LAI and foliar nitrogen estimates. First, we generated 24 segments using the 25 m buffering distance from the derived fragmented patches >150 m2 in a GIS environment. The derived 25 m buffer shapefile was then overlaid with the biochemical properties maps of foliar carbon, LAI and foliar nitrogen. Then, within each of the 24 segments generated using the 25 m buffering distance, we further generated 50 random points (±10 m apart) using the Hawth's Analysis Tools in ArcGIS software. The generated random points were used to extract corresponding information from the three maps of the selected forest biochemical/physical properties (foliar carbon, LAI and foliar nitrogen) at different buffering distances. The extracted information on three selected forest biochemical/physical properties was then statistically analysed to see whether there were any significant variations (α = 0.05) with change in distance from the fragmented patches (150 m2). Analysis of variance (ANOVA) procedure was performed to test whether there were any significant differences (α = 0.05) in derived carbon, LAI and foliar nitrogen concentrations amongst various distance segments from the fragmented patches. We tested the hypothesis that the spatial distribution of selected forest biochemical properties in fragmented Dukuduku forest in KwaZulu-Natal, South Africa, varied significantly with change in distance from the edges. One-way ANOVA was used with a Turkey's honest significant differences post hoc test.
3 RESULTS
3.1 Principal characteristics of selected forest biochemical estimates in Dukuduku forest
Table 2 shows descriptive statistics for the selected forest biochemical (i.e., carbon, LAI and nitrogen) estimates derived from the Dukuduku indigenous forest. The results in Table 2 show that forest carbon varied between 42.92 and 96.29, whereas LAI ranged between 3.29 and 3.75 m2/m2. For nitrogen, the range was between 1.29 and 2.78. From the summary statistics reported in Table 2, it can be observed that across the forest under study, the estimated forest carbon and LAI did not vary significantly when compared to nitrogen.
| Selected biochemical properties | Min. | Max. | Mean | SD | SE |
|---|---|---|---|---|---|
| carbon | 42.92 | 46.29 | 45.31 | 0.57 | 0.02 |
| LAI | 3.29 | 4.23 | 3.75 | 0.16 | 0.01 |
| Nitrogen | 1.29 | 2.78 | 2.00 | 0.24 | 0.01 |
3.2 Estimation of the selected biochemical properties in Dukuduku forest
The three selected forest biochemical properties were estimated with high accuracies in terms of R2, root mean square error, %RMSE and bias values (Omer et al., 2016). One-to-one relationships between measured and predicted forest leaf carbon (CN) concentration (%), LAI and foliar nitrogen yielded higher estimation accuracies. For example, Table 3 shows that foliar nitrogen was estimated based on high spatial resolution WorldView-2 data set to a higher accuracy of R2 = 0.93, RMSE = 0.09 (1.74% of the mean and −0.2 bias), when compared to LAI with R2 = 0.71, RMSE = 0.05 (6.86% of the mean and 0.05 bias) and forest leaf carbon R2 = 0.68, RMSE = 0.18 (1.44% of the mean and 0.05 bias).
| R2 value | RMSE | %RMSE | bias | |
|---|---|---|---|---|
| LAI | 0.71 | 0.05 | 6.86 | 0.05 |
| Foliar carbon | 0.68 | 0.18 | 1.44 | 0.05 |
| Foliar nitrogen | 0.93 | 0.09 | 1.74 | −0.2 |
3.3 WorldView-2-derived land cover map of Dukuduku indigenous forests
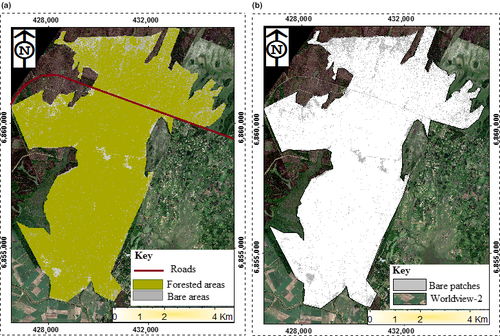
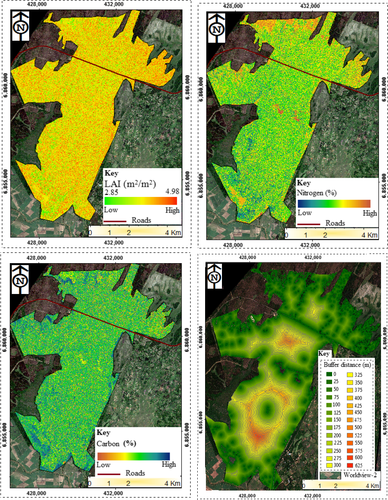
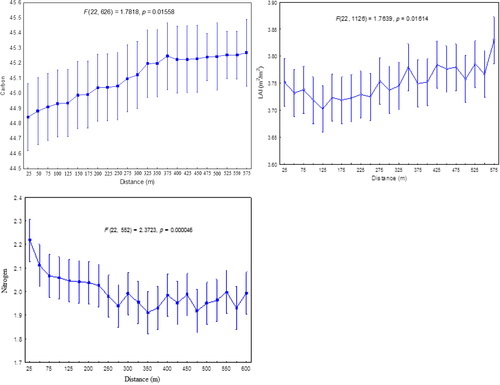
The results in Figure 3a,b show the WorldView-2-derived land cover map of Dukuduku indigenous forests derived from the WorldView-2 image using the SVM algorithm. It can be observed from the derived land cover map that Dukuduku forest is largely fragmented with bare patches larger than 150 m2 occurring over the entire study area. Figure 4 shows the spatial distribution of the derived foliar carbon, LAI and foliar nitrogen (Omer et al., 2016) From the derived maps, it can be observed that the three selected biochemical properties varied significantly (α = 0.05) across the area under study. For instance, LAI varied from 2.85 to 4.98 m2/m2. To further understand these variations in LAI, foliar carbon and foliar nitrogen, the derived land cover map with fragmented patches (>150 m2) was subdivided into segments, using a 25 m buffering distances away from the fragmented patches (>150 m2). The generated 25 m buffering distance map is shown in Figure 4. Detailed results on the derived variations of the three selected biochemical properties are summarised in Figure 5 and Table 4.
| Dist. | 25 | 50 | 75 | 100 | 125 | 150 | 175 | 200 | 225 | 250 | 275 | 300 | 325 | 350 | 400 | 425 | 450 | 475 | 150 | 500 | 525 | 550 | 575 |
|---|---|---|---|---|---|---|---|---|---|---|---|---|---|---|---|---|---|---|---|---|---|---|---|
| C | |||||||||||||||||||||||
| LAI | ** | ** | ** | ** | ** | ** | ** | ** | ** | ||||||||||||||
| N | ** | ** | ** | ** | ** | ** | ** | ** | ** | ** | ** | ** |
Note
- Significant level: α = 0.05.
- ** Significant differences.
3.4 Maps showing the spatial distribution of selected forest biochemical properties
3.4.1 Assessing the edge effect on the spatial distribution of the selected forest biochemical properties
Figure 5a–c shows statistical results on the edge effect on the spatial distribution of selected forest biochemical properties (i.e., carbon, LAI and nitrogen). It can be observed from the results that forest carbon content, LAI and nitrogen significantly (α = 0.05) varied with change in distance away from open patches. For example, carbon content significantly (p-value = 0.01558) increased with increasing distance (m) away from open patches. Between 25 and 375 m, carbon content increased exponentially from 44.8% to 45.3%, and between a distance of 375–575 m, forest carbon content became static without any changes observed (Figure 4). A similar trend was observed for LAI where an increase was also observed with an increase in the distance away from open space. An average of about 3.75 m2/m2 LAI values was observed around open spaces (0 m), and a significant increase was observed from 275 to 575 m away from the open spaces. However, for nitrogen, results of this study show that its concentration significantly (p = 0.01614) decreased with increase in distance from open spaces. The decrease becomes stable at 300–575 m away from the edges (Figure 4).
4 DISCUSSION
The aim of this study was to explore the potential of remote sensing in quantifying the effects of edge derived from forest fragmentation on the biochemical, biophysical and biological processes within an adjacent, fragmented area using the high-resolution WorldView-2 sensor in Dukuduku indigenous forest in KwaZulu-Natal, South Africa. The gradient of edge effect from the fragmented patches into the interior, within a forest ecosystem, also has been examined. In addition, the study tested whether there were any significant differences (α = 0.05) in derived carbon, LAI and foliar nitrogen concentrations amongst various distance segments from the fragmented patches.
This study has revealed that new generation WorldView-2 sensor with high spatial resolution and strategically positioned spectral band information has the potential to enhance the derivation of subtle forest information and estimate their variability from forest edges. The study successfully detected the influence of fragmentation on the spatial distribution of biochemical properties explicitly. What is important is that previous studies that attempted to examined edge effects used transects from the main forest edges inland, whereas in this study, all fragmented patches, including those inland, were considered and their impact on forest condition assessed in all directions using GIS (Geographical Information Systems).
The findings of this study demonstrate the crucial role of remotely sensed data in providing the spatial distribution of biochemical/physical properties explicitly of LAI, nitrogen and carbon stock estimates for different selected forests as well as enhanced the derivation of subtle forest information from forest edges over large fragmented landscape. Our findings are in confirmatory with other studies findings from literature that have showed or depicted remote sensing data as the only practical option to accurately and timely estimate biochemical/physical properties of selected forest species across various scales with affordable effort (Adjorlolo, Mutanga, & Cho, 2013; Bréda, 2003; Kun & Dongsheng, 2008; Pope & Treitz, 2013; Ramoelo et al., 2012). Unlike ground-based methods (Chason, Baldocchi, & Huston, 1991) which are subjective, pricy and require a dense network of inventory plots to reach good accuracies for estimating biochemical/physical properties, particularly when carried out in large area, and in some instances, unfeasible, due to high costs and being laborious, remotely sensed data provide an effective and robust primary data source necessary for large-scale estimation, with limited cost.
The results of this work also showed that the edge effect significantly (α = 0.05) influences the distribution of carbon, LAI and nitrogen in space. For instance, statistical results demonstrated that the derived forest carbon content increased with increasing distance away from fragmented forest areas or the detected patches. These findings imply that edge effects accelerate dynamics in forest health, forest biochemical properties and consequently the plant productivity in space (Broadbent et al., 2008; Laurance et al., 1997). This observation is in line with the findings from previous work which demonstrated that fragmented forests patches associated with various land use activities, such as agriculture, may also influence nitrogen dynamics and ecological processes on the remnant vegetation (Pocewicz et al., 2007). The study by Pocewicz et al. (2007) also showed that nitrogen content decreased with increase in the distance away from the detected fragmented patches.
Furthermore, previous studies show that leaf nitrogen and carbon concentrations in the fragmented forest ecosystem were significantly lower than those in the intact forest ecosystem (Cho et al., 2013; Omer, Mutanga, Abdel-Rahman, Peerbhay, & Adam, 2017). For example, Cho et al. (2013) concluded that indigenous forest fragmentation leads to significant losses in foliar nitrogen as most of the land use/cover classes, like agro-urban and grassland systems, resulting from forest fragmentation obtained least foliar nitrogen concentration when compared to the intact indigenous forest. In addition, the degraded forest patches and intensive cropping systems like maize and sugarcane in the fragmented ecosystem (Cho et al., 2013) could have led to poor soil fertility and hence less available nitrogen to the forest ecosystem. Less available nitrogen can lead to a poor photosynthetic system and therefore less foliar carbon content in the fragmented ecosystem as opposed to the healthy intact forest ecosystem that could have had relatively more available soil nitrogen and an efficient photosynthetic system (i.e., higher foliar carbon content; Omer et al., 2017). These findings are supported by literature which shows that the edges or patches within forests have the potential to act as traps and concentrators for windborne nutrients and pollutants, thereby greatly influencing the below canopy chemical fluxes (Weathers et al., 2001). These fluxes have been reported to be having a cascading effect on the health and productivity of the edge vegetation. While the majority of detrimental edge effects extend from the transitional zone into interior forest areas to no further than one kilometre (Murcia, 1995b), some may extend as far as 5–10 km into intact forest areas (Curran et al., 1999).
Comparatively, LAI results showed a similar trend to that of forest carbon, where an increase in the LAI was observed with an increase in distance from fragmented patches of >150 m2. These results suggest that the presence of fragmented patches within the Dukuduku forest affected the health, quality and general plant general productivity. These results are comparable with the findings from previous studies which reported that fragmentation in indigenous forest generally leads to significant losses in plant foliar nitrogen when compared to nitrogen concentrations in completely undisturbed forested areas (Cho et al., 2013; Davidson et al., 2004). The diverging observation in this study can be attributed to the surrounding of Dukuduku forest by sugarcane plantations and other emerging commercial farms that use nitrogenous fertilisers to enhance crop productivity.
Overall, the study provides promising results of forest foliar nitrogen, LAI and foliar carbon estimation and mapping in fragmented forest ecosystems such as those located in Dukuduku, South Africa—a previously challenging task using the older broadband multispectral sensors, such as the Landsat series, MODIS and SPOT data sets. Nonetheless, it is important to note that the findings of this study could be site specific (Dube & Mutanga, 2015a) considering that the data set applied in this study was for a specific study site with unique environmental and climatic conditions. Furthermore, these findings were restricted to a localised area given the costs associated with the acquiring the high-resolution WorldView-2 data (Dube & Mutanga, 2015a; Dube et al., 2014; Omer et al., 2015). There is, therefore, need for future studies to shift towards exploring the effects of fragmented patches on forest biochemical properties at landscape scale. Large-scale information on the spatial distribution of the selected forest biochemical/physical properties, such as LAI, forest foliar N and Carbon concentrations, would therefore require further assessment of satellite data with a global foot prints such as the newly launched Sentinel-2 sensor which is freely available at a high spatial resolution characterised by strategically positioned spectral bands. Therefore, the newly launched Sentinel-2 sensor of European Space Agency (ESA) with strategic bands in the shortwave infrared (SWIR) might provide new opportunities to routinely assess leaf nitrogen and carbon in a fragmented area (Cho et al., 2013). However, there would have to be some modifications to the respective methodology to account for the spatial configuration of the fragmented indigenous forest ecosystems.
5 CONCLUSION
The main aim of this work was to explore the potential of high-resolution WorldView-2 sensor in evaluating the edge effects on the spatial distribution of selected forest biochemical properties in fragmented Dukuduku forest in KwaZulu-Natal, South Africa. Specifically, we sought to (a) map the open patches and forested areas in Dukuduku using very high-resolution WorldView-2 sensor and (b) statistically determine the effect of these patches on the spatial distribution of selected forest biochemical properties in the fragmented Dukuduku indigenous forest ecosystems.
- Dukuduku land cover map of the area under study can be accurately derived with high accuracy (86.72%) from the high-resolution WorldView-2 satellite data.
- Spatial distribution of selected forest biochemical properties (i.e., carbon, LAI and nitrogen) varied significantly (α = 0.05) with change in distance from fragmented patches (>150 m2).
The findings of this work provide valuable information that could be utilised by forest managers, ecologists and the remote sensing community to understand the functioning, health and key changes of forest ecosystems. Moreover, the findings of this work underscore the invaluable potential and strength of applying very high spatial resolution (VHR) multispectral WorldView-2 data set, in the assessment of edge effect on the spatial distribution of selected forest biochemical properties in understanding of the dynamics of indigenous forest ecosystem which is critical for conservation.


