Elephant (Loxodonta africana) footprints as habitat for aquatic macroinvertebrate communities in Kibale National Park, south-west Uganda
Abstract
enThis is the first study where elephant footprints as habitat for aquatic macroinvertebrate communities were assessed. Preliminary observations during the dry season in Kibale Forest, Uganda, indicated that water-filled footprints constituted the majority of stagnant ponds. Consequently, this study aimed at giving an overview of the diversity and ecology of those habitats and the capacity of elephants as ecosystem engineers. The fauna and abiotic factors (age, size, substrate, organic matter, pH, canopy cover, temperature, conductivity) of 30 water-filled natural elephant footprints were sampled, resulting in the record of 61 morphospecies among 27 families/orders. Species composition was dominated by Hydrophilidae and Dytiscidae and influenced by environmental variables, such as age and organic matter. To study the colonization process, 18 artificial footprints were created within different distances from the water source. After 5 days, 410 specimens were collected, with higher species richness in artificial footprints closer to a natural water source. We conclude that colonization of water-filled footprints is fast, they constitute important habitats with high diversity and variability, and they act as stepping stones for dispersal and add to the ability of elephants as ecosystem engineers. We emphasize the importance of elephants as a key species in ecosystem dynamics and conservation practice.
Résumé
frCeci est la première étude qui évalue l'habitat que constituent les empreintes d'éléphants pour des communautés de macro-invertébrés aquatiques. De premières observations faites pendant la saison sèche dans la forêt de Kibale, en Ouganda, indiquaient que les empreintes remplies d'eau composaient la majorité des mares stagnantes. Cette étude vise donc à donner un aperçu de la diversité et de l'écologie de ces habitats et du rôle des éléphants en tant qu'espèce ingénieur. Nous avons échantillonné la faune et des facteurs abiotiques (âge, taille, substrat, matière organique, pH, couverture de la canopée, température, conductivité) de 30 empreintes naturelles d’éléphants remplies d'eau et nous avons relevé 61 espèces morphologiques appartenant à 27 familles/ordres. La composition des espèces était dominée par des Hydrophilidés et des Dytiscidés, et influencée par des variables environnementales comme l’âge et la matière organique. Pour étudier les processus de colonisation, nous avons créé 18 empreintes artificielles à différentes distances de la source d'eau. Après cinq jours, nous avons récolté 410 spécimens, et leur richesse en espèces était plus élevée dans les empreintes plus proches d'une source d'eau naturelle. Nous en concluons que la colonisation des empreintes remplies d'eau est rapide, qu'elles constituent des habitats importants où la diversité et la variabilité sont élevées, qu'elles servent de relais pour la dispersion et qu'elles s'ajoutent aux capacités des éléphants en tant qu'espèce ingénieur de l’écosystème. Nous insistons sur l'importance des éléphants qui sont une espèce clé dans la dynamique d'un écosystème et dans les pratiques de conservation.
Introduction
East Africa exhibits one of the largest and most outstanding concentrations of mammals (Gordon & Barbero, 2008). Kibale National Park, located in western Uganda, has several different biotopes, enabling high concentrations of various of these mammals, such as primates, carnivores, ungulates and elephants (Wanyama et al., 2009).
The African elephant is one of the most extraordinary animals in that region (Clarke & Bertin, 1989; Kingdom, 1989). Despite being very attractive and thrilling to tourists (Naughton, Rose & Treves, 1999; Briggs & Roberts, 2010), elephant damage to crops has led to ‘animosity, fear and detest’ among those sharing their lands with them (Naughton, Rose & Treves, 1999). Ivory poaching, which has become a large-scale illegal industry in a number of African countries, has been recognized as the main threat to elephant preservation in Africa (Clarke & Bertin, 1989; Kingdom, 1989; Naughton, Rose & Treves, 1999; Chiyo & Cochrane, 2005; Chiyo et al., 2005).
Elephants are large-scale ecosystem engineers and considered as major sediment disturbers (see Haynes, 2012 and references therein). They also play a role in the dispersal of tree seeds (Cochrane, 2003; Babweteera & Brown, 2010) and in the creation and maintenance of forest gaps (Struhsaker, Lwanga & Kasenene, 1996; Paul et al., 2004; Zanne & Chapman, 2005). Vanschoenwinkel et al. (2011) recently found out that elephants are effective vectors for the dispersal of aquatic organisms. These notwithstanding, the ecological importance of elephants as ecosystem engineers in Africa's different landscapes is not yet fully understood.
Additionally, elephants create water-filled footprints which can act as temporary habitats for aquatic macroinvertebrates. In this work, we accessed the aquatic diversity in such habitats, a matter that has not been subject to scientific studies so far, although elephant footprints have been mentioned as breeding habitats for mosquito larvae (e.g. Dutta et al., 2010). To understand the ecology of these footprints, we studied the natural diversity of their invertebrate inhabitants and the influence of ecological factors on their community composition. We believe both abiotic, such as age of the footprint or percentage of sunlit water surface, and biotic factors, such as predator/prey interactions, may influence the aquatic macroinvertebrate diversity and composition. To assess the initial colonization process of newly formed ponds, we created artificial footprints. We hypothesized that distance from the nearest water source and the surrounding habitat affects the colonization process of these ephemeral waterbodies.
Methods
Study area
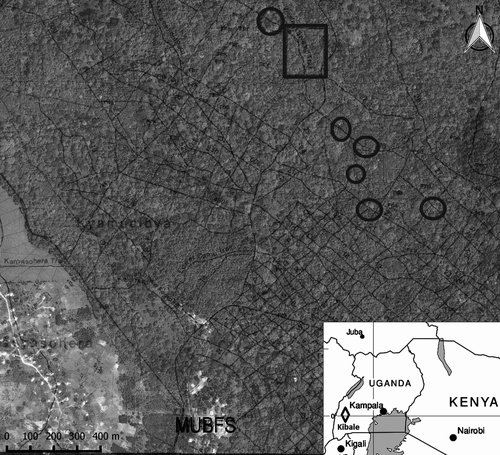
Kibale National Park, with an area of 766 km2, is located in south-west Uganda and consists of a medium altitude (1110-1590 m), tropical rainforest interspersed with swamp areas, grassland, degraded and regenerating forests (Chiyo & Cochrane, 2005; Chiyo et al., 2005). This study was carried out near Makerere University Biological Field Station (MUBFS) along the western swamp trail (Fig. 1). Due to a steep terrain in the area, most habitats have flowing water, although it might be a mere trickle through a swamp. True stagnant pools and puddles are rare and usually the result of activities of large mammals.
Field sampling
We sampled clustered natural footprints along elephant tracks from 16th to 18th July, 2014. Cluster size was defined as the number of water-filled elephant footprints (maximum cluster size was 30) between the points where we could not detect more footprints due to dense vegetation. We searched for sampling sites in the valleys north of MUBFS using the trail net of Kibale National Park. We sampled most of the footprints detected during the three days from 16th to 18th July. Solely elephant footprints containing water were considered. Due to the dry season, those footprints could only be found in swampy areas with soft and wet soil and a permanent supply of groundwater. We did not sample adjacent footprints so as to decrease the chance of pseudo-replication. We sampled clusters in seven locations with a maximum distance of about 700 m in between clusters and about 2 to 10 m between footprints within clusters.
For each footprint, the following physical and chemical conditions were measured: volume, canopy opening, temperature, coarse particulate organic matter (CPOM), substrate, pH, conductivity, distance to nearest footprint, distance to nearest water source (excluding footprints) and age (Johnstone & Elgilani, 2004; Yanoviak, Lounibos & Weaver, 2006; Rychla, Benndorf & Buczyński, 2011). Length, width, depth and further distance parameters were taken with a measuring tape. Canopy opening (per cent of overhead area not occupied by canopy) was measured with a spherical densiometer (Model-C, Forest Densiometers, Forestry Suppliers Inc.). Temperature and pH were both measured at the same time, using a pH-sonde with included thermometer (pHep®, Hanna Instruments). Conductivity was measured with a Primo 5 (Hanna Instruments). Distances to the closest footprint and respective water source were measured between the closest borders of the respective waterbodies. CPOM was assessed semiquantitavely in a five-stage categorical variable, in which 1 refers to no organic matter present in the water (both dead and alive), and 5 refers to a footprint which was loosely but completely filled with organic matter. CPOM included dead organic matter such as tree leaves and twigs and living amphibious plants. The estimation of CPOM content was conducted in the field via emptying of the footprint with a net (mesh size: 2 mm). Substrate was also assessed categorically in three steps from soft to hard, depending on the easiness to penetrate the bottom of the footprint with a knife. Age was defined as young, medium or old. Estimation of age was deduced from the developmental stage of the vegetation growing inside and around the footprint, the visual appearance of the footprints edges (eroded or still sharp) and the general aspect of the respective track (possible clues: fresh droppings, totally recovered vegetation on the track).
To assess the macroinvertebrate community of the natural footprints, five sample sweeps were performed in each pond using a sieve with a diameter of 16 cm and a mesh opening of 2 mm (Brower, Zar & von Ende, 1998; Osborne et al., 2001). After each sweep, the content of the sieve was placed in a white basin and specimens were collected with a pincer. The collection by one person was time limited to 5 min.
Artificial elephant footprints
The aquatic macroinvertebrate communities in the initial stage of the colonization process of artificial footprints were compared between different distances from the presumed population source: the nearby stream and surrounding swamp. Therefore, six transects were drawn perpendicularly to the stream along the western swamp trail. Each of the six transects consisted of three artificial footprints: one positioned near the stream (A) (about 1 m distance), a second one positioned in the ecotone between swamp and forest (B) (about 20 m distance) and a third one positioned in the forest (C) (about 40 m distance). Distances between artificial footprints in each transect were as similar as possible, but the complexity of the swamp associated with dense vegetation did not allow for precise distances to be maintained. To build an artificial elephant footprint, buckets with ≈30 cm diameter and ≈30 cm depth were sunk into the ground so that the edge of the bucket was on one level with the surrounding soil (14th July) and filled with 19 cm of water (15th July). Soil of the direct surrounding was used to cover the bottom of the bucket with substrate. Physical conditions of the artificial footprints were assessed after five days using the same variables as in the natural footprint assessment along with one more variable: surrounding habitat (categorical variable from swamp to forest), which corresponds to distance of the stream. On the last day (20th July), the buckets were emptied through a sieve (2 mm mesh size) and all specimens were collected.
Species identification
Identification of the macroinvertebrates was made to the highest attainable taxonomic resolution, and specimens within a taxonomic unit were allocated to morphospecies. In most cases, the determination level was the family. We used key and reference books for aquatic invertebrates (Lehmkuhl, 1979; McCafferty, 1998; Dijkstra & Clausnitzer, 2014; Suhling, Müller & Martens, 2014).
Statistical and data analysis
All statistical analyses were performed using ‘R Studio’ (Version 0.98.1091, R Core Team, 2014) and implemented packages (gdata, vegan, dendextend, MASS). The diversity measurements Shannon index, species richness and total abundance for each natural and artificial footprint were calculated with the statistical program ‘Past’ (Hammer, Harper & Ryan, 2001; free download at folk.uio.no/ohammer/past/). We compared differences in aforementioned diversity measurements between natural footprints of different ages (young, medium, old) and artificial footprints in different distances to the stream with one-way anovas and subsequent multicomparison tests (Tukey's ‘honest significant difference’ [HSD] test). The homoscedasticity and normal distribution of the data were tested before performing anovas applying the Fligner–Killeen test and Shapiro–Wilk normality test, respectively. The abundance data were square root-transformed to normalize and avoid skewness. We additionally assessed the β-diversity between these distances using Jaccard similarity coefficient (Magurran, 1988). To compare the communities between artificial and natural as well as between different distances from the stream and to assess overall variability, we conducted a cluster analysis based on Bray–Curtis dissimilarities. We performed an analysis of similarities (ANOSIM) based on Bray–Curtis distances, using square root-transformed abundance data, to assess community differences between artificial and natural footprints, between age classes of natural footprints and between artificial footprints in different distances from the stream. To identify influential environmental variables for the community composition, we performed a constrained correspondence analysis (CCA) with a subset of the most influential variables (volume, canopy cover, CPOM content, substrate hardness, conductivity, age). To analyse the relationship between predator and prey abundances in natural footprints, we calculated the Pearson correlation coefficient (r) and the coefficient of determination (r2). To visualize and assess this relationship, a general linear model (function ‘lm’, implemented in R) was applied.
Results
Natural footprints
A total of 2751 specimens taken from 30 natural footprints were collected. The 61 detected taxa were assigned to 27 families or orders. The most diverse families were Hydrophilidae (13 taxa) and Dytiscidae (9 taxa), whereas the highest abundances were found in Culicidae (1044), Dytiscidae (641), Hydrophilidae (495) and Chironomidae (187). A detailed table of taxa is provided in the (Table S1).
The results of the abiotic factors are summarized in the (Table S2). Whilst the bulk CPOM was made up of dead tree leaves, in some old footprints, living amphibious vegetation was abundantly growing into the water from the outside.
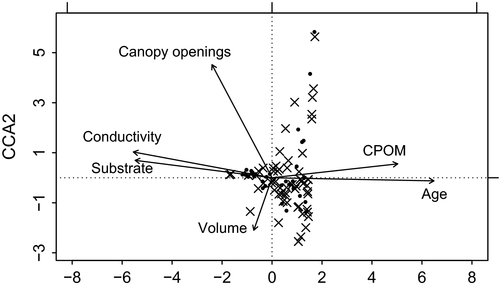
The CCA (Fig. 2) suggests that all ecological factors assessed here might have an influence on community composition and species occurrence in elephant footprints. The analysis shows that age and organic matter, which are strongly correlated (r = 0.84, r2=0.71), are important variables in the colonization patterns of numerous footprints. Most species exhibit a positive correlation with age and CPOM content. Another cluster of footprints and species is positively correlated to substrate and conductivity of the water. Volume does not show a strong gradient, but some species are positively correlated to high volume. Additionally, communities of some footprints might be influenced by low canopy cover.
When comparing footprints by their age in terms of α-diversity (measured by the Shannon index H), old footprints show the highest values and footprints of medium age show the lowest (anova: F = 5.26, P = 0.01182) (Fig. 3). Old footprints have an α-diversity significantly higher than medium-aged footprints (Tukey′s HSD, P = 0.011). No significant differences occur between old and young and between young and medium footprints (Tukey′s HSD, P = 0.171 and P = 0.85, respectively).
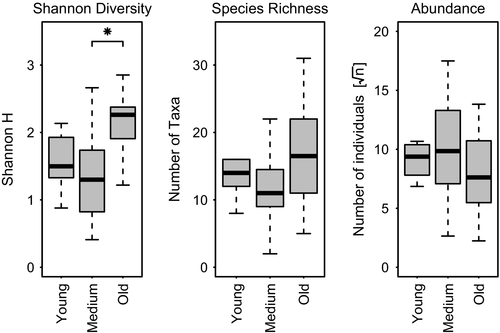
Old footprints have the highest species richness, followed by the young and medium footprints, although no significant differences were found (anova: F = 2.09, P = 0.14). On the other hand, medium-aged footprints show higher total number of individuals, again with no significant differences (anova: F = 0.965, P = 0.36) (Fig. 3).
The ANOSIM revealed differences in community composition between the age classes young and old (R = 0.36, P < 0.05) and between medium and old footprints (R = 043, P < 0.01). No differences were found between age classes young and medium (R = -0.07, P = 1) (Bonferroni-corrected P-values).
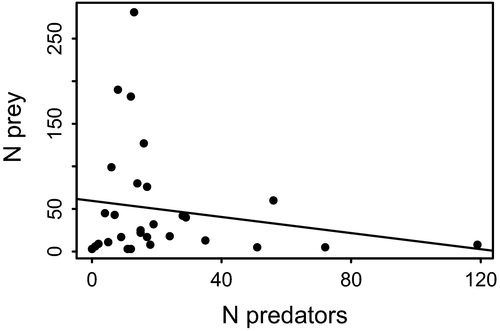
The Pearson correlation coefficient of -0.18 suggests a very weak negative relationship between predator and prey abundance (Fig. 4). The coefficient of determination (r2) of 0.0324 shows that 3.24% of the data points are explained by the model. According to the general linear model, the prey abundance is not significantly correlated with the number of predators in a footprint (F = 0.9, P = 0.35).
Artificial footprints
A total of 410 specimens assigned to 21 different taxa and morphospecies (10 families) were sampled in the artificial footprints. A detailed table of taxa is provided in the (Table S1). Abiotic factors are summarized in the (Table S2).
Diversity (measured by the Shannon index H) was significantly higher in footprints in B distance than in C distance (Tukey′s HSD: P = 0.04). No significant differences occurred between A and B as well as A and C distances (Tukey′s HSD: P = 0.35 and 0.42, respectively). The number of taxa (species richness) was significantly higher in A and B distances than in C distances (Tukey's HSD: P = 0.011 and 0.011, respectively), whereas no significant difference occurred between A and B distances (Tukey's HSD: P = 1). The absolute abundance of footprints in A distance seems to be higher than in B distance, although not statistically significant. Statistically significant differences in abundance occur between distances A and C (Tukey's HSD: P = 0.008) (Fig. 5).
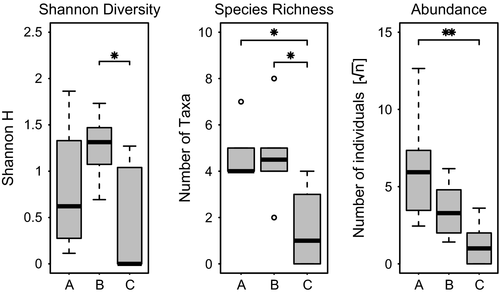
We used Jaccard similarity coefficient to assess the β-diversity between sites in different distances to the stream. Similarity between footprints at sites A and B, A and C, and B and C was 0.33, 0.45 and 0.25, respectively. The analysis of similarities could not detect any differences in community composition between groups of footprints in different distances (ANOSIM: R = 0.05, P = 0.28).
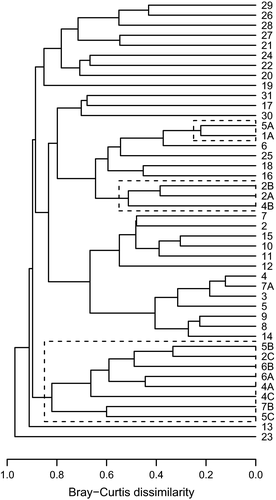
The Bray–Curtis dissimilarity dendrogram (Fig. 6) shows a low overall similarity of communities in natural as well as in artificial footprints. A separation of natural and artificial footprint communities is evident (ANOSIM: R = 0.46, P < 0.01). Furthermore, it reveals a tendency of artificial footprint communities to be increasingly similar to natural footprint communities with decreasing distance to the stream.
Discussion
Here, we most likely present the first study of elephant footprints as habitats for aquatic invertebrates. This is a preliminary study conducted with a limited sample size over a short time period. Nevertheless, the results are noticeable and should eventually be taken up in a larger study design.
The elephant footprints create suitable habitats for over 62 taxa from various aquatic groups, ranging from mosquito larvae to tadpoles. To truly assess the composition of such communities, a full identification of organisms would be necessary. As many of the tropical macroinvertebrates are yet unknown to science (Godfray, Lewis & Memmott, 1999), the need for taxonomical studies is hereby advocated. Nevertheless, the allocation to morphospecies allows a description of the invertebrate communities based on diversity indices that reveal a high species richness and some degree of variability between footprint communities in relation to the environmental factors sampled. It should be noted that the actual species richness is surely higher than recorded here because of omitting organisms below 2 mm body size due to the sampling method.
As far as natural footprints are concerned, we can see that there are several environmental factors that may affect the species composition of an elephant footprint. The CPOM content of footprints has a positive correlation with age, as leaves are trapped and plants grow in them over time. These two factors seem to influence a rather large group of organisms and are probably key factors in the forming of distinctive communities in old footprints. Tadpoles should receive special attention here because, although not being part of the invertebrate community, they also benefit from ‘ponds’ created by elephants, but were only present in old footprints. Tadpoles do function as food for larger invertebrates, such as coleopteran or dragonfly larvae. The latter were found in several footprints, with larvae from the Libellulidae found in footprints of all age classes, whilst larvae of Coenagrionidae were only found in older footprints, as they need submerged vegetation for oviposition. These findings suggest that there is a succession in the species composition of a footprint over time and that these footprints may also play important long-term roles in several aquatic species, such as frogs. The CCA suggests that conductivity and substrate also affect the species composition of these habitats, although these factors cannot be separated here and their actual significance in this context remains rather obscure. In general, hardness of the bottom substrate of a pond can influence the type of organisms present; for instance, the capacity to burrow eggs or to hide from predators may change with this factor (McCafferty, 1998). Consequently, species composition of a footprint may change according to substrate properties. Conductivity of the water varied greatly among the footprints sampled, even within footprints of the same cluster (from 55 to 949 μS cm−1). We infer that the deposit of elephant excretions in the footprints may be the cause for such differences. Presence of more or less ions in the water may, again, favour different types of organisms, such as Culicidae larvae (Rychla, Benndorf & Buczyński, 2011). Other variables seem to have a lesser influence on their own. Nevertheless, they seem to interact with each other in shaping the species composition of the footprints and should be taken into account in further studies.
According to Macarthur & Wilson (1967), we would expect that distance to the nearest water source, that is the source of aquatic organisms, would play a major role in defining aquatic macroinvertebrate communities. However, most of the footprints are grouped in clusters/tracks and could act as stepping stones of dispersion among all other surrounding footprints. Time also seems to be a crucial factor for the establishment of species within a footprint as we could observe a succession in the species composition dependent on the footprint's age.
Although not significant in most cases, the comparison of natural footprints diversity measurements according to their age (Figure 3) suggests that old footprints embrace more species and show higher levels of α-diversity, whilst holding a smaller number of individuals. Younger footprints are still in the initial stage of colonization and have been accessible for dispersers for a shorter time period. If a footprint is colonized by r-strategists which lay many eggs in the absence of predators, the number of individuals can be much higher (although being represented by few species). In time, species composition will change and biotic interactions will intensify due to higher degrees of competition and predation (Townsend, 1991). This is underlined by our observation that species diversity and number of predators such as dragonfly larvae increased with age of the footprints, whilst the number of individuals decreased. A general change of communities with increasing age is shown by ANOSIM. Comparison of species richness and number of individuals, however, reveals no significant differences. The succession of footprint communities should be subject to further studies.
Besides abiotic factors such as the ones we sampled, biotic factors such as predator–prey interactions are equally crucial in defining communities of small water bodies (Fincke, Yanoviak & Hanschu, 1997; Urban, 2007; Chase, Burgett & Biro, 2010). Although we did not take predator–prey interactions into consideration when designing the methodology, we observed the tendency that the presence of predators has a negative effect on prey abundance (Figure 5). This may also be a result of ageing (i.e. duration) of the pond, as suggested by Schneider & Frost (1996), in their study about habitat duration and community structure. A closer and more specific look into biotic factors such as predator–prey interactions would foster our understanding of the community dynamics and colonization process.
We hypothesized that distance to the stream can affect the colonization process. In our artificial footprint experiment, we tried to control every other ecological variable to see how the colonization process is influenced by the distance to the nearest source of aquatic organisms.
The colonization progressed unexpectedly fast. On the first day, we already registered water beetles inhabiting several footprints and occasionally spider webs that covered parts of the surface. After five days, the 18 footprints were inhabited by 410 individuals. One trigger for the fast colonization of new footprints, whether man or elephant made may be the absence of predators. Key predators in the elephant footprints are dragonfly larvae from the Libellulidae family. Adult male dragonflies (Hadrothemis coacta, Palpopleura portia and Tetrathemis camerunensis) have been frequently observed to hold a water-filled footprint as a territory. Also the artificial footprints were quickly found by dragonflies and occupied as territories. Being strong predators to other invertebrates and also to their own relatives, there is a struggle to place eggs as the first ‘top predator’ in a waterbody (Clausnitzer & Lindeboom, 2002; Suhling, Martens & Marais, 2009).
According to Macarthur & Wilson (1967), we compared α-diversity among three sets of distances. We expected that the closer the footprint is to the water source, the higher the diversity. Although we could indeed observe a significantly higher number of species in the footprints nearer to the stream (A and B distances), we found that diversity was highest in the intermediate distances, which contradicts our predictions. Jaccard similarity coefficient also shows that there were bigger differences in species composition between footprints of sites B and C than between sites A and C. We may infer that these results are explained by a low number of replicates in our study. It should be taken into account that, due to the short time span of exposure, the colonization events which occur by chance could have a high influence on species composition. Nevertheless, we can still see a trend towards our predictions as the diversity, species richness and abundance in C footprints were lowest. This trend is also supported by the Bray–Curtis dissimilarity which shows that the communities of the artificial footprints that are closer to the stream tend to be more similar to natural footprint communities than the artificial footprints in greater distance to the open water course.
Conclusively, we could show that elephant footprints play an important role as habitats for aquatic communities. We recommend repeating this study with more replicates over a longer period of time, also considering oxygen levels (Osborne et al., 2001) and biotic interactions in food webs (Urban, 2007; Chase, Burgett & Biro, 2010). Considering a wider range of habitats as well as replicating, this study during wet seasons might reveal totally different communities (Godfray, Lewis & Memmott, 1999).
The elephant has already been proven to have several functions in tropical rainforests. Besides being a seed disperser, maintaining the landscape heterogeneity by creating gaps and being crucial in nutrient cycling, we are now closer to perceive yet another role for this ecosystem engineer. The fast colonization process highlights the suitability of the footprints as stepping stone habitats for the dispersal of aquatic macroinvertebrates over larger distances. This function might be especially pronounced in the rainy season, when water-filled footprints are certainly more numerous especially on higher terrain outside the swampy areas. Without elephants, the number of small and stagnant water bodies, forming a network through the Kibale Forest, would be next to zero. The steep relief in most parts of the area results in streams and muddy parts with some water currents largely preventing the formation of stagnant pools. This fact strongly suggests that the aquatic macroinvertebrate fauna depends on water-filled footprints as habitat and as a refuge during dry periods. In forest conservation practice, the elephant should be considered as an important ecosystem engineer, creating habitats for numerous aquatic species, especially from the insect class.
Acknowledgements
We thank the Tropical Biology Association (TBA) for giving us the opportunity to work in Kibale National Park, Uganda. We would like to thank all the teachers of the course for their constant inputs and support. We would also like to express our gratitude to the British Ecological Society (BES) for giving grants and therefore enabling us to advance in our scientific careers. We thank the Makerere University Biological Field Station's (MUBFS) staff for cleaning our muddy clothes and supporting us with excellent food and drinks. Last but not least, we would like to express our humble admiration to the African elephant as well as our deep appreciation for the forests of Kibale, for inspiring us and providing us with numerous questions yet to answer.


