Evaluating performance of aerial survey data in elephant habitat modelling
Abstract
enAerial survey data are widely used to model distribution of wildlife. However, their performance in habitat modelling remains largely untested. We used aerial survey and satellite-linked Global Positioning System (GPS) collar data for elephants, to test (i) whether there is an optimal spatial resolution of predictor variables at which habitat models based on aerial survey data that are uncorrected for locational error can accurately predict elephant habitat and (ii) whether habitat models based on these data sets can accurately predict the presence of elephants in closed woodland habitats. We applied maximum entropy modelling (Maxent) to these data sets and used the Normalised Difference Vegetation Index (NDVI) as well as distance from water points as the habitat predictors to answer these questions. Our results demonstrate better ability of aerial survey data to predict elephant presence at the coarser spatial resolution of 1000 m of both predictor variables. Habitat models derived from aerial survey data underpredicted elephant presence in more closed woodland habitats than those derived from GPS collar data. This result implies that elephants located under dense tree canopies are likely missed during an aerial survey. Our study is one of the first to empirically test and report results on the poor performance of aerial survey data in habitat modelling especially in dense woodlands.
Résumé
frLes données provenant d'études aériennes sont largement utilisées pour modéliser la distribution de la faune sauvage. Pourtant leurs résultats dans la modélisation de l'habitat n'ont pour la plupart jamais été testés. Nous avons utilisé une étude aérienne et des données provenant de colliers GPS posés sur des éléphants pour tester (1) s'il existe une résolution spatiale optimale des variables prédictives à laquelle les modèles d'habitats basés sur des données d'études aériennes non corrigées pour erreur de localisation peuvent prédire avec exactitude un habitat d'éléphants et (2) si les modèles d'habitats basés sur ces ensembles de données peuvent prédire avec précision la présence d'éléphants dans des habitats forestiers fermés. Nous avons appliqué le modèle de maximum d'entropie Maxent à ces ensembles de données et utilisé l'indice de végétation par différence normalisée (IVDN) ainsi que la distance par rapport aux points d'eau comme prédicteurs d'habitat pour répondre à ces questions. Nos résultats montrent que les données d'études aériennes sont plus à même de prédire la présence d'éléphants à la plus faible résolution de 1000 m pour les deux variables prédictives. Les modèles d'habitats dérivés de données d'études aériennes sous-estimaient la présence d'éléphants dans des habitats forestiers plus fermés par rapport à ceux dérivés des données des colliers GPS. Ces résultats impliquent que des éléphants situés sous une dense canopée d'arbres sont susceptibles d'être manqués lors d'une étude aérienne. Notre étude est une des premières à tester empiriquement et à rapporter des résultats sur la mauvaise performance des données d'études aériennes dans la modélisation d'habitats, spécialement dans des forêts denses.
Introduction
Understanding the spatial distribution of wildlife species in a landscape is critical for their management and biodiversity conservation. In recent years, the possibility of determining the spatial distribution of wildlife species has been enhanced by advances in remote sensing technology as well as the introduction of novel species distribution modelling techniques that use satellite data (Elith et al., 2006; Nagendra et al., 2013; Ross & Howell, 2013). Accurate prediction of habitat for target species is important as it helps strengthen efforts to prevent further habitat loss (Bean et al., 2014). This is particularly important for African elephants (Loxodonta africana) because they are known to transform habitats (Van Langevelde et al., 2003; Lagendijk et al., 2011; Valeix et al., 2011). Failure to accurately predict elephant driven habitat changes in a timely manner may also threaten the existence of other wildlife species that use the affected habitats (Young, Palmer & Gadd, 2005; Head et al., 2012). This is mainly because elephants are keystone species, and protection of their habitat is beneficial to other species in the ecosystem (Laws, 1970). Thus, sustainable management of wildlife areas benefits directly from accurate prediction of wildlife habitats especially elephant habitat.
However, the ability of habitat models to accurately predict the presence of wildlife species is influenced by the spatial characteristics of the response and predictor variables, especially spatial resolution and locational error. In landscapes where ground-based surveys are time-consuming and costly, aerial survey data have extensively been used in modelling habitats for wildlife species (Scheidat, Verdaat & Aarts, 2012; Kiffner, Stoner & Caro, 2013; Pittiglio et al., 2013). However, the utility of aerial survey data uncorrected for locational error in wildlife habitat modelling work remains largely untested. Given the extensive spatial coverage of aerial surveys, one would expect these data to produce better habitat models as a wide variety of habitats are sampled. Ideally, the presence data used in modelling should represent the full range of values of the predictor variable in the study area so as to ensure good modelling results (Vaughan & Ormerod, 2003). Location data that are collected from aerial surveys and have not been corrected for locational error generally lack spatial accuracy as depicted in Fig. 1 (Murwira & Skidmore, 2005).
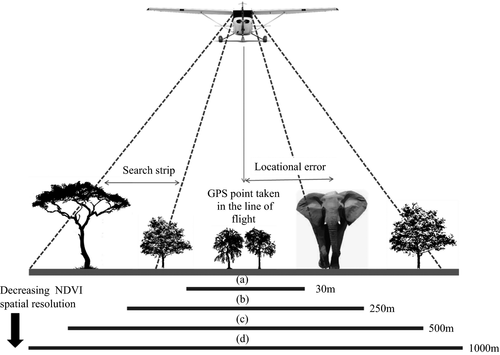
Locational error is often unavoidable in aerial surveys (Fig. 1) except where distance sampling methods are used to get more accurate measurements of location (Witting & Pike, 2009). When aerial surveys are conducted, the area below the aircraft is usually not visible to observers except in a few specialized surveys where a double window aircraft offering a full view underneath the aircraft is used (Whitt, Dudzinski & Laliberté, 2013). From Fig. 1, we can also deduce that if the predictor variable used in elephant habitat modelling is available at a spatial resolution smaller than the locational error inherent in aerial survey data, poor model performance is likely to occur, but this needs to be subjected to a rigorous empirical test before any conclusions can be drawn.
In this study, we claim that the performance of aerial survey data uncorrected for locational error in species habitat models may be established by comparing candidate models to those derived from superior data sets such as GPS collar data. The use of GPS collar data has shown that higher accuracy can be achieved in species distribution modelling (Loe et al., 2012; Wells et al., 2014). Previous studies consistently established that GPS collars exhibit locational error that does not exceed 100 m (Stache, Löttker & Heurich, 2012; Adams et al., 2013), which is considerably smaller than the locational error of up to 500 m reported for aerial survey data (Murwira & Skidmore, 2005). In essence, the locational error of aerial survey data is a function of the strip width used in the survey and could also vary between surveys. Although under ideal circumstances many animals covering a large area would be collared, it is frequently the case that limited resources permit collaring of only a small number of animals covering a much smaller spatial extent. In effect, aerial surveys could offer a limited representation of habitat assuming for example a single flight and a fairly sparse population, where one would get a snapshot of a subset of individuals in just one of the habitats they likely use. Overall, testing how aerial survey data perform in species habitat modelling against GPS collar data may provide empirical evidence of the relative performance of these sampling methods.
In this study, we aimed to establish utility of aerial survey data that are not corrected for locational error in elephant habitat modelling. We specifically asked whether there is an optimal spatial resolution of the predictor variable at which aerial survey data produce more reliable elephant habitat models. We also asked whether habitat models based on aerial survey data are able to accurately predict occurrence of elephants in closed woodland habitats. To answer these questions, we applied Maxent to aerial survey and GPS collar data for elephants obtained from Gonarezhou National Park of Zimbabwe. For each data set, we used NDVI and distance from the nearest water point available at different spatial resolutions as the habitat predictors.
Materials and methods
Study site
This study was conducted in northern Gonarezhou national park (GNP) located in south-eastern Zimbabwe (Fig. 2). The site is ideal for testing our hypotheses because (i) data on elephant presence from aerial surveys and GPS collars were collected during the same month of September 2009, thus making the data sets comparable, and (ii) GNP has an estimated elephant population of 10,000 (Dunham et al., 2013) which is amongst the largest in the country. This makes the study site important for elephant conservation in the country.
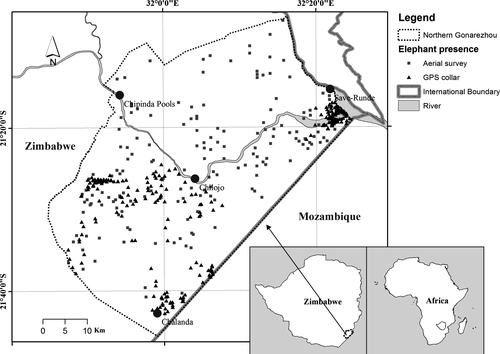
Elephant presence data were collected in an area approximately 2733 km2 in size, between latitudes 21.10° and 21.76° South and longitudes 31.75° and 32.41° East. Altitude ranges from 155 m to 567 m above sea level. The vegetation is dry savannah woodland dominated by Colophospermum mopane and is described in detail by Whitlow (1987). Tree density in the mopane woodlands ranges from 98 to 543 trees per ha (Gandiwa & Kativu, 2009a). Mean annual rainfall is 466 mm per annum and is received from December to March (Gandiwa & Kativu, 2009a).
Elephant presence data
Data on elephant presence were collected from a sample aerial survey and satellite-linked GPS collars fitted on eight elephants (five cows and three bulls). The aerial survey was conducted over the period from 4 to 9 September 2009 and the sampling effort ranged from 12.2% to 21.1% in the different survey strata (Dunham et al., 2010). Elephants were sighted by two observers scanning both sides of systematic line transects spaced by 2.5 km and covered from the air by a Cessna 185 fixed wing aircraft. The line transects were selected based on stratified random sampling where the starting point was randomly selected and subsequent ones had an equal separation distance to enhance representativeness. The average ground speed of the aircraft was 160 km h−1 whilst the flying height was about 300 ft above the ground measured using a radar altimeter. The ground speed of the aircraft was slightly higher than the speed of between 130 and 150 km h−1 recommended by Norton-Griffiths (1978). Each time an elephant was sighted, the GPS location of the aircraft at the time of sighting the animals was recorded. Detailed description of methods used in that survey is available in Norton-Griffiths (1978) and Dunham (2012). We used a total of 222 elephant locations from the aerial survey in our analyses. Data from GPS collars were collected from 1 to 24 September 2009. These dates coincided with the period when aerial survey data were collected, that is from 4 to 9 September 2009. Lack of perfect overlap in the data collection dates for the two data set possibly had minimum effect on model performance as we expected nonsignificant change in vegetation biomass (estimated by NDVI) over the entire data collection period. GPS collar data used in our analyses (collected in September 2009) had a fix success rate of 100%. These data were collected from eight satellite collars supplied by Africa Wildlife Tracking (South Africa), fitted on eight elephants and programed to take three fixes per day (two during the day and one during the night). The elephants fitted with the collars were selected during random flights in the national park and considerable separation distance between individual animals was maintained to ensure more complete coverage of representative habitats. Only the GPS collar fixes taken during the day were used in our analyses to ensure comparability with aerial survey data which were also collected during the day. We based our analyses on location fixes inside the study site and left out those outside. To ensure equal sample size to the aerial survey data set, we used 222 points randomly selected from a total of 284 elephant locations obtained from the GPS collars in our analyses. We used the random point selection tool implemented in a GIS to select the 222 points from GPS collar data.
NDVI data
We used NDVI as one of the habitat predictors because it correlates positively with vegetation biomass (Tucker, 1979). In addition, vegetation has been shown to be a key predictor of elephant habitat (Murwira & Skidmore, 2005). NDVI was calculated from cloud-free Landsat TM and Moderate Resolution Imaging Spectroradiometer (MODIS) (USGS, Sioux Falls, SD, USA) images acquired in September 2009 to coincide with elephant presence data. Landsat and MODIS data were downloaded from www.usgs.gov. Landsat bands used to compute NDVI (red and near-infra red bands) had a spatial resolution of 30 m whilst MODIS bands were available at 250 m, 500 m and 1000 m spatial resolutions. Landsat data were acquired on 16 September 2009 whilst MODIS data at 250 m spatial resolution were acquired on 6 September 2009 and the data at 500 m and 1000 m were both acquired on 17 September 2009. Prior to computing NDVI, Landsat data were converted from digital numbers (DN values) to top of the atmosphere reflectance (TOA) following the method described by Chander, Markham & Helder (2009). Landsat data were geometrically corrected to less than a 30 m by 30 m pixel (root mean square error (RMSE) of 0.87) based on twenty ground control points (GCPs) collected in the field using a GPS at a positional error of ±5 m. Twenty GCPs are generally considered adequate for the 2nd-order (twelve terms) polynomial transformation used in this study (Toutin, 2004). MODIS data were re-projected from the geographic coordinate system to Universal Transverse Mercator (UTM) Zone 36 South in ENVI 5.1 (Exelis Visual Information Solutions, Boulder, Colorado) to be compatible with elephant presence data.
Distance from water points
We also used distance from the nearest water point as a predictor variable in the model. The location of water points at the time of sampling was established using the Modified Normalised Difference Water Index (MNDWI) described in detail by Han-Qiu (2005). The index was calculated using Landsat data described in detail in the previous section. All pixels with MNDWI values greater than zero were classified as water points as suggested by Han-Qiu (2005). Later, the Euclidian distance calculation algorithm was used to compute the distance of individual pixels from the nearest water points. To get data at the spatial resolutions of 250 m, 500 m and 1000 m, the distance from water data computed at the 30 m Landsat resolution was later resampled to the desired resolutions.
Elephant distribution modelling
In this study, Maxent was used to predict distribution of elephants in northern Gonarezhou. Maxent was selected based on its ability to reliably predict species distribution from presence only data. The algorithm is described in greater detail in Phillips & Dudík (2008). To generate elephant habitat models, elephant presence data from the aerial survey and GPS collars were used as the response variable separately whilst NDVI and distance from water points data calculated at four spatial resolutions of 30 m, 250 m, 500 m and 1000 m were the predictor variables. We used 70% of the elephant locations to calibrate the model whilst 30% of the data were set aside to validate the predictions as recommended in the literature (Araujo & Guisan, 2006). In total, eight habitat models were built (i.e. four from each elephant presence data set), at the NDVI and distance from water point spatial resolutions described earlier.
Model evaluation
For each elephant distribution model, the area under curve (AUC) of the receiver operating characteristic (ROC) curve was generated to assess the model's ability to predict elephant presence based on 30% of the data set set aside for model validation. The sensitivity and specificity of the model predictions were assessed using increasing probability of presence (logistic output) thresholds. ROC curves were generated using the method described in Sing et al. (2005). Elephant absence locations used in the computation of the ROC curves were obtained from the background pixels randomly created in Maxent. The AUCs were based on 500 bootstraps thus allowing calculation of confidence intervals. Differences in the AUCs of the habitat models based on aerial survey and GPS collar data at each spatial resolution of NDVI and distance from water points were inferred when their confidence intervals did not overlap. Confidence intervals were computed at the 95% confidence level. Spatial similarity between the predicted elephant habitats from both data sets was tested using the Jaccard Similarity Index. The index tests for similarity between two sample sets and is the ratio of the size of intersection to the size of union of the same set. More detail on the index is described in Magurran (2004). In this study, bigger values of the index represented similarity in the predicted elephant habitats whereas lower values represented dissimilarity.
Results
Predictive ability of habitat models derived from aerial survey data
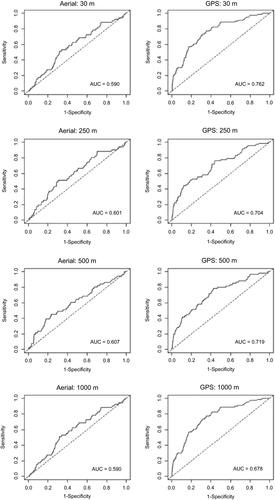
The AUCs for the models relating elephant presence data from aerial surveys to both predictors at spatial resolutions of 30 m, 250 m, 500 m and 1000 m were significantly lower than those predicted based on GPS collar data (Figs 3 and 4). In particular, the AUCs for the models relating aerial survey and GPS collar data to NDVI and distance from water points at the 30 m spatial resolution were 0.592 (95% CI [0.511, 0.669]) and 0.767 (95% CI [0.713, 0.820]), respectively. At the NDVI and distance from water point spatial resolution of 250 m, the model based on aerial survey data had an AUC of 0. 603 (95% CI [0.526, 0.684]) whilst that for GPS collar data was 0.708 (95% CI [0.641, 0.773]). Similarly, the AUCs for models based on aerial survey and GPS collar data were 0.607 (95% CI [0.526, 0.692]) and 0.719 (95% CI [0.650, 0.789]), respectively, at the NDVI and distance from water points spatial resolution of 500 m. Finally, at the spatial resolution of 1000 m of both predictors, the AUC for models based on aerial survey and GPS collar data were 0.590 (95% CI [0.516, 0.663]) and 0.678 (95% CI [0.589, 0.764]), respectively.

Performance of aerial survey data in relation to vegetation density
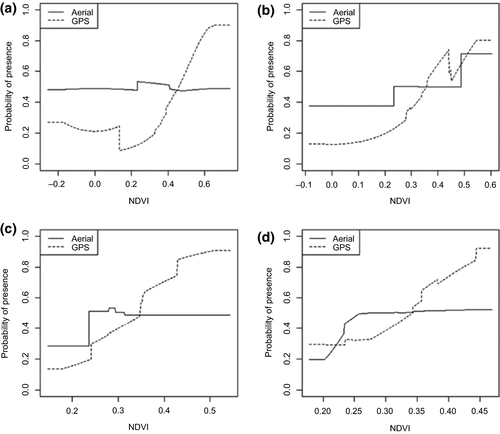
Figure 5 illustrates the performance of elephant models built using aerial survey data and GPS collar data at different values of the predictor (NDVI). We observe that elephant distribution models built using aerial survey data achieved higher probabilities of elephant presence (logistic output) at lower NDVI values compared to those based on GPS collar data. In contrast, at higher NDVI values, habitat models based on aerial survey data showed lower probabilities of elephant presence when compared to those based on GPS collar data.
Spatial similarity between the predicted elephant habitats
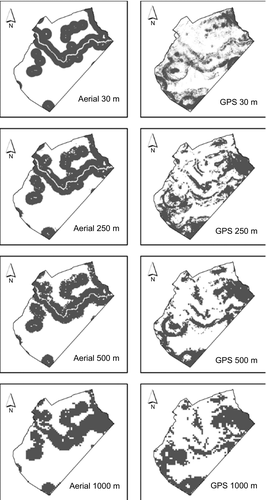
The spatial resolution of the predictor variable had a significant effect on the similarity and dissimilarity of habitat predicted using aerial survey and GPS collar data. We observed low similarity (J = 0.197) between elephant habitats predicted using aerial survey and GPS collar data when both predictors had a fine spatial resolution (30 m). Likewise, low similarity was detected when comparing habitats predicted using the two data sets at the 250 m and 500 m spatial resolutions (J = 0.245 and 0.178, respectively). The highest similarity was observed at the 1000 m spatial resolution (J = 0.265). Figure 6 shows the maps of the predicted elephant habitats that were used in the calculation of the Jaccard's coefficient of similarity.
Discussion
We found that high spatial similarity between elephant habitats predicted using aerial survey and GPS collar data sets exists largely at the 1000 m spatial resolution of the predictor variables and not at finer spatial resolutions. This key result indicates the poor performance of aerial survey data in elephant distribution modelling at finer scales of the predictor variables. Scale dependence in the performance of aerial survey data was previously suggested in the literature but until now empirical evidence confirming its effect had not been provided in a spatial modelling framework. In a previous study, locational error of up to 500 m associated with aerial survey data was reported in north-western Zimbabwe (Murwira & Skidmore, 2005). Unlike, aerial survey data, the locational error inherent in GPS collar data rarely exceeds 100 m (Rempel, Rodgers & Abraham, 1995; Moen et al., 1996). From this result, we deduce that at most aerial survey data uncorrected for this locational error can be used to provide reliable estimates of elephant distribution at a coarse spatial resolution of 1000 m.
Another important aspect of the results of this study is the lower probability of elephant presence (logistic output) obtained from habitat models based on aerial survey data in high NDVI areas compared to those from GPS collar data. High NDVI values have been observed to be associated with high tree canopy area (Ndaimani, Murwira & Kativu, 2014). It however has to be emphasized that the logistic output of the Maxent model is not exactly the same as the probability of presence (Yackulic et al., 2013). This key result suggests that elephants under dense tree canopies are potentially missed during aerial surveys whilst those occurring in open areas with fewer trees have a better chance of being detected. The failure by aerial surveys to accurately detect animals under tree canopies has been documented (Pollock & Kendall, 1987; Jachmann, 2002) and this result simply confirms it. The finding that aerial surveys possibly miss elephants under dense tree canopies has far reaching implications on habitat models predicted using aerial survey data and raises the question: if an aerial survey fails to spot the largest land mammals on Earth in a savannah, then what hope do we have for spotting smaller mammals such as antelopes? On the other hand, the fact that habitat models based on GPS collar data succeeded in predicting higher probabilities of elephant presence in areas of high tree cover is also an important finding. The main reason for the superiority of GPS collar data is that whilst it is restricted in spatial extent as only a few individuals can be collared due to high costs, it has high locational accuracy. In addition, GPS data provide more accurate representation for all the habitats (including the closed habitats) than aerial survey data.
Overall, our study is amongst the first to test the advantage of using species presence data from aerial surveys in habitat modelling in an African savannah. Based on evidence gathered in this study, we recommend that species distribution models built from aerial survey data uncorrected for locational error should therefore be treated with caution. Although the results reported here are robust given that two different presence data sets were used, our modelling framework is not perfect. First, NDVI and distance from water were the only predictors used to predict elephant presence yet other variables such as human induced disturbance are known to play a major role in elephant distribution. This could have contributed to the poor performance of aerial survey data and hence the inclusion of other covariates warrants further investigation. Another potential limitation is that we used only one species distribution modelling technique (Maxent) but could have used other methods such as boosted regression trees (Elith et al., 2006). The choice of Maxent is justifiable as previous research has demonstrated its superiority over competing methods. In addition, our aim was not to build predictive models per se but to test the effect of locational error on the performance of aerial survey data.
Conclusion
We conclude that presence data from aerial surveys, which are not corrected for locational error, perform poorly in species habitat modelling and should be used with care. Overall, our study also demonstrated the superiority of GPS collar data at different spatial resolutions of the predictor variable but given the limited spatial extent of the data, better results are likely to be obtained when it is used to complement aerial survey data which tend to have a large spatial coverage but low locational accuracy. Future studies could test whether models that combine both data sets perform better as the combined data possibly sample a wider representation of habitats existing in the landscape. Further work could involve a comparison of models based on points collected in open and closed habitats to tease apart the effects of locational errors from those caused by changes in detectability.
Acknowledgement
We thank the Zimbabwe Parks and Wildlife Management Authority (ZPWMA) for granting us access to aerial survey data and permitting us to do this research in Gonarezhou National Park. We are also grateful to the Gonarezhou Conservation Trust for providing GPS collar data.


