Using microarray analysis to identify genes and pathways that regulate fetal hemoglobin levels
Abstract
Increased levels of fetal hemoglobin (HbF: α2γ2) can ameliorate the clinical severity of the β-hemoglobinopathies. Microarray analysis represents a powerful approach to identify novel genetic factors regulating the γ-globin gene. Gene expression profiling was previously performed on 14 individuals with high or normal HbF levels to identify the genetic factors that control γ-globin gene expression. To obtain more accurate and reliable results, our results were combined with public microarray dataset GSE22109 deposited in the Gene Expression Omnibus database. Annotation of case versus control samples was taken directly from the microarray documentation. The differentially expressed genes (DEGs) were obtained and were deeply analyzed by bioinformatics methods. Combined with our own chip expression data, potential genes HBE1, TFRC, and CSF2 were selected out for subsequent qRT-PCR validation. A total of 184 DEGs were identified from GSE22109 and the protein–protein interaction network was constructed. Gene set enrichment analysis showed that the hematopoietic cell lineage pathway overlaps in the two datasets. HBE1, CSF2, and TFRC were confirmed by qRT-PCR. Our results suggest novel candidate genes and pathways associated with the γ-globin gene expression.
1 INTRODUCTION
Fetal hemoglobin (HbF), composed of two α chains and two γ chains, usually accounts for less than 1% of total hemoglobin in healthy adults (Danjou et al., 2015). In recent years, the genetic regulation of HbF levels has been of particular therapeutic interest, because high HbF levels can reduce the severity of the β-hemoglobinopathies such as β-thalassemia and sickle cell anemia (Noguchi, Rodgers, Serjeant, & Schechter, 1988; Traxler et al., 2016). Severe β-thalassemia probably accounts for more than 50,000 deaths per year of all deaths of children under the age of 5 years in low- or middle-income countries (Weatherall, Akinyanju, Fucharoen, Olivieri, & Musgrove, 2006). β-Hemoglobinopathies have been challenges of public health. Therefore, identification of the genetic factors regulating HbF levels might help reveal new targets for therapy.
High-throughput technology has been widely applied in molecular genetics and functional genomics to identify the molecular mechanism underlying complex diseases and quantitative traits (Majithia et al., 2014). Previous studies have identified some genes that control HbF levels. HBS1L-MYB, BCL11A, and KLF1 regulate γ-globin gene (HBG1/2) expression and influence HbF levels (Masuda et al., 2016; Sankaran, 2011; Xu et al., 2010). Although the importance of these genes in the pathogenesis of HbF has been supported by human genetic studies, many genes involved in HbF synthesis remain unidentified.
β-Thalassemia is prevalent in the countries located in the Mediterranean region of North Africa and Southeast Asia (Modell & Darlison, 2008). Guangxi, a province located in southern China, is bisected by the Tropic of Cancer and bordered by Vietnam in the southwest. The province, a multiethnic region including the largest Zhuang ethnic minority group in China, has a heavy β-thalassemia burden. Because of regional restrictions and intermarriage, the gene mutation frequency of β-thalassemia in this area is approximately 6.43% (Xiong et al., 2010). Combining the identification of differentially expressed (DE) genes in individuals with high HbF levels in areas such as Guangxi, where β-thalassemia is prevalent and associated with specific molecular pathology and racial/ethnic characteristics, with analysis of the genes that regulate HbF levels, may provide valuable insights into the mechanisms that control HBG1/2 gene expression.
In the current study, we utilized bioinformatics and experimental approaches including our own microarray profiling of gene expression as well as data from one public gene expression study to identify regulatory genes and biological pathways controlling HbF levels. Our results show that the hematopoietic cell lineage pathway and TFRC (located on this pathway) overlap in two datasets. TFRC was confirmed by qRT-PCR and positively relates to HbF levels. The potential genetic regulators of HbF levels were suggested.
2 MATERIALS AND METHODS
2.1 Study participants
The design of the present study was approved by the ethical committees of the First Affiliated Hospital of Guangxi Medical University, and informed consent was obtained from all participants. Inclusion criteria for cases were as follows: individuals with hereditary persistence of fetal hemoglobin (HPFH) or β-thalassemia minor with higher HbF (>2%) (Borg et al., 2010), and age- and gender-matched attendances with normal HbF. Identification of HPFH or β-thalassemia minor was performed by Hb electrophoresis, high-performance liquid chromatography, and gene analysis for thalassemia (Xiong et al., 2010).
2.2 Microarray analysis
The methods applied here were described in detail in our previous paper (Lai, Jia, Yu, Luo, & He, 2017).
2.3 Identification of eligible datasets in the Gene Expression Omnibus (GEO) database
To obtain more accurate and reliable findings, we combined our study with public datasets deposited in the Gene Expression Omnibus database to identify the DE genes. Microarray datasets that examined potentially DE genes in samples with high HbF levels, and that were publicly available by December 2016 were searched in public repositories: NCBI GEO (http://www.ncbi.nlm.nih.gov/geo). Searching was conducted with the terms (“fetal hemoglobin” and “homo sapiens”). The following data-selection criteria were included: (1) all datasets were genome-wide RNA expression; (2) the data must include individuals with high HbF levels of more than 2% of total hemoglobin and normal controls; (3) each dataset must contained at least three or more samples; (4) complete microarray raw or normalized data were available; and (5) individuals with younger than 5 years old and hemoglobin H disease were excluded. Only studies that offered sufficient data for analysis were included. GEO accession number, first author, platform used for gene expression analysis, number of samples, number of probes, and gene expression data were extracted (Table 1).
| GEO ID | First author | Size (1:2) | Source | Platform | Probes |
|---|---|---|---|---|---|
| GSE22109 | Philipsen S | 4:4 | Erythroid progenitors | Affymetrix Human Genome U133 Plus 2.0 | 54675 |
| GSE93971 | Ketong L | 7:7 | Reticulocytes | Agilent-079487 Arraystar Human LncRNA microarray V4 | 61046 |
| GSE93973 | Ketong L | 7:7 | Reticulocytes | Exiqon miRCURY LNA microRNA array, seventh generation | 3557 |
- Note. GEO, Gene Expression Omnibus, 1:2: cases:controls.
2.4 Screening for DEGs
The array dataset GSE22109 was downloaded (Borg et al., 2010), from which we obtained four high-HbF samples and four normal samples. Data pre-processing was performed by R (version 3.3.3). With the bioconductor (Gentleman et al., 2004) (Affymetrix), a raw CEL file was normalized and log2 probe-set intensities were calculated using the robust multichip average. To identify the DE genes from the normalized datasets, a t-test in limma (version 3.22.7; www.bioconductor.org/packages/3.0/bioc/html/limma.html) (Smyth, 2004) was performed to evaluate P value of each gene. The Benjamini–Hochberg method was used for adjustment. Significant genes were defined by a P value of <0.05, and fold change (FC) >2.
2.5 Bioinformatics analysis
The DEGs were subjected to GO and KEGG pathway analyses using the DAVID database (https://david.ncifcrf.gov). This tool enables comprehensive functional analysis of numerous interesting genes. Protein–protein interaction network analyses were subsequently performed. The DEGs were input to the STRING database (http://string-db.org) and GeneMANIA (http://genemania.org).
2.6 qRT-PCR
The isolated total RNA was reverse transcriptased to cDNA using SuperScript III Reverse Transcriptase according to the manufacturer's instructions (Invitrogen, Carlsbad, CA). Amplification reactions included 5 μl 2× Master Mix (Arraystar, Rockville, MD), 0.5 μl PCR forward primer, 0.5 μl PCR reverse primer, 2 μl template cDNA, and 2 μl double distilled water. The qRT-PCR was performed with a ViiA 7 real-time PCR system (Applied Biosystems, Foster City, CA) with the following conditions: 50°C for 2 min and 95°C for 10 min, followed by 40 cycles of 95°C for 10 s and 60°C for 60 s. All reactions were performed in triplicate. Relative quantification of target gene expression was performed using the 2−ΔΔCt method. Primers used are listed in Table 2.
| Gene | Primer pair | Product melt temperature (℃) | Product length (bp) |
|---|---|---|---|
| β-Actin (H) | Forward: 5′ GTGGCCGAGGACTTTGATTG 3′ | 60 | 73 |
| Reverse: 5′ CCTGTAACAACGCATCTCATATT 3′ | |||
| HBE1 | Forward: 5′ AACTTCAAGCTCCTGGGTAACG 3′ | 60 | 187 |
| Reverse: 5′ AGAAGGAGGGTGTCAGGGTCAC 3′ | |||
| CSF2 | Forward: 5′ CAGCCACTACAAGCAGCACT 3′ | 60 | 117 |
| Reverse: 5′ TCAAAGGGGATGACAAGCA 3′ | |||
| TFRC | Forward: 5′ TTATCTTTGCCAGTTGGAGTGC 3′ | 60 | 127 |
| Reverse: 5′ CCAAGAACCGCTTTATCCA 3′ |
3 RESULTS
3.1 Study participants
In total, seven cases and seven controls were enrolled in our study. In the group with high HbF levels, the HbF level data showed a normal distribution, and the median HbF level was 10.21% ± 1.83%. The characteristics of the subjects are presented in Table 3.
| Characteristics | Cases | Controls |
|---|---|---|
| Age (mean ± SD) (years old) | 29.3 ± 3.2 | 28.5 ± 2.6 |
| Age (range) (years old) | 26–36 | 26–35 |
| Males (n) | 2 | 2 |
| Females (n) | 11 | 11 |
| HbF (mean ± SD) (%) | 10.9 ± 4.3 | 0.6 ± 0.2 |
| HbF (range) (%) | 7.0–19.9 | 0.3–1.1 |
3.2 GEO dataset included in the analysis
The expression profile GSE22109 fulfilled the inclusion criteria, which contained eight samples, including four cases of high HbF and four normal samples. GSE22109 was downloaded for our analysis, along with our gene expression profiling data. The details of our own microarray data and GSE22109 with regard to sample type and microarray platform are provided in Table 4.
| Characteristics | Cases | Controls |
|---|---|---|
| Age (mean ± SD) (years old) | 33.6 ± 4.7 | 33.1 ± 4.3 |
| Age (range) (years old) | 27–41 | 29–40 |
| Males (n) | 2 | 2 |
| Females (n) | 5 | 5 |
| HbF (mean ± SD) (%) | 10.2 ± 1.8 | 0.4 ± 0.1 |
| HbF (range) (%) | 8.3–13.3 | 0.2–0.6 |
3.3 DEGs in individual dataset
In our previous study, we identified 568 messenger RNAs (mRNAs) in seven paired samples on the cutoff P value <0.05 and FC ≥2.0; of these, 324 mRNAs were up-regulated and 244 were down-regulated. In this study, a total of 184 significant DEGs were screened from GSE22109. These DEGs showed P value < 0.05 and FC ≥2.0, including 62 up-regulated and 122 down-regulated DEGs.
3.4 Protein–protein interaction network analysis
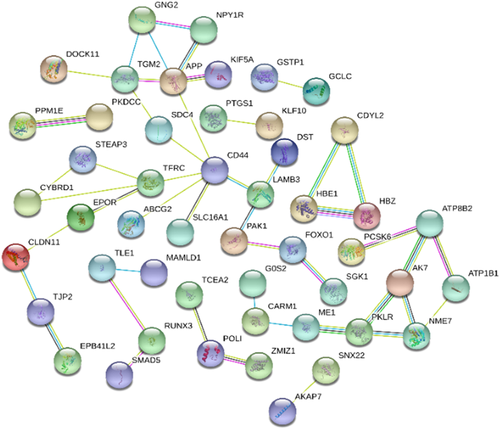
The DEGs from GSE22109 were constructing the PPI network using the STRING database (http://string-db.org), with a total of 184 DEGs, including 62 up-regulated genes and 122 down-regulated genes. The isolated and partially connected nodes were removed, then a complex network of DEGs was constructed; CD44, HBE1, TFRC, HBZ, and EPOR were the genes with significant interactions, as shown in Figure 1.

3.5 Pathway analysis and intersecting analysis
In this study, a hematopoietic cell lineage pathway was found overlapping in two datasets. TFRC, located on this pathway, was an overlapping gene that is up-regulated in individuals with high HbF levels compared to normal controls. Therefore, TFRC appeared to be an attractive and promising biomarker regulating the expression of γ-globin genes, which warrant further study.
3.6 Expression levels of candidate genes
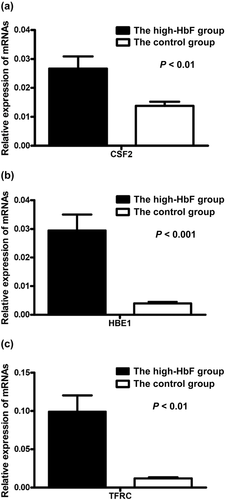
As shown in Figure 2, the expression levels of HBE1, TFRC, and CSF2 were all up-regulated in the high HbF group compared with the control group.

3.7 Prediction of gene function
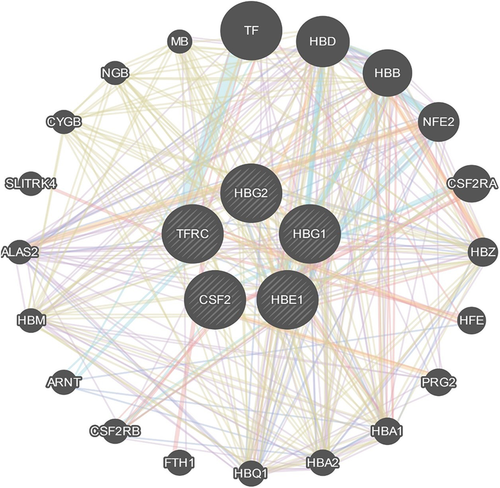
To predict the function of favorite genes and build a gene network, HBE1, TFRC, CSF2, and HBG1/2 were input as a query gene set for a GeneMANIA tool. With the automatically selected weighting method, all the selected genes tightly interact with each other (Figure 3). Different lines and colors denote the different types of interactions. We found CSF2RA (colony-stimulating factor 2 receptor α), CSF2RB (colony-stimulating factor 2 receptor β), TF (transferrin), FRH1 (ferritin heavy chain 1), together with many other genes presented in the network.

4 DISCUSSION
Recognizing the polygenic nature of HbF and its ability to alleviate the symptoms of β-hemoglobinopathies (Borg et al., 2010; Helsmoortel et al., 2016), we applied gene set enrichment analysis and integrated another transcriptome profile to identify related genes and specific pathways involved in HbF levels. The results offer new insights into the components that are needed to accurately control HBG1/2 expression. Despite the great promise of microarray technology for understanding β-hemoglobinopathies (Bianchi et al., 2015; Flanagan et al., 2009), individual studies have various limitations, including the production of results that are not reproducible or conflicting (Melboucy-Belkhir et al., 2014). These issues are likely a result of differences in experimental platforms, samples, standardization methods, and analytical methods, causing discrepancies in the microarray data obtained from different laboratories (Chow, Alias, & Jamal, 2017). Hence, much valuable information may be missed. In the present study, we analyzed multiple gene expression datasets to improve the sensitivity and accuracy of DEG identification.
We analyzed aberrantly expressed mRNAs from GSE22109 using the bioinformatics method. The hematopoietic cell lineage pathway was the significant pathway and TFRC, CD44, and EPOR were also found in this pathway. In our previous study, the hematopoietic cell lineage pathway has been significantly represented. Five up-regulated genes were involved in the pathway, including TFRC, CSF2, CSF3, HLA-DOA, and MS4A1 (Lai et al., 2017). Our qPT-PCR analysis and all results have demonstrated that these genetic modifiers of β-thalassemia may affect globin imbalance directly or indirectly.
HBE1, which is located in the β-globin gene cluster upstream of the locus control region and before HBG1/2, was identified to be DE in two datasets. Together, these genes form a large linkage disequilibrium block (Nuinoon et al., 2010). HBE1 is normally expressed in the embryonic yolk sac and is involved in the oxygen transporter activity, iron ion binding, protein binding, oxygen binding, heme binding, and hemoglobin α–binding pathways. Two ε-globins, together with two α-globins, form the embryonic Hb Gower 1 (Peschle et al., 1985). As primitive cells are normally supplanted in fetal development by definitive erythroid cells, embryonic Hb is progressively superseded by HbF (Kingsley et al., 2006; Sankaran, Xu, & Orkin, 2010). Polymorphisms of the HBE1 gene have a relatively strong association with HbF levels and β-thalassemia/HbE disease severity (Nuinoon et al., 2010). The mechanism of HBE1 influencing the levels of HbF need to be further studied.
TRFC, one iron-regulatory gene, encodes transferrin receptor CD71 and influences erythrocyte traits (Ganesh et al., 2009). This receptor is required for erythropoiesis. In states of anemia, TFRC can be up-regulated (Barisani, Parafioriti, Armiraglio, Meneveri, & Conte, 2001). When on iron overload, TFRC is down-regulated (Rouault & Klausner, 1997). The expression of TFRC depends on the dominance of anemia over iron overload. Reduced TRFC expression reverses anemia and hepcidin suppression in β-thalassemic mice, and ineffective erythropoiesis is decreased (Li et al., 2017). Weizer-Stern et al. (2006) also observed increased expression of TFRC in the β-thalassemia mouse models compared with the control mice. Patients with β-thalassemia have ineffective erythropoiesis of different levels, and iron overload differs in severity (Traxler et al., 2016). Iron overload is a major concern in patients with thalassemia who receive multiple blood transfusions. The literature indicates that miR-210 can increase γ-globin expression by interacting with TFRC (Bianchi, Zuccato, Lampronti, Borgatti, & Gambari, 2009; Sarakul et al., 2013; Siwaponanan et al., 2016). However, limited studies have clarified the regulatory role of TFRC in β-thalassemia. In this study, we applied different online platforms to predict the target miRNAs of TRFC. The hsa-miR-17-3p was detected in three miRNA target-prediction databases (Targetscan 7.1, miRcode, and miRTarBase). Interestingly, our previous miRNA microarray results showed that hsa-miR-17-3p was DE in the high HbF group compared with the control group. The cutoff value was set to an FC ≥1.5 and P < 0.05. The microarray expression profile GSE93973 is available from the GEO database (Lai et al., 2017). Moreover, has-miR-17 can promote hematopoietic cell expansion via HIF-1α (Yang et al., 2013). Thus, we speculate that miR-17-3p cooperates with the TFRC gene in the hematopoietic cell lineage pathway, thereby affecting HBG1/2 expression. TFRC appears to be an attractive and promising biomarker for iron overload in thalassemia patients.
CSF2 (colony stimulating factor 2) is a protein-coding gene. This gene is an important hematopoietic growth factor involved in hematopoietic cell lineage pathways (Ge et al., 2008). CSF2 associates with hemolytic anemia and sickle cell disease (Theurl et al., 2016). The up-regulation of CSF2 also affects HbF expression. In the chip expression profiling study, the expression level of CSF2 in the HbF group was significantly higher than in the control group. The results were verified by qRT-PCR. During the maturation of adult erythroid precursor cells, the presence and increased activity of cytokines such as CSF2 can affect the kinetics of erythropoiesis and differentiation, change the proportion of F cells, and increase the expression of HbF (Lee et al., 1985). Further explorations to elucidate the mechanism can be performed.
Our study identified genes TFRC, CSF2, HBE1, and the hematopoietic cell lineage pathway as the promising therapeutic candidates for HbF. We theorized that when HBE1 was expressed, embryonic Hb will predominantly present in the blood, and a multitude of other HBE1 downstream genes are also being activated to support this Hb production. In time, HBE1 expression will be superseded by HBG1/2 where HbF needs to take over the body. TRFC might have been up-regulated the whole time supporting erythropoiesis, where matured red blood cells are now being formed to carry HbF instead of embryonic Hb and CSF2 supporting transformation of the different blood cell lineages. How the genes and pathways identified in this study potentially silence γ-globin transcription is still not clear, and further functional studies are needed to verify the efficacy of targeting these genes and pathways to help ameliorate the symptoms of the β-hemoglobinopathies.
ACKNOWLEDGMENTS
This study was supported by grants from the National Natural Science Foundation of China (No.81360093) and Guangxi Key Laboratory of Thalassemia Research (16-380-34).
AUTHORS CONTRIBUTIONS
S.J. and Y.H. conceptualized and designed the study, drafted the initial manuscript, and reviewed and revised the manuscript. S.J., S.Y., W.J., and Y.H. coordinated and supervised data collection and critically reviewed the manuscript for important intellectual content. All authors approved the final manuscript as submitted and agree to be accountable for all aspects of the work.
CONFLICTS OF INTEREST
The authors declare no financial or other conflict of interests.


