Radiographic anatomy of the heart of fruit bats
Abstract
As the only mammal that can fly, bats have organ systems with a unique morphophysiology. One of the highlights is the heart and blood circulation system, which must be able to meet the needs of blood and oxygen supply when flying. This study examined the radiography of the normal condition of the heart organ in 3 species of fruit bats, namely Cynopterus titthaecheilus, Cynopterus brachyotis and Rousettus leschenaultii using radiological silhouette analysis and clock analogy. The results showed that the heart positions of the three bat species tend to be tilted to the left with the apex moving away from the midsagittal plane. Analysis of intercostal space (ICS) value and vertebral heart score (VHS), and evaluation of radiographic features showed R. leschenaultii has a relatively larger heart size than the other two species. All three bat species have a higher VHS than mammals in general. Radiographic images obtained, and interpretation results show the position, size and normal heart parts of the three bat species. They will be useful in diagnostic efforts related to heart problems in these three species.
1 INTRODUCTION
The use of radiography is vital to study the size, position, and work of the heart and to diagnose heart health. The use of radiography has previously been widely used in health examinations of pets such as dogs and cats (Buchanan 2000; Ghadiri et al., 2008). Normal radiographs between species will vary, so knowledge of normal radiographic values is needed to analyse the occurrence of abnormalities (Boutis et al., 2016). Cases of cardiomyopathy in wild animals can rarely be detected quickly. This phenomenon is because a lack of data sources on the normal condition of the heart. Radiography is a supporting examination that can be used in checking the health status of the heart. Some knowledge that can be obtained by X-ray is the location and orientation of the heart in the body to other organs, heart size and opacity (Auch-Schwelk et al., 1988; Battler et al., 1980; Buchanan 2000).
Several normal radiographic studies of wildlife have been reported in endemic Capuchin monkeys in Brazil (Alves et al., 2012), mini African hedgehogs (Black et al., 2011), black-rumped Agoutis (de Moura et al., 2015) and bats (Dickson et al., 2016; Gardner et al., 2007; Killick et al., 2017). Normal cardiographic data could be used to explain cardiomyopathy in bats (Dickson et al., 2016). However, radiographic data on bat heart are still minimal and were only found in large fruit bats of the genus Pteropus (Dickson et al., 2016; Gardner et al., 2007; Killick et al., 2017). Similar studies on Small fruit bats, especially the Indonesian short-nosed fruit bat (Cynopterus titthaecheilus), the lesser short-nosed fruit bat (Cynopterus brachyotis), and the Leschnenault's rousette (Rousettus leschenaultii), have not been reported. Studies of these three genera of Indonesian fruit bats are limited (Suyanto 2001). This study aims to present cardiac radiographic data of C. titthaecheilus, C. brachyotis and R. leschenaultii, which include the position, orientation, and size of the heart and its components. Heart position and orientation and its components are analysed based on radiographic silhouettes and clock analogy. Heart size was analysed based on the value of intercostal space (ICS), vertebral heart scale (VHS), and evaluation of radiographic features of bat heart by Gardner et al. (2007). ICS is measurement from heart size by the distance between two rib bones (two ossa costales), and VHS is heart size based on heart height and width to body size number by vertebrae as units of measure. The data obtained will be useful for understanding flying bats' physiology and ability and managing bat health needed in conservation activities (Hall et al., 2014).
2 MATERIALS AND METHODS
2.1 Research subject
Bats used were 14 C. titthaecheilus, 13 C. brachyotis and 3 R. leschenaultii. The bats arrest is in accordance with the recommendations based on the number of species permitted by the Indonesian Institute of Science (Letter Number 229/IPH:/KS.02.04/I/2017) to use experimental animals. The Ministry of Environment and Forestry permitted to use animals by following the Decree of the Director-General of Conservation Natural Resources and ecosystems (Letter Number 197/KSDAE/SET/KSA.2/5/2017).
Bats were anaesthetized using ketamine HCl at a dose of 10 mg/kg body weight and xylazine HCl at a dose of 2 mg/kg body weight (Sohayati et al., 2008). The procedure of this research was carried out based on the approval of the Animal Ethics Committee of the Research Institute and Community Service (LPPM) IPB University number 75-2017 IPB.
2.2 Observation of heart radiography
Observation of cardiac radiography was performed on anaesthetized bats. The bats were positioned lying down, the wings were extended laterally, and the legs were positioned caudally to obtain a ventrodorsal (VD) view, as in Figure 1. Laterolateral (LL) positions were obtained by extending the wings to the dorsal region, placing the lateral surface on the table in a symmetrical position, and the legs were extended towards the caudal as in Figure 2. The kilovoltage peak (kVp) and milliamperage second (mAs) settings were 44 kVp and 5 mAs.
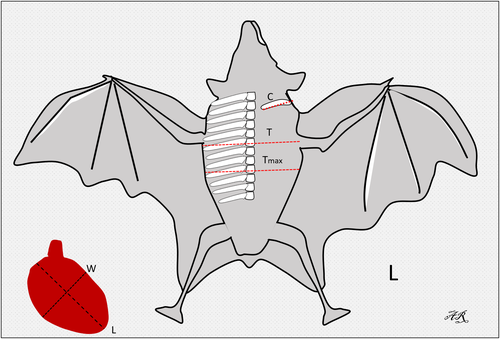
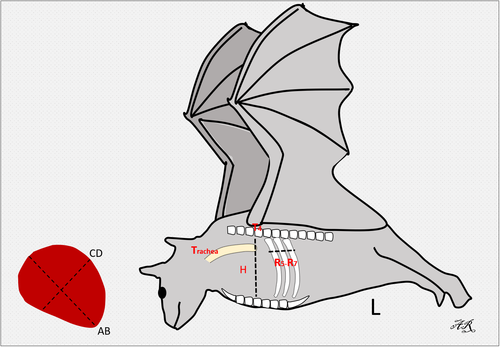
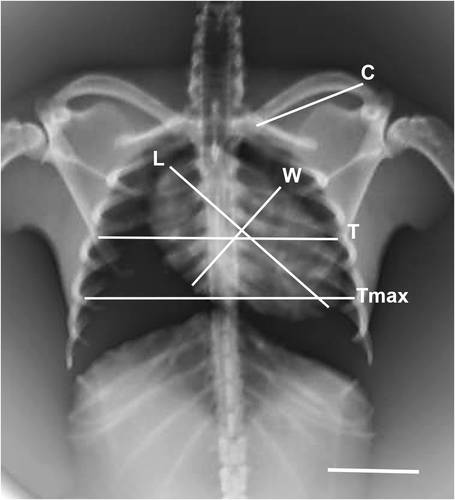
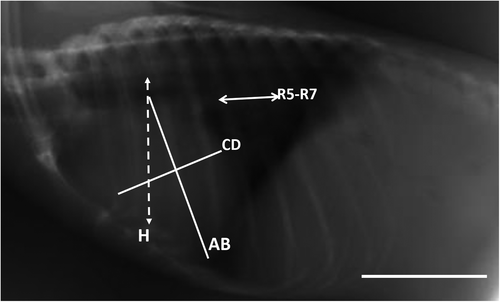
In this study, the interpretation of the location of the heart and blood vessels was performed using the clock analogy method (Andrei et al., 2017). The measurements were made on the LL radiographic results. The length of the heart was measured from the carina to the apex (AB). The heart width measured in the widest part of the heart (CD) was measured perpendicular to AB. The distance from the 5th rib's cranial portion to the 7th rib's caudal portion (R5-R7) was measured perpendicular to the spine at the heart base. The height of the thoracic cavity (H) was measured from the ventral portion of the spine to the dorsal sternum boundary which was measured precisely parallel to the tracheal bifurcation. Measurements made in the VD section are illustrated in Figure 1. The maximum heart length (base to apex) was noted as L. The maximum width of the heart perpendicular to L was recorded as W. The width of the thoracic cavity on the 6th rib was marked as T. The thorax width on the 9th rib was noted as Tmax. The length of clavicula was measured and noted as C (Dickson et al., 2016; Gardner et al., 2007).
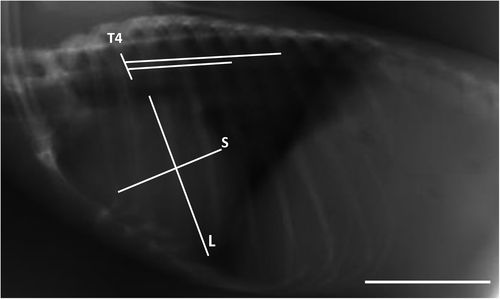
In the lateral radiographic projection, the value of the VHS and ICS was measured. ICS assessment is a measurement of the heart, based on the amount of distance between the 2 ribs. VHS assessment is the number of os vertebrae based on the sum of the long axis (L) and short axis (S). VHS is projected starting from the 4th thoracal os vertebrae (T4); (L), measured from the carina to the apex; short axis (S), measured in the widest part of the heart perpendicular to L (Dickson et al., 2016).
The radiological results from three species fruit bats obtained were then analysed using Kruskal–Wallis one-way analysis of variance (analysis non-parametric) at a 95% confidence interval using SPSS version 21 and MicroDicom software. Analysis non-parametric test was carried out because 4 variables depart from normal the normality check was carried out using Shapiro–Wilk. The ratio ranges of these three species are compared with values in large fruit bats (Pteropus sp.; Dickson et al., 2016; Gardner et al., 2007) are shown in Table 2. The data were described descriptively to compare the radiographic results of bats in this study with Pteropus that had been previous study by Gardner et al. (2007) and Dickson et al. (2016).
3 RESULT
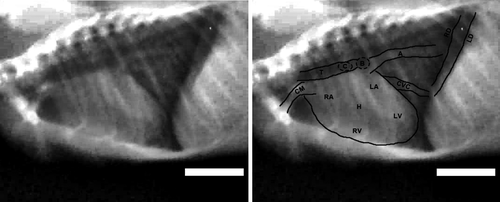
Radiographic results of the thoracic cavity of the three bat species showed 12 pairs of os costae, tracheal, lungs, main branches of the bronchus, heart, blood vessels and diaphragm (Figure 3). The heart of all three bat species has homogeneous opacity, is bean shaped and elongated. The heart is in the thoracic cavity with the condition seen tilted to the left. The slope of the heart R. leschenaulti is 30° from the midsagittal plane, while in C. titthaecheilus and C. Brachyotis the slope of the heart is 40°. The cardiac apex of R. leschenaultii appears to touch the diaphragm. In contrast, in C. titthaecheilus and C. brachyotis, the heart apex attaches to the wall of the left thoracic cavity around the 9th and 10th costae.
3.1 Interpretation of heart chambers and primary blood vessels
The clock-face analogy on VD projection of the heart radiographic interpretation of Cynopterus sp. is shown in Figure 4. The aorta is located between 11 o'clock and 1 o'clock position. The left atrium and the pulmonary artery can be found at the 12 to 1 o'clock position. The left ventricle appendage from the 1 to 4 o'clock position. The right ventricle is in the situation of 4 to 9 o'clock position, while the right atrium appendage from the 9 to 11 o'clock. The location of bat heart chambers and bat veins based on the clock analogy method on LL projections showed that the aorta is in the 10 to 11 o'clock position. The left atrium is in a place between 12 o'clock and 2 o'clock position. The left ventricle appendage from the 2 to 5 o'clock position. The right ventricle is located between 5 o'clock and 9 o'clock position. The right atrium and pulmonary artery can be found at 9 to 10 o'clock position.
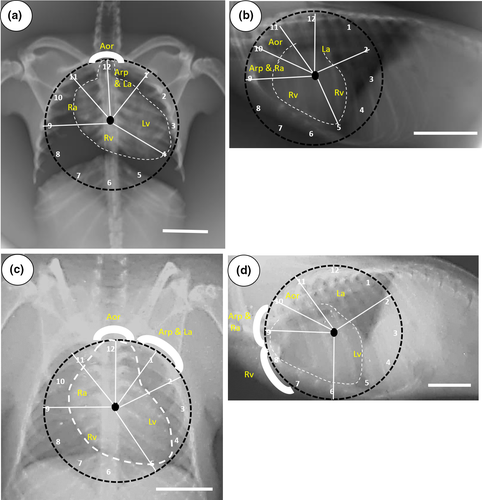
Radiographic interpretation of the heart of R. leschenaultii using the clock-face analogy method on the VD projection shows that the aorta is in a position between 11 o'clock and 1 o'clock position. The left atrium and pulmonary artery are situated between 12 o'clock and 2 o'clock position. The left ventricle appendage the 2 to 5 o'clock position. The right ventricle is located between 5 o'clock and 9 o'clock position. The right atrium is situated between 9 o'clock and 11 o'clock position. The area of the heart and blood vessels of R. leschenaultii in LL projections shows the aortic location between 10 o'clock and 11 o'clock. The left atrium is located between 11 o'clock and 2 o'clock position. The area of the left ventricle is between 2 o'clock and 6 o'clock position. The site of the right ventricle is between 6 o'clock and 9 o'clock position, while the location of the right atrium and pulmonary artery is between 9 o'clock and 10 o'clock position.
3.2 Interpretation of bat heart size
The radiographs of bat heart were normally distributed based on Shapiro–Wilk, with the following values L/W for C. brachyotis (p-value: .008), C. titthaecheilus (p-value: .929) and R. leschenaultia (p-value: .959); L/T for C. brachyotis (p-value: .463), C. titthaecheilus (p-value: .234) and R. leschenaultia (p-value: .637); W/T for C. brachyotis (p-value: .120), C. titthaecheilus (p-value: .221) and R. leschenaultia (p-value: .817); W/Tmax for C. brachyotis (p-value: .734), C. titthaecheilus (p-value: .198) and R. leschenaultia (p-value: .567); W/C for C. brachyotis (p-value: .765), C. titthaecheilus (p-value: .993) and R. leschenaultia (p-value: .878); L/C for C. brachyotis (p-value: .913), C. titthaecheilus (p-value: .936) and R. leschenaultia (p-value: .194); AB/CD for C. brachyotis (p-value: .316), C. titthaecheilus (p-value: .122) and R. leschenaultia (p-value: .915); AB/R57 for C. brachyotis (p-value: .314), C. titthaecheilus (p-value: .215) and R. leschenaultia (p-value: .081); AB/H for C. brachyotis (p-value: .575), C. titthaecheilus (p-value: .329) and R. leschenaultia (p-value: .780); CD/H for C. brachyotis (p-value: .571), C. titthaecheilus (p-value: .735) and R. leschenaultia (p-value: .00); VHS for C. brachyotis (p-value: .006), C. titthaecheilus (p-value: .177) and R. leschenaultia (p-value: .00); and ICS for C. brachyotis (p-value: .000).
Based on lateral radiographs, it can be analysed the heart size of the three bat species taking into account the VHS and ICS values. VHS values are the sum of the long axis (L) and short axis (S), which are projected on the 4th thoracic vertebrae (Azevedo et al., 2016), as shown in Figure 5. All three types of bats are known to have VHS and ICS values as contained in Table 1.
| Parameter | CB | CT | RL | (p <.05) | ||||||
|---|---|---|---|---|---|---|---|---|---|---|
| Range | Mean | Var. | Range | Mean | Var. | Range | Mean | Var. | ||
| AB:CD | 1.05–1.34 | 1.24a | 0.008 | 1.10–1.49 | 1.26a | 0.016 | 1.13–1.26 | 1.20a | 0.004 | 0.729 |
| AB:R5−7 | 2.06–2.70 | 2.35a | 0.059 | 1.96–2.66 | 2.21a | 0.050 | 2.21–2.42 | 2.28a | 0.014 | 0.314 |
| AB:H | 0.76–1.00 | 0.85a | 0.007 | 0.67–1.01 | 0.81a | 0.009 | 0.90–0.95 | 0.93a | 0.001 | 0.069 |
| CD:H | 0.58–0.76 | 0.69a | 0.003 | 0.52–0.84 | 0.65a | 0.008 | 0.74–0.79 | 0.77b | 0.001 | 0.044 |
| L:W | 1.50–2.11 | 1.67a | 0.025 | 1.53–1.95 | 1.71a | 0.012 | 1.46–1.71 | 1.58a | 0.016 | 0.195 |
| L:T | 0.67–0.89 | 0.80a | 0.005 | 0.67–0.97 | 0.79a | 0.009 | 0.71–0.89 | 0.81a | 0.008 | 0.784 |
| W:T | 0.40–0.54 | 0.48a | 0.002 | 0.39–0.59 | 0.46a | 0.003 | 0.45–0.57 | 0.513a | 0.004 | 0.223 |
| W:Tmax | 0.33–0.48 | 0.42a | 0.002 | 0.35–0.54 | 0.42a | 0.003 | 0.39–0.49 | 0.45a | 0.003 | 0.538 |
| W:C | 0.81–1.19 | 0.98a | 0.011 | 0.75–1.23 | 1.00a | 0.16 | 0.92–1.01 | 0.960a | 0.002 | 0.792 |
| L:C | 1.33–1.87 | 1.63a | 0.027 | 1.32–2.14 | 1.71a | 0.057 | 1.46–1.64 | 1.53a | 0.010 | 0.273 |
| VHS | 8.50–12.00 | 9.5a | 1.063 | 8.00–11.00 | 9.75a | 0.875 | 9.00–11.00 | 10.33a | 1.333 | 0.566 |
| ICS | 3.50 = 4.00 | 3.56a | 0.028 | 3.50 | 3.50a | — | 4.00 | 4.00b | — | 0.000 |
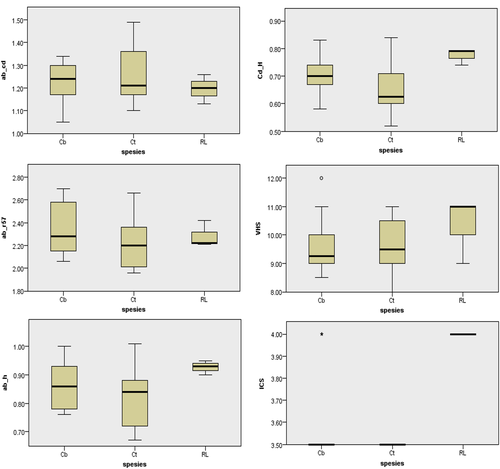
The results showed that R. leschenaultii had an ICS value higher than the two other bat species. The distribution of ICS values for the three species, as shown in Figure 6, namely C. titthaeceilus has an ICS value of 3.5, C. brachyotis with 3.5–4.0 ICS value and R. leschenaultii with 4.0 ICS value. Evaluation of heart size from the VHS value showed that R. leschenaultii has a higher VHS value than the other two species. The range of VHS values of each species is 8.50–12.00 v for C. brachyotis, 8.00–11.00 v for C. titthaeceilus and 9.00–11.00 v for R. leschenaultii (Table 1).
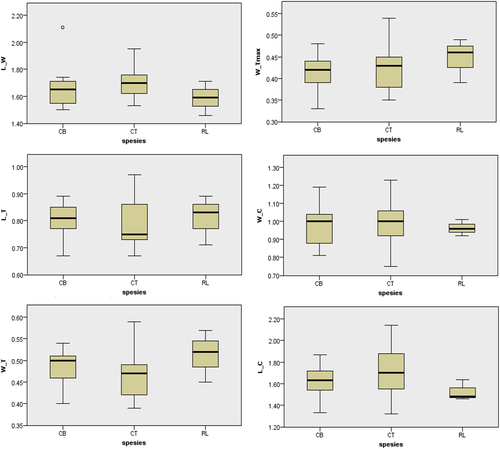
Radiographic evaluation of normal bat heart in Figures 6 and 7 is based on the radiographic evaluation method of bat heart by Gardner et al. (2007). The results of the heart radiographic evaluation of 3 bat species can be observed in Table 1. Based on the Kruskal–Wallis one-way analysis at a 95% confidence interval (Figures 8 and 9), it was found that there were no significant differences in the interpretation of the heart radiographs of the three bat species in the ventrodorsal position. In the lateral view, two measurements have a considerable difference in the 95% confidence interval, namely the ICS value, heart width (CD), to the height of the thoracic cavity (H). The ICS value of R. lescenaultii is 4.0, while C. titthaecheilus has an ICS value of 3.5, and C. brachyotis has an ICS value of 3.56. The ratio of heart width to the height of the thoracic cavity (CD/H) of R. lescenaultii is 0.74–0.79, while the CD/H in C. titthaecheilus is 0.52–0.84 and the CD/H in C. brachyotis is 0.58–0.76 (Table 1).
4 DISCUSSION
Radiographic observations can occur because of the light reflection process. The amount of light reflected by an object will affect its radiographic opacity. Objects with high density will usually reflect more light so that the colour looks brighter (radiopaque), while objects with lower density absorb more light, so they are dark (radiolucent). The opacity of the observed organ itself can be seen to be homogeneous or inhomogeneous. In the heart that has a case of atherosclerosis will be seen changes in opacity (Tian et al., 2018).
The results of this study describe the location, position, orientation and size of the heart in the thoracic cavity for wild bats that appear physically fit. The heart's slope in the thorax is influenced by both body posture and thoracic cavity shape as well. Based on the clock analogy, objectively, the location of the heart chambers and blood vessels can be described. Analysis using this method must use two fields of view, namely lateral and dorsoventral because not all parts are visible if only seen in one perspective (Andrei et al., 2017). The heart of a bat tends to tilt to the left when compared to humans (Hill & Iaizzo, 2015). The location of the bats heart in the thorax cavity is also different, compared with four-legged terrestrial mammals. The heart apex in four-legged terrestrial mammals tend to lead to the ventral part, whereas in bats, that position tends situated in the middle of thorax cavity with anterio-posterior orientation (Rahma et al. 2020). This posture can be influenced by the habit of bats hanging upside down so that adaptation occurs to the pericardial attachment, especially the apex to the diaphragm. Heart orientation in the thoracic cavity can affect the electric field of the heart on the surface of the body (Arteeva et al., 2005; Sathananthan et al., 2015). Bats, as the only flying mammals, have a high metabolism to meet their energy needs (Hanadhita et al., 2019; O'Shea et al., 2014). To meet oxygen demand, bats have fast heart rates (Thomas & Suthers 1972). The speed of the heart rate is related to the delivery of electrical impulses in the heart. The heart of the bat has multiple trabeculae septomarginalis so that the heart rate is high according to the faster delivery of impulses (Rahma et al., 2020). Also, the description of the results of the clock analogy method can be used in analysing the incidence of enlargement in the cardiac chamber simply. The change in cardiac shape or cardiac deformities in animals, such as cardiomegaly and hypertrophy, can be seen as the changes in the position of the heart space. In the case of cardiac malformations, pneumonectomy may be needed to understand the situation change of the heart and blood vessels in the clock-face analogy (Smulders et al., 2007).
One other way that also plays a role in determining the location of the heart in the body cavity is to look at the location of the heart based on the rib (os costae). Intercostal space (ICS) is the distance between two rib bones (two ossa costales). In dogs, ICS values may differ between races depending on the anatomical structure of the thoracic cavity (O'Brien 2001). ICS value of the heart is calculated by looking at how long the area used by the heart is in the lateral recumbency position. The upper left border of the heart starts at the 1st ICS while the lower right border of the heart at the 4th ICS. The ICS number of bat heart is known to be 3.5 for C. titthaecheilus and 3.56 for C. brachyotis. The ICS of R. leschenaultii is 4, and this value is significantly different from the ICS value of the two other bat species at 95% confidence intervals (Table 1). Larger ICS values on Rousettus indicate that Rousettus has a larger heart than Cynopterus. Also, Rousettus has a longer chest cavity than Cynopterus.
In cases of heart disease experienced by dogs and cats, measurement of the VHS is regularly executed. VHS is the most accurate measurement to evaluate the presence or absence of enlargement in the heart compared to other radiological interpretations (Jepsen-Grant et al., 2013; Ulum & Noviana 2018). The measurement is based on heart height and width relative body length, according to the vertebrae. In animals with cardiomegaly, the size of the VHS will usually increase (Buchanan, 2000). The previous study predicted that dilated cardiomyopathy may be a main cause of death in Livingstone's fruit bats (Pteropus livingstonii) kept in captivity (Drane et al., 2018). VHS measurements of the three bat species in this study are from the lateral left. The right lateral is not evaluated and may give slightly different results. This phenomenon is because the point of view in taking pictures can affect the results of radiographic measurements (Holmes et al., 1985; Greco et al., 2008). The average VHS size of the three bat species in this study was 9.73 ± 0.98 (Table 1); this value was relatively higher compared to normal VHS of other mammals such as mice (Mus musculus) 9.4 ± 0.7 (Ulum & Noviana 2018), wild cats 7.3 ± 0.55 (Ghadiri et al., 2008) and dogs 9.5 ± 0.8 (Greco et al., 2008). Each animal has a different VHS value because the heart anatomy, body size and heart orientation in the body of each animal are different (Jepsen-Grant et al., 2013; Lelovas et al., 2014). VHS from bats is also higher compared to other animals because the ratio of heart and body size is higher, for example, in the species of Pteropus sp. 9.4 ± 0.7 (Gardner et al., 2007) and Pteropus livingstonii 8.71 ± 0.93 (Dickson et al., 2016; Table 2). It is believed to be linked to higher activities, including the need for more energy when flying (Bavegems et al. 2005; Canals et al., 2005). VHS differences due to the influence of body size occur because the size of a small animal's body will increase the ratio of the size of the heart to body length based on the vertebrae. An in-depth study of overall body length compared to body length based on the os vertebrae will be needed (Jepsen-Grant et al., 2013).
| Parameters | 3 Species of Bats (Ct, Cb, Rl) | 3 Species of Bats (Pr, Ph, Pv)* | Pteropus livingstonii ** | ||||||
|---|---|---|---|---|---|---|---|---|---|
| Range | Mean | Variance | Range | Mean | Variance | Range | Mean | Variance | |
| AB:CD | 1.05–1.49 | 1.24 | 0.012 | — | — | — | 1.33–2.03 | 1.6 | 0.018 |
| AB:R5−7 | 1.96–2.70 | 2.26 | 0.050 | 2.00–2.94 | 2.44 | 0.064 | 1.70–3.29 | 2.35 | 0.118 |
| AB:H | 0.67–1.01 | 0.84 | 0.008 | 0.87–1.28 | 1.10 | 0.013 | 0.77–1.23 | 1 | 0.010 |
| CD:H | 0.52–0.84 | 0.68 | 0.006 | 0.59–0.89 | 0.75 | 0.004 | 0.494–0.746 | 0.63 | 0.003 |
| L:W | 1.46–2.11 | 1.68 | 0.019 | — | — | — | 1.32–1.74 | 1.5 | 0.011 |
| L:T | 0.67–0.97 | 0.79 | 0.007 | — | — | — | 0.646–1.02 | 0.81 | 0.007 |
| W:T | 0.39–0.59 | 0.48 | 0.003 | 0.45–0.69 | 0.56 | 0.004 | 0.404–0.682 | 0.54 | 0.004 |
| W:C | 0.75–1.23 | 0.99 | 0.012 | 0.80–1.17 | 0.94 | 0.007 | 0.731–1.64 | 1.05 | 0.030 |
| L:C | 1.32–2.14 | 1.65 | 0.040 | 1.20–1.77 | 1.45 | 0.019 | 1.08–2.48 | 1.57 | 0.074 |
| VHS | 8.00–12.00 | 9.73 | 0.965 | 8.70–10.10 | 9.40 | — | 7.0–10.2 | 8.71 | 0.934 |
Based on the results of this study, it can be concluded that the three bat species (R. leschenaultia, C. titthaecheilus and C. brachyotis) studied did not have a significant radiographic evaluation of heart ratios at a 95% confidence interval for the VD field of view. The measurements involved the heart length (L), the heart width (W), the width of the thoracic cavity on the 6th rib (T), the width of the thoracic cavity on the 9th rib (Tmax) and the length of the clavicle (C) (Table 1). L/W values that are smaller can describe the incidence of hypertrophy, whereas more massive W/Ts describe cardiomegaly events (Dickson et al., 2016). The value of heart length versus heart width (L/W) and heart width compared to the thoracic cavity width (W/T) of the three bat species is higher than that of Pteropus sp (Table 2). This difference is believed to relate to body size.
The radiographic evaluation results of bat heart in the lateral field of view revealed that there were significantly different measurement ratios between the three species of bats (R. leschenaultia, C. titthaecheilus and C. brachyotis), namely ICS values and CD: H ratios (Table 1). These results indicate that the genus Rousettus has a larger heart size relative to the thoracic cavity than the genus Cynopterus. Differences can occur due to morphological variations of the thoracic cavity between genera. Also, differences in nutrition and activity can affect the size of the heart against the thoracic cavity of a group of species (Dickson et al., 2016). The data from 3 bat species obtained in this study were also compared with the results of previous studies conducted on Pteropus (Table 2). There are differences in several radiographic data of these three bat species compared with data on other bats that have existed before. Namely, the AB/CD value is smaller than P. livingstonii. AB/H is lower than P. livingstonii, Pteropus rodricensis, P. Hypomelanus and P. vampirus, as summarized in Table 2 (Gardner et al., 2007; Dickson et al., 2016; Table 2). The smaller AB/CD ratio illustrates that the heart in the genus Cynopterus and Rousettus has a more rounded shape than the heart of the bat of the genus Pteropus examined. AB/H ratio can also describe a different heart slope so that the ratio of the heart length to the depth of the thoracic cavity is smaller than the other genus.
5 CONCLUSION
The three fruit bats' heart positions tend to be tilted off to the left with the apex away from the midsagittal plane. Analysis of the ICS, VHS and radiographic evaluation showed that R. leschenaultii had a relatively slightly larger heart size than C. tittaecheilus and C. brachyotis. In general, fruit bats have a heart size relative to the thorax cavity that is larger than terrestrial mammals.
ACKNOWLEDGEMENTS
The authors would like to thank Directorate of Research and Community Services, Directorate General of Research and Development, Ministry of Research, Technology, and Higher Education, the Republic of Indonesia for financial support through Penelitian Pendidikan Magister Menuju Doktor untuk Sarjana Unggul (PMDSU) batch II grant No. 1485/IT3.11/PN/2018.
CONFLICT OF INTEREST
The authors declared no potential conflict of interest.
Open Research
DATA AVAILABILITY STATEMENT
The data that support in this study are available from the corresponding author upon request.


