Influences on koala habitat selection across four local government areas on the far north coast of NSW
Abstract
Conserving habitats crucial for threatened koala (Phascolarctos cinereus) populations requires rating habitat quality from a fine spatial scale to patches, landscapes and then regions. The koala has a specialized diet focused on the leaves of a suite of Eucalyptus species. We asked: what are the key regional influences on habitat selection by koalas in the far north coast of New South Wales? We addressed this question by investigating the multi-scale factors, and within-scale and cross-scale interactions, that influence koala habitat selection and distribution across four local government areas on the far north coast of New South Wales. We assembled and analysed a large data set of tree selection, identified by the presence of scats, in a wide range of randomly selected 5 × 5 km grids across the region. This resulted in more than 9000 trees surveyed for evidence of koala use from 302 field sites, together with associated biophysical site features. The dominant factor influencing habitat use and koala occurrence was the distribution of five Eucalyptus species. Koalas were more likely to use medium-sized trees of these species where they occurred on soils with high levels of Colwell phosphorous. We also identified new interactions among the distribution of preferred tree species and soil phosphorous, and their distribution with the amount of suitable habitat in the surrounding landscape. Our study confirmed that non-preferred species of eucalypts and non-eucalypts are extensively used by koalas and form important components of koala habitat. This finding lends support to restoring a mosaic of koala-preferred tree species and other species recognized for their value as shelter. Our study has provided the ecological foundation for developing a novel regional-scale approach to the conservation of koalas, with adaptability to other wildlife species.
INTRODUCTION
Conserving habitats crucial for threatened wildlife populations requires rating their quality from the fine spatial scale up to patches, whole landscapes and then regions (Franklin, 2010). To map and rank the distribution of critical areas, we need to understand how environmental heterogeneity affects habitat quality and species' occurrence at differing scales (Boyce et al., 2002; Fischer & Lindenmayer, 2006). This requires investigating the relative importance and cross-scale interactions of factors that influence how a species uses its habitat and selects habitat components, which in turn shape its regional distribution.
Characterizing habitat quality across a regional landscape is not straightforward because of the complex ways in which the environment interacts with habitat at different scales. Consequently, understanding these factors and identifying and protecting areas of high-quality habitat is needed to manage species of conservation concern. Folivorous, arboreal marsupials may seem to have abundant resources, especially in landscapes with a high proportion of forest cover. However, the quality of these resources varies spatially according to forest composition and structure and underlying environmental heterogeneity. Trees provide both food and shelter and are the primary resource for arboreal folivores (Braithwaite, 2004; Matthews et al., 2007). Their nutritional value, structure and spatial arrangement contribute to habitat quality and can be used to predict, then test, the species occurrence and occupancy levels within spatially heterogeneous landscapes (Au et al., 2019; Marsh et al., 2021; McAlpine et al., 2006; Moore et al., 2010).
The koala (Phascolarctos cinereus) is an endangered folivorous marsupial with a specialized diet comprising a suite of Eucalyptus species, although other eucalypts and non-eucalypt genera are also browsed (Melzer et al., 2014). It is broadly agreed that only a small group of eucalypt species provide the majority of browse for koalas at any one locality, with the specific composition of food resources varying regionally (Melzer et al., 2014; Moore et al., 2004; Moore & Foley, 2000; Phillips & Callaghan, 2000; Seabrook et al., 2014; Tyndale-Biscoe, 2005). However, koala habitat selection and species' persistence are scale-dependent processes, operating at the individual tree, site and landscape scales (Kavanagh et al., 2007; Lunney et al., 1998; Matthews et al., 2007; McAlpine et al., 2006; Rhodes et al., 2006; Smith, McAlpine, Rhodes, Seabrook, et al., 2013). Notwithstanding the extensive scope of koala ecological studies, the influence of combinations of the key independent variables on habitat selection and their interactions at scales ranging from the tree and site to whole regions has not been investigated.
Effective regional koala conservation should be informed by location-specific knowledge and research (Ashman & Watchorn, 2019). While local and site-specific studies are necessary to identify suitable koala habitat, comprehensive analyses of how the various habitat features interact to influence regional-scale koala distribution and habitat quality are needed for regional koala conservation planning. Several studies have recognized the importance of larger spatial scales for koala conservation. For example, the issue of scale for koala conservation has been recognized for north-west New South Wales (NSW) (Predavec et al., 2018). Regional-scale occupancy modelling (250 m spatial resolution) has been used to assess multi-scale environmental and disturbance covariates and interactions for koalas across north-east NSW (Law et al., 2017; Law, Kerr, et al., 2022). However, these models typically trade-off local detail, such as tree species use, to predict koala occurrence over large areas.
Working at the scale of several local government areas (LGAs) offers the potential to develop a collaborative regional approach to koala conservation. This could help to ensure that combined resources are directed to the highest priority habitat areas and management actions to sustain a regional koala population. Identifying crucial habitat values and priority areas for protection and restoration are vital to support regional koala populations. The NSW Koala Strategy targets habitat as its first pillar of conservation, and the word ‘habitat’ is a recurring theme in the strategy (NSW Government, 2022). The study we present here represents a way of delineating koala habitat at a scale needed for planning on a regional landscape extent hitherto not attempted. A regional approach captures the overall pattern of habitat values, including where the most important habitat occurs, what habitat elements are most critical, their linkages, and their importance to the local community.
In this study, we examined the multi-scale factors and interactions (both within and across scales) that influence habitat selection for koalas across four local government areas (total area 3663 km2) on the far north coast of NSW. The region has long been recognized as one of the most important for the conservation of koalas in NSW (Adams-Hosking et al., 2016; Lunney et al., 2009; Reed et al., 1990), but it is under increasing threat from loss of habitat and other threatening processes. By taking a landscape approach in the selection of patches and sites to survey, we assembled a large, region-wide data set of 9066 trees collected from 302 field sites, surveyed for evidence of koala use, together with biophysical site features. We employed habitat categorization and mixed-effect models to objectively assess koala habitat and identify critical habitat elements needed to support koala populations at a regional-landscape scale (10 000 s ha). The novelty of the regional approach is that it encompasses a large and diverse geographic area, from coastal plains to hinterland ranges, and thus greater complexity and variability than most local studies. This understanding is necessary for developing a regional approach to koala management and conservation, with the capacity to address residual gaps from existing local, regional and Commonwealth koala conservation programmes.
METHODS
Hypotheses
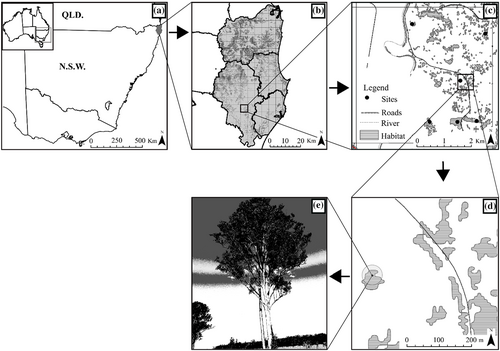
Our study design was guided by the intention to develop a regional approach to koala conservation. This required identifying the major factors influencing koala habitat utilization across the region, rather than hypothesis testing of specific aspects of koala ecology (e.g. soil nutrients and leaf chemistry). We applied a multi-scale landscape design (sensu McAlpine et al., 2006) to investigate the influence of habitat heterogeneity at scales ranging from the individual tree to the site (30 neighbouring trees covering <1 ha), and the surrounding landscape (100–1000 s ha). The conceptual design is shown graphically in Figure 1. The following broad hypotheses and interactions are embedded in the design. They guided the data collection and subsequent identification of the major factors and their interactions that drive the distribution of koalas across the region.
Tree scale
Hypothesis 1.Koalas select a small number of tree species from the Symphyomyrtus and Alveolata subgenera.
Rationale
There is a substantial body of evidence that a small group of eucalypt species provide the majority of browse for koalas at any particular locality, with the specific composition of food resources varying regionally (e.g. Melzer et al., 2014; Moore et al., 2004).
Hypothesis 2.Larger diameter trees are more sought after than smaller trees.
Hypothesis 2A.Interaction: Tree diameter is especially important for the most tree species that were most used by koalas (see Hypothesis 1).
Rationale
Evidence indicates koalas tend to prefer larger trees (e.g. Callaghan et al., 2011; Phillips & Callaghan, 2000), as larger trees have greater access to soil nutrients including moisture, potentially greater leaf volumes and more options for browse selection and shelter.
Site scale
Hypothesis 3.Koalas select trees at sites that occur on higher nutrient soils over those occurring on lower nutrient soils.
Hypothesis 3A.Interaction: Soil nutrients are especially important for the most preferred tree species (see Hypothesis 1).
Rationale
There is evidence that soil nutrient status is likely to influence tree selection by koalas in some locations (e.g. Moore et al., 2004; Phillips et al., 2000). We investigated whether this was a significant feature across the study region and, if so, whether it applied to the most preferred tree species or across all tree preference rankings.
Hypothesis 4.There is more use of the less preferred trees as the proportion of preferred trees at a site increases.
Rationale
Koalas use more trees of non-preferred species at sites with high proportions of preferred trees. If this holds true, it confirms the importance of protecting all tree species at sites where preferred species are prevalent and supports the value in seeking to restore the original vegetation community composition at disturbed sites.
Landscape scale
Hypothesis 5.The probability of koalas being present is highest at sites that have larger areas of high-quality habitat (i.e. more preferred. the tree species that were identified as being most used) in the surrounding landscape.
Hypothesis 5A.Interaction: The level of use of the most preferred tree species is higher at sites that have larger areas of highly suitable habitat in the surrounding landscape.
Rationale
Outcomes from this analysis will have important implications for the prioritization of habitat patches for protection and restoration in fragmented landscapes because we predict a higher probability of koalas occurring in these habitats.
Study area
Our study covered four local government areas (LGAs) on the NSW far north coast: Lismore (1290 km2), Ballina (485 km2), Byron (567 km2) and Tweed (1321 km2) (Figure 1a,b). The climate is sub-tropical, with vegetation communities ranging from coastal heaths to sub-tropical rainforests and wet eucalypt forests on volcanic soils, and dry eucalypt forests growing on metamorphic-derived soils as well as alluvium and coastal plains. Land use is a mosaic of urban, low-density peri-urban and rural, with conservation areas typically located on infertile-sandy coastal soils and elevated, often rugged hinterland ranges. Our focus was on private lands throughout the region where koala populations occur, with a smaller number of surveys conducted in national parks, nature reserves and state forests. We investigated potential variables that best explain the distribution and activity of koalas at the tree, site and landscape scales (Figure 1c–e).
Survey design
The survey design was based on a whole-of-mosaic approach as proposed by Bennett et al. (2006). A similar approach has been applied for birds in agricultural landscape mosaics in Victoria (Radford & Bennett, 2007) and reptiles in the fragmented agricultural landscapes of the Brigalow Belt of southern Queensland (McAlpine et al., 2015). We divided the study region into 160 landscapes by overlaying it with a 5 × 5 km grid (Figure 2). Each landscape represented a mosaic of different levels of forest cover and vegetation community types. An exploratory analysis of sighting records indicated that koalas have a patchy distribution, occurring in over half of the 160 landscapes (Figure 2). Landscapes were then assigned to five categories according to the extent of potential koala habitat: 10%–20%, >20%–30%, >30%–40%, >40%–50% and >50%.
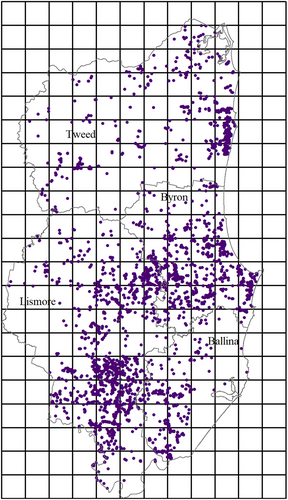
A subset of 10 landscapes, based on the presence of potential koala habitat (i.e. vegetation community types containing Eucalyptus, Angophora, Corymbia, Lophostemon, or Melaleuca species), was randomly selected from each of the five categories while ensuring an approximately even representation from each of the four LGAs, proportional to their geographic area. The land use composition (i.e. % urban, crops, horticulture, grazing and road density) was also considered, but was found to be strongly correlated with the extent of potential koala habitat and was not used in the selection process. Within each landscape, 10–12 prospective field survey sites were generated randomly using ArcGIS Version 10.6 (ESRI, 2018) across a range of forest patch sizes, with a minimum distance of 750 m between sites to reduce the possibility of tree use by the same individual koalas. The target was to sample six sites within each of the 50 selected landscapes. Additional prospective sites were generated to allow for anticipated failures to gain access to selected sites on some private properties. Survey data from four additional landscapes had been collected using comparable methods by Tweed Shire Council for koala monitoring on the Tweed Coast and these were added to the final data set prior to analysis (Tweed Shire Council, unpublished data).
Koala tree use surveys
The basis of our study was to describe tree use by koalas. We did this by relying on the detection of koala scats (i.e. faecal pellets) using the method known as the Spot Assessment Technique (SAT) (Phillips & Callaghan, 2011). Several other methods are available to conduct koala surveys that can be applied to help describe aspects of tree species use and habitat selection, such as spotlighting (Wilmott et al., 2018), radio-tracking (Law, Slade, et al., 2022; Matthews et al., 2007), audio surveys (Law et al., 2018) and drone surveys (Witt et al., 2020). However, the advantages of the SAT method are that scats usually persist for many weeks or months (Cristescu et al., 2012; Rhodes et al., 2011) so detection is not conditional on koala presence at the time of the survey; it is straightforward to apply; it is feasible to apply over very large study areas; it does not rely on expensive equipment; is conducted during daylight; requires few formal approvals; and it allows koala use of multiple trees at a site to be assessed simultaneously. The disadvantages are that it cannot determine whether trees were used during the day or at night; scat persistence may be unequal among sites; and the probability of detection is challenging to assess. However, as we are using presence-absence only rather than scat counts, the effect of variation in deposition and decay rates is minimized. The distinction between day and night is irrelevant since we want to capture all trees that are important, whether used primarily during the day or night, defining use as the tree with koala scats. Any disadvantages are outweighed when the method is applied to sample a very large number of trees and survey sites across an entire region. Furthermore, the other methods of koala survey take much longer to accumulate an equivalent record of koala tree use due to their single-point observations of koalas or, in the case of radio-tracking observations, the need for frequent monitoring and koalas visiting 1–8 trees per 24 h (Marsh et al., 2013). Audio surveys are it is unable to provide resolution at the individual tree scale.
Koala scat surveys were undertaken between July 2017 and October 2018. Working independently, two highly experienced field ecologists (W.G. and J.C.) undertook the surveys. A flood event occurred in the region in March 2017. We waited 3.5 months before commencing surveys to allow time for fresh scats to accumulate. Monthly rainfall during the survey period was close to or below average and evenly distributed across the study area (Appendix S1). Each landowner was contacted for permission to undertake koala surveys on their property. Hand-held GPS units were used to navigate to field survey sites. Where vegetation containing eucalypts was present, SAT surveys were conducted. A centre tree was selected for each site as close as possible to the predetermined GPS location, preferably a eucalypt typical of the given vegetation community type. A one-metre radial catchment area around the base of the designated centre tree, and each of the nearest 29 trees, was searched for approximately two person-minutes. If a koala scat was found, the search was concluded for that tree and commenced at the next closest tree. Only live trees with a diameter at breast height (DBH) of ≥10 cm were surveyed.
The widespread use of koala surveys by scat identification beneath trees has been recognized as an important and economical approach to surveying the presence-absence of koalas over large areas. Scat searches also allow for the measurement of key habitat characteristics starting with individual trees and can be readily scaled up to evaluate and contrast use of study sites and to assess the influence of surrounding landscapes (McAlpine et al., 2006). Some limitations of scat surveys have been highlighted (Cristescu et al., 2012; Rhodes et al., 2011). We addressed the limitations identified in these studies by the randomized selection of survey sites and of the centre tree at each site. We also avoided the difficult problem of heavy rains or flood waters degrading or washing away the koala scats by waiting several months post-flood before recommencing our surveys and noting that the rainfall patterns were below average to average during the period of our searches. Most importantly, we enhanced the effort and the geographical scale of our searches, covering four local government areas, with replication of sites across landscapes and vegetation communities. This allowed us to minimize risks of failing to detect tree use in different locations associated with variable rates of scat decomposition as noted by Rhodes et al. (2011) and Cristescu et al. (2012).
Explanatory variables
At the tree scale, the species and DBH were recorded for each surveyed tree, together with the presence or absence of koala scats (Table 1). We calculated the proportion of the 30 surveyed trees with scats at each site to derive site activity levels.
| Variable | Units | Description |
|---|---|---|
| Tree scale | ||
| Preference | Rank A1-3; B1-3 | Rank grouping based on statistical comparisons of proportional use. A = eucalypt groupings. B = non-eucalypt groupings |
| DBH | cm | Tree diameter at breast height |
| Site scale | ||
| Elevation | Metres ASL | Height of the site above sea level |
| Soil nitrate nitrogen | NO3–N mg N/kg | Nitrogen quantity – combined in the nitrate ion |
| Soil Colwell Phosphorus | (mg/kg P) | A widely used measure of plant-available phosphorus in soils |
| Soil Ammonium Nitrogen | (NH4–N mg N/kg) | Ammonium Nitrogen. Plants normally use nitrogen in only the ammonium and nitrate forms |
| Proportion preferred food trees | Proportion | Proportion of preferred tree species out of the 30 trees sampled at each survey site |
| Landscape scale | ||
| Koala habitat | Percent | Percent of the area of each koala habitat suitability class at 1.0, 2.5 and 5.0 km radial extents from each survey site |
At each site, elevation above sea level was recorded using a 30 m digital elevation model in ArcGIS. A soil sample was collected at a depth of approximately 10 cm. It was not possible to obtain samples of sub-soil due to the logistical issues of working in often rugged terrain. Soil was stored in a labelled paper bag for testing in the Environmental Analysis Laboratory, Southern Cross University. Each sample was tested for available nitrogen (NO3–N mg N/kg), Ammonium Nitrogen (NH4–N mg N/kg), and Colwell Phosphorous (mg/kg P) as measures of the nutrients available to plants. We assume that foliage levels of N and P are likely to reflect variation in the amount of these elements in the soil. Some support for this is provided by Hawkins and Polglase (2000).
For landscape-scale spatial modelling, we classified the habitat quality values into ranked categories using our field survey data and the tree species preference analysis (Table 2). We then calculated the area of each habitat category (see Koala habitat categorization for details) at three radial extents (1, 2.5, and 5 km) from each survey site. This metric was calculated using four habitat suitability classes: (i) highly suitable; (ii) suitable; (iii) highly suitable + suitable; (iv) highly suitable + suitable + marginal habitat categories.
| Assigned koala habitat category | Decision criteria |
|---|---|
| Highly Suitable (HS) Koala Habitat | Preferred Koala Food Trees (PKFTs) dominant or co-dominant |
| Suitable (S) Koala Habitat | PKFTs common to occasional associate |
| Ancillary (AN) Koala Habitat | PKFTs present but uncommon |
| Marginal (M) Koala Habitat | PKFTs absent, but other eucalypt species present |
| Other (O) | Forest or woodland communities that lack eucalypts |
| Not Koala Habitat (NKH) | Non-forest or woodland communities |
| Unknown (U) | Non-typed vegetation communities |
Tree species use by koalas
Field sites were classed as either ‘active’ or ‘inactive’ based on whether koala scats were present or absent. To rank tree species usage, we used data only from active sites (n = 152). This approach avoided the assumption that an absence of koala scats at a site at the time of the survey was indicative of poor habitat quality because it may have been due to historical land use or social factors (Callaghan et al., 2011). It also minimizes the likelihood of false absences under trees (i.e. koalas present but scats not detected). Data sets for each tree species from all active sites were suitable for analysis when they satisfied the following criteria: (i) the data had been obtained from at least seven active sites (Phillips et al., 2000); (ii) 30 trees were sampled; (iii) the data approximated a normal distribution (Berenson et al., 1988; Phillips et al., 2000). We divided the main data sets into eucalypts and non-eucalypts for statistical comparisons. We then applied stepwise Chi-square tests (Sokal & Rohlf, 1995) to identify non-significant subsets and to derive groupings for both eucalypts and non-eucalypts into the rankings of likely primary, secondary (collectively referred to as Preference class 1), and supplementary categories.
Koala habitat categorization
For analysis and modelling, we developed a koala habitat map for the region. Digital vegetation mapping and supporting vegetation community descriptions were provided by each of the four local governments. To estimate the likely representation of preferred tree species, we categorized the koala habitat values for each mapped vegetation polygon across the region using the corresponding vegetation descriptions and our field survey observations. The habitat suitability class for each vegetation community was assigned using the approximate proportional (percent) representation of the identified most used (i.e. preferred) food tree species (as per Callaghan et al., 2011). We relied upon the highest-ranking group of Eucalyptus species for habitat classification because evidence from other studies confirms that eucalypts typically constitute the majority of browse consumed by koalas (e.g. Hasegawa, 1995; Moore & Foley, 2000, 2005; Smith, 2004; Sullivan et al., 2003; Tucker et al., 2007). Therefore, these species will form the most critical components of koala habitat and a logical basis for rating habitat quality, supported by the key shelter and supplementary browse species. The Eucalyptus genus is divided into several subgenera, with the two largest being Symphyomyrtus and Monocalyptus, and Alveolata with just one species, tallowwood Eucalyptus microcorys (Brooker & Kleinig, 1999). Preferred koala food trees typically belong to the Symphyomyrtus and Alveolata subgenera.
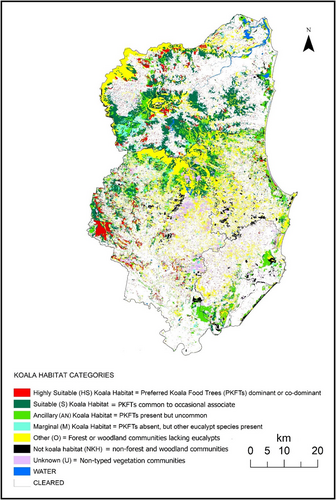
The decision criteria applied for designating the habitat suitability class for each mapped vegetation polygon are outlined in Table 2. The vegetation classification system and associated descriptions were based on standard vegetation formations, sub-formations and vegetation community types, but varied in the level of detail among the local government mapping products. The descriptions for the mapped community types did not consistently include average or expected proportional representations for each tree species. However, canopy tree species were typically listed in order of dominance, as had been applied to define the community. Where the descriptions were confined to the vegetation formation level, reference was made to Keith (2006) to establish the likely dominant canopy trees relevant to our study region and positions in the landscape. Hence, the decision criteria for rating the koala habitat values for each mapped vegetation-type polygon were based on an assessment of typical canopy species representation, with the focus on preferred koala food tree species. The preferred species were classed as dominant or co-dominant where their occurrence either as singular species or in combination with other preferred species would typically represent ≥50% of canopy trees. Where preferred koala food trees typically comprise ≥10% to <50% of the canopy trees they were considered as common to occasional associates for purposes of koala habitat categorization. This approach allowed for the greatest consistency when classifying the mapped vegetation community types to derive a uniform koala habitat ratings map across the study region (Figure 3).
Spatial statistical modelling
We developed mixed-effect spatial models of koala presence using the R-INLA package in R (Bakka et al., 2018). They provide a flexible approach for fitting Bayesian spatial statistical models that account for spatial autocorrelation using a stochastic partial differential equations approximation for Gaussian random fields. Our strategy was to identify parsimonious models for the effect of a range of covariates on the presence of koala scats under trees while accounting for any remaining unexplained spatial structure, that is spatial autocorrelation. We considered explanatory variables at the tree, site and landscape scales (Table 1). At the tree scale we considered: (1) whether the tree was of Preference class 1 or not and (2) the DBH. At the site scale, we considered: (1) elevation, (2) nitrate nitrogen, (3) Colwell phosphorus, (4) ammonium nitrogen and (5) percentage of trees of Preference class 1. At the landscape scale we considered: (1) percentage of area within 1, 2.5 and 5 km buffers that we classified as highly suitable habitat.
Prior to the spatial modelling, a correlation matrix of all continuous explanatory variables (using Spearman's rank correlation) was inspected for evidence of collinearity. Collinearity was low to moderate among most explanatory variables, with Spearman's correlation coefficient ≤ |0.6|, except among the landscape-level habitat variables measured at different buffer extents. Therefore, we chose to consider only alternative models that contained the landscape-level habitat variables at a single buffer extent. We then re-scaled all continuous variables to have a mean of zero and standard deviation of one.
We constructed alternative spatial models with the presence or absence of koala scats at the tree scale as the response variable and assumed a Bernoulli distribution. We then constructed 12 alternative models, consisting of four models for each of the three landscape-level scales (1, 2.5, and 5 km buffers). For each buffer extent, we constructed models with and without a normally distributed random effect on the intercept for site (to account for possible spatial autocorrelation between data points within a site) and with and without a spatial Gaussian random field (to account for possible spatial autocorrelation at broader scales). This led to four alternative models at each landscape scale, capturing all possible model combinations with and without the random effect and Gaussian random field. Each model contained all eight explanatory variables as main effects as well as interaction terms between whether the tree was of Preference class 1 or not, and DBH, nitrate nitrogen, Colwell phosphorus, ammonium nitrogen, percentage of trees of Preference class 1 and percentage of area within the buffer that was highly suitable habitat. The purpose of the interaction terms was to test for tree-scale and cross-scale interactions between the tree scale and the site and landscape scales (i.e. some factors may have greater influence when in combination with other factors).
We then selected the model with the lowest deviance information criterion (DIC) as the most parsimonious model. For each model, we used the model coefficient estimates and credible intervals to make inferences about the effect of each explanatory variable. All the R code and data for fitting the spatial models are available from: https://doi.org/10.5281/zenodo.5895563.
RESULTS
Tree species usage and activity levels
A total of 9066 trees was surveyed from 302 sites across the four LGAs, with 4452 of these trees being from 152 active sites. The tree species that satisfied criteria for inclusion in the data set for statistical comparison of proportional usage comprised 2288 eucalypts of 12 species and 1485 non-eucalypts from nine species (Table 3).
| Eucalyptus species (A) | Trees | Sites | Used | Code | Non-eucalypt species (B) | Trees | Sites | Used | Code |
|---|---|---|---|---|---|---|---|---|---|
| E. propinqua | 71 | 21 | 0.521 | 1 (2) | Melaleuca quinquenervia | 134 | 18 | 0.440 | 1 (5) |
| E. robusta | 288 | 44 | 0.507 | 1 (2) | Lophostemon suaveolens | 122 | 17 | 0.410 | 1 (5) |
| E. tereticornis | 426 | 43 | 0.441 | 1 (2) | Allocasuarina torulosa | 145 | 38 | 0.228 | 2 (5) |
| E. microcorys | 784 | 102 | 0.394 | 1 (1) | Cinnamomum camphora | 253 | 50 | 0.209 | 2 (6) |
| E. grandis | 189 | 36 | 0.339 | 1 (2) | Acacia (pooled species) | 45 | 33 | 0.178 | 2 (6) |
| E. saligna | 66 | 19 | 0.288 | 2 (2) | Angophora subvelutina | 37 | 11 | 0.162 | 2 (4) |
| E. pilularis | 113 | 25 | 0.221 | 2 (3) | Lophostemon confertus | 401 | 60 | 0.160 | 2 (5) |
| E. carnea | 32 | 10 | 0.219 | 2 (3) | Syncarpia glomulifera | 102 | 22 | 0.118 | 3 (6) |
| E. resinifera | 40 | 13 | 0.200 | 2 (2) | Corymbia intermedia | 246 | 67 | 0.114 | 3 (4) |
| E. dunnii | 108 | 15 | 0.194 | 2 (2) | |||||
| E. siderophloia | 57 | 21 | 0.123 | 3 (2) | |||||
| E. acmenoides | 114 | 26 | 0.096 | 3 (3) | |||||
| Total eucalypt | 2288 | Total non-eucalypt | 1485 |
- Note: The data show total eucalypts (A) and non-eucalypts (B) of each species together with the number of sites where each tree was sampled, the proportion of all trees in that species that were used (based on scat evidence), and the assigned Code. The first code number represents the rank grouping for eucalypts and non-eucalypts based on statistical comparisons of proportional use, followed by the genera/subgenera code: (1) = Eucalyptus Subgenus Alveolata; (2) = Subgenus Symphyomyrtus; (3) = Subgenus Monocalyptus; (4) = Corymbia, Angophora; (5) = Melaleuca, Allocasuarina, Lophostemon; (6) = other species.
Three significantly different subsets for proportional use among eucalypt species were identified (Table 3). The five eucalypt species in Table 3 are the PKFTs. These are grey gums Eucalyptus propinqua/biturbinata (hereafter referred to as E. propinqua), swamp mahogany E. robusta and forest red gum E. tereticornis (Subset A), followed by tallowwood and flooded gum E. grandis (Subset B). They represent the most used species (hereafter ‘Preference 1’) with a significant test result recorded between this group and lower ranked species (x2 = 30.408, 7df, p < 0.001). Among the non-eucalypt species, three subsets were identified (Table 3). Proportional usage for the subset comprising broad-leaved paperbark Melaleuca quinquenervia and swamp box Lophostemon suaveolens was significantly higher than that recorded for other non-eucalypt species (x2 = 56.066, 7df, p < 0.001). A closer examination revealed that the proportional use of E. grandis was significantly higher for the Lismore LGA than for the other three pooled LGAs (x2 = 12.928, 1df, p < 0.001). Similar analyses for E. propinqua, E. robusta, E. tereticornis and E. microcorys did not identify any significant differences in proportional use of these species among the LGAs.
Use and availability of tree species
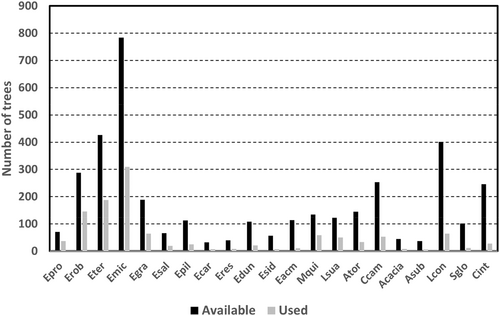
The use and availability for the 21 tree species (Table 3) are shown in Figure 4. (Note, we provide a descriptive summary of this relationship and the importance of tree diameter, which is analysed in the modelling in Section Ranking of models). E. propinqua showed the highest ranking, that is use by koalas, followed by E. robusta and E. tereticornis. E. microcorys was the most frequently encountered species, representing 39% of the trees used by koalas. The exotic invasive species camphor laurel Cinnamomum camphora, plus native Acacia species, Syncarpia glomulifera, Lophostemon confertus and Corymbia intermedia had the lowest preference.
Importance of tree diameter
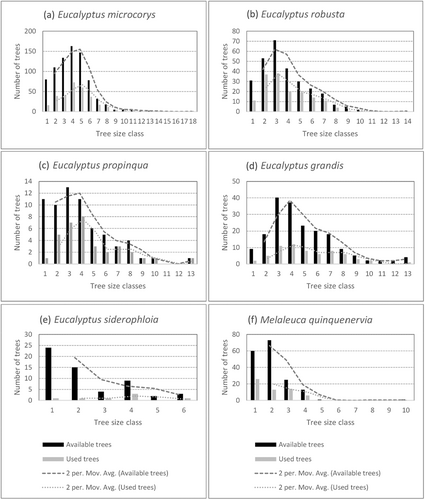
Figure 5 illustrates the size class distribution for six tree species, together with the corresponding levels of use by koalas. Koalas used trees across the spectrum of size-classes in the Preference 1 category (E. microcorys, E. robusta, E. propinqua, E. tereticornis and E. grandis). Trees in the 30–60 cm DBH classes were the most frequently used, however, this approximately corresponds with the size class distributions for these species. In the case of M. quinquenervia, the most frequent use was recorded for the smallest size class.
Ranking of models
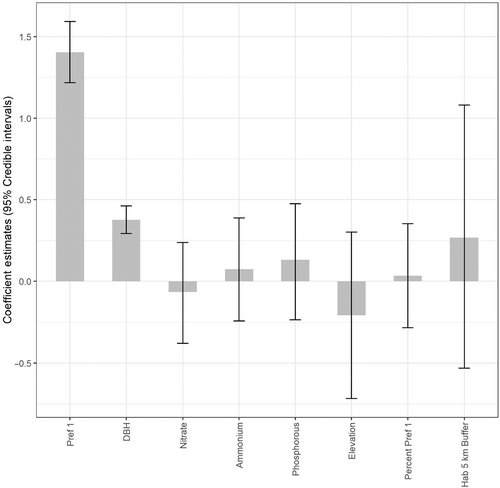
The most parsimonious model included both a site-level random effect and a Gaussian random field, with a landscape buffer size of 5 km (4.44 DIC units lower than the next nearest model, Appendix S2). Based on the coefficient estimates, and 95% credible intervals for the main effects only model, we found that Hypotheses 1 and 2 were supported, but there was little support for Hypotheses 3, 4 and 5 (Figure 6). There was evidence that, at the tree scale, koalas were most likely to utilize Preference class 1 trees and trees with a 30–60 cm diameter, that is credible intervals of the coefficient estimates did not overlap zero, but there was less evidence for the effect of the explanatory variables at other scales.
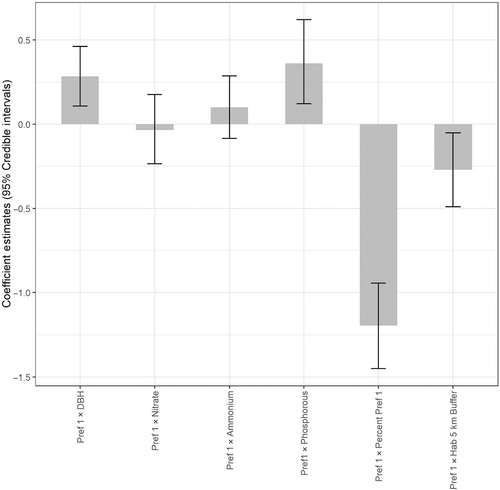
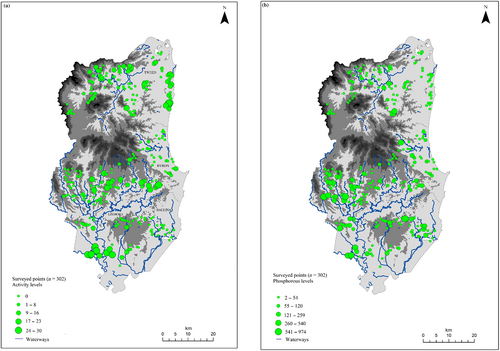
There was substantial evidence for important tree-scale and cross-scale interactions (where credible intervals of interaction effects did not overlap zero) based on the interactions model (Figure 7). There was a positive interaction between Preference 1 trees and DBH (Hypothesis 2A). However, there was little evidence for the effect of DBH varying among the tree species preference classes, thus not supporting the notion that larger trees of the non-preferred classes may be of particular importance. As Colwell phosphorous (hereafter phosphorous) at the site scale increased (Hypothesis 3A), preference class 1 trees were more likely to be selected relative to other trees. Phosphorous levels ranged from 2.6 to 1177.7 μg P/g, with the highest levels occurring on the volcanic basalt soils and riverine floodplains (Figure 8). The use of Preference class 1 trees at the site scale became less pronounced relative to other trees as the proportion of Preference class 1 trees increased (i.e. a negative interaction; Figure 7). Similarly, at the landscape scale, Preference class 1 trees were less likely to be selected relative to other trees as the proportion of highly suitable habitat in the surrounding landscape (5 km buffers) increased (Figure 7). This is the opposite effect predicted in Hypothesis 5A and supports a finding that the increasing area of high-quality habitat dampens the site scale use of proportional use of Preference class 1 trees because there is greater availability of Preference class 1 trees in the surrounding landscape.
DISCUSSION
In this study, we asked: what are the key regional influences on habitat selection by koalas in the far north coast of NSW? We found that tree species preferences and key interactions at the tree, site and landscape scale combined to provide habitat for the region's koalas. The importance of five Eucalyptus species we identified as being preferred tree species (Hypothesis 1) by koalas, and interaction of these tree species and tree size (Hypothesis 2A) was consistent with other studies. However, we identified new interactions among the utilization of preferred tree species and soil phosphorous, and the distribution of these species and the amount of suitable habitat in the surrounding landscape. These cross-scale interactions highlight the importance of simultaneously looking at multiple scales when investigating how koalas use their habitat. These findings can be applied in the implementation of habitat restoration programmes. Quantifying these factors are assisting in the development of a regional-scale strategy to conserve koala populations across four adjacent local government areas (LGAs that we studied, plus now incorporating a further additional two neighbouring LGAs), and, in doing so, provides a model for other regions. The approach also has relevance for regional-scale conservation planning for other species. Below, we discuss our findings and outline how they can underpin a regional koala management strategy.
Synthesis of key findings
The dominant factor influencing the region's koala activity was the distribution of the five preferred Eucalyptus species (Hypothesis 1). The most preferred tree species were E. propinqua, E. robusta, E. tereticornis, E. microcorys and E. grandis. These species have been found to be important in the diet of koalas at other locations in NSW (Law, Slade, et al., 2022; Matthews et al., 2007; Radford Miller, 2012). Matthews et al. (2007) provides evidence of high use of E robusta in feeding. Radford Miller (2012) from scat analysis found high use of E. microcorys and frequent use of E. propinqua and E. grandis. Law, Slade, et al. (2022) found very frequent night-time use (when koalas are feeding) of E. microcorys and frequent night use of E. propinqua. Barth et al. (2019) found frequent use of E. tereticornis but based on daytime tracking. Personal observations by Ross Goldingay and John Callaghan show this species is used frequently in feeding. The distribution of other tree species was not a determining factor influencing the occurrence of koalas in the region. The finding that koalas choose a relatively small group of eucalypt species from the Symphyomyrtus and Alveolata subgenera is consistent with the concept that leaf palatability and nutritional value as primary drivers of food tree selection by koalas (Moore et al., 2010). However, we found that tree selection by koalas involved other factors. There was a positive interaction between the use of the highest-ranked (Preference class 1) tree species and their size (Hypothesis 2A), as well as some evidence that medium-sized trees are selected regardless of their preference class (Hypothesis 2). This finding is consistent with other studies that found koalas prefer larger trees, particularly among the high-ranking species (e.g. Callaghan et al., 2011; McAlpine et al., 2006, 2008; Moore et al., 2010; Phillips & Callaghan, 2000; Smith, McAlpine, Rhodes, Lunney, et al., 2013). Medium to larger diameter trees are of particular significance to koalas in both forested areas and disturbed landscapes, such as floodplains and pastures. It is not surprising that important koala food trees are likely to be even more sought after as they increase in diameter and offer more browse choice, as well as enhanced shelter. It is notable that koalas also used trees in the lowest size-classes, a finding consistent with some previous studies (e.g. Kavanagh & Stanton, 2012; Law, Slade, et al., 2022). Our findings support the notion that the use of Preference class 1 trees was less pronounced relative to other trees as the proportion of Preference class 1 trees at the site scale increased (Hypothesis 4). The lower preference tree species may have important habitat values, such as providing supplementary browse and shelter. However, unlike the key food tree species, the high-ranked non-eucalypt species are not treated as a critical limiting resource for habitat rating purposes given that a wide range of trees can provide shelter for koalas (J. Callaghan, personal observation). There is a likelihood that some tree species may become seasonally more important for food or shelter in a regional landscape, although this was beyond the scope of the current study. Given that our results indicate that medium-sized trees of the preferred eucalypt species are the most used resource for koalas, we should maximize their protection and plan for the long-term restoration of mature forest ecosystem types that support these species. Within our study region, E. microcorys is the most widespread and abundant of the group of preferred koala eucalypts, followed by E. tereticornis. Consequently, these species have special importance when considering priorities for koala conservation and habitat restoration programmes.
We found a significant positive interaction between Preference class 1 trees and soil phosphorous levels in the upper soil profile, suggesting that soil nutrients influence koala use of preferred eucalypts, thus agreeing with Hypothesis 3A. Nitrate nitrogen and ammonium nitrogen did not have a significant effect. Phosphorous is a critical limiting nutrient in most Australian soils (National Committee on Soil and Terrain, 2009). Colwell phosphorous is a measure of the phosphorus that is available for plant uptake, and it is critical for the health of eucalypts. We note that, in our study, this relationship is correlative and does not confirm causality (sensu Shipley, 2000). Furthermore, we consider that tree-scale research into the relationship between soil phosphorous levels, leaf chemistry and koala tree selection would be required to confirm causality and could help inform where habitat restoration should be focused for maximum effect.
While we only sampled near-surface phosphorous, there is evidence that near-surface levels are linked to parent substrate material (Porder & Ramachandran, 2013; Vitousek et al., 2010). According to Porder and Ramachandran (2013), parent material explained 42% of the variance in soil phosphorous across 62 sites in a global soils database (sourced from the EarthChem database https://www.earthchem.org/). This relationship was stronger for sites with a similar climate. Phosphorous is enriched in basalt rocks with an average concentration of around 1200 mg/kg compared to 750 mg/kg in granite and rhyolite rocks. This is demonstrated by the soils of the Atherton Tablelands in northern Australia which have six times higher phosphorous on basalt than on schist-based parent material (Gleason et al., 2009). On this basis, we consider it is reasonable to forecast that our results are likely to provide a reliable indicator of soil phosphorous levels available to eucalypt species used by koalas in the study region.
The negative interaction between the use of Preference 1 trees, and the proportion of high-quality habitat in the 5 km radial landscape (Hypothesis 5A), suggests that tree selection by koalas is even more focused on preferred tree species in highly modified agricultural landscapes. This finding differs from those of McAlpine et al. (2006, 2008) for Noosa and Port Stephens Shires, where there was a consistent positive relationship between the amount of highly suitable and suitable habitat and the probability of koala occurrence. However, our study also confirmed that koalas do indeed also occur in less modified coastal and elevated hinterland landscapes with a substantial proportion of highly suitable habitat. The importance of hinterland forests to koalas was also demonstrated for north-east NSW by Law et al. (2018) and Goldingay et al. (2022). This highlights that koala populations can utilize a mosaic of landscape-types across the region, provided the highly preferred (Preference class 1) tree species are present. These landscapes can include comparatively small patches containing the preferred trees species, as well as linking areas with scattered trees, particularly where larger remnant trees are present and growing on higher nutrient soils. The importance of scattered paddock trees and small remnants to koalas occupying fragmented landscapes was also confirmed by Barth et al. (2019). Therefore, the ecological importance of these often-overlooked landscape elements needs to be carefully considered for future conservation planning.
Towards a regional strategy
The issue of region-wide koala conservation has been recognized for north-western NSW (Predavec et al., 2018), an area comparable in size to the far north coast of NSW. By focusing on the scale of the four LGAs, we have provided the ecological basis for developing a regional approach to koala conservation. There is strong local community support for koala conservation and recovery measures to help ensure koalas continue to survive in the region (Brown et al., 2018; Brown, McAlpine, et al., 2019; Brown, Rhodes, et al., 2019; Fielding et al., 2022; Lunney et al., 2022). This study has provided an ecological foundation for a koala conservation strategy for the four LGAs, as well as the neighbouring Kyogle and Richmond Valley LGAs, are currently in an advanced stage of developing a regional koala conservation strategy. This approach could also be applied as a model for other regions. The regional strategy has the capacity to address residual gaps from local, regional, state and Commonwealth koala conservation programmes.
Our study confirms that the habitat preferences of koalas are broadly consistent throughout the region, but there are some novel interactions of tree values and preferences with other environmental factors. Knowing the main drivers of koala distribution is fundamental to the protection and restoration of the region's koala populations. There are key populations within the region that can be prioritized through a regional strategy, and these will be vital for regional population recovery following adverse events, such as floods, droughts and bushfires. The knowledge gained from this study can also be applied to identify, protect and restore refugial areas to support koalas and would also help mitigate the emerging impacts from climate change. Funds and human resources are limited, thus it is important for each LGA, as well as community organizations, state government departments and the Commonwealth, to share expertise and resources and to work in partnership towards securing a sustainable, regional koala population. The intent to do so is inherent in the 2022 NSW Koala Strategy (DPE, 2022) and the Commonwealth Koala Recovery Plan (DAWE, 2022), and our study moves this idea into a realm of being achievable much more quickly than if our detailed study had not been undertaken. We maintain that research into the specifics of habitat use, especially on private lands, as in this study, is an essential precursor to laying the foundations for any aspiration to support the long-term survival of regional koala populations.
AUTHOR CONTRIBUTIONS
Clive A. McAlpine: Conceptualization (equal); formal analysis (equal); methodology (equal); project administration (equal); supervision (equal); writing – original draft (equal); writing – review and editing (equal). John Callaghan: Conceptualization (equal); data curation (equal); formal analysis (equal); methodology (equal). Daniel Lunney: Conceptualization (equal); investigation (equal); methodology (equal); writing – original draft (equal); writing – review and editing (equal). Jonathan R. Rhodes: Conceptualization (equal); formal analysis (equal); methodology (equal). Ross Goldingay: Conceptualization (equal); formal analysis (equal); writing – original draft (equal); writing – review and editing (equal). Will Goulding: Data curation (equal); investigation (equal); software (equal). Christine Adams-Hosking: Formal analysis (equal); software (equal); writing – review and editing (equal). Kelly Fielding: Conceptualization (equal); investigation (equal); methodology (equal). Scott Benitez Hetherington: Conceptualization (equal); data curation (equal); funding acquisition (equal); project administration (equal). Angie Brace: Data curation (equal); investigation (equal). Marama Hopkins: Data curation (equal); investigation (equal). Liz Caddick: Data curation (equal); investigation (equal). Elisha Taylor: Data curation (equal); investigation (equal). Lorraine Vass: Data curation (equal); investigation (equal). Linda Swankie: Data curation (equal); investigation (equal).
ACKNOWLEDGEMENTS
This work was supported by the Australian Research Council Linkage Project grant LP160100486 to the University of Queensland, the University of Sydney, the Tweed, Byron, Ballina and Lismore Councils and the Friends of the Koala. We acknowledge the input of Greg Brown, a lead investigator on the project, who passed away in 2019. JRR was supported by an Australian Research Council Future Fellowship (FT200100096). Biolink provided koala survey data for Ballina Shire. We also acknowledge the support and commitment of the councils of the four LGAs that are at the centre of this study, and Friends of the Koala, based in Lismore. Open access publishing facilitated by The University of Queensland, as part of the Wiley - The University of Queensland agreement via the Council of Australian University Librarians.
Open Research
DATA AVAILABILITY STATEMENT
The data that support the findings of this study are available from the corresponding author upon reasonable request.


