

Stem diameter growth rates in a fire-prone savanna correlate with photosynthetic rate and branch-scale biomass allocation, but not specific leaf area
Abstract
Plant growth rates strongly determine ecosystem productivity and are a central element of plant ecological strategies. For laboratory and glasshouse-grown seedlings, specific leaf area (SLA; ratio of leaf area to mass) is a key driver of interspecific variation in growth rate (GR). Consequently, SLA is often assumed to drive GR variation in field-grown adult plants. However, there is an increasing evidence that this is not the general case. This suggests that GR – SLA relationships (and perhaps those for other traits) may vary depending on the age or size of the plants being studied. Here we investigated GR – trait relationships and their size dependence among 17 woody species from an open-canopy, fire-prone savanna in northern Australia. We tested the predictions that SLA and stem diameter growth rate would be positively correlated in saplings but unrelated in adults while, in both age classes, faster-GR species would have higher light-saturated photosynthetic rate (Asat), higher leaf nutrient concentrations, higher branch-scale biomass allocation to leaf versus stem tissues and lower wood density (WD). SLA showed no relationship to stem diameter GR, even in saplings, and the same was true of leaf N and P concentrations, and WD. However, branch-scale leaf:stem allocation was strongly related to GR in both age groups, as was Asat. Together, these two traits accounted for up to 80% of interspecific variation in adult GR, and 41% of sapling GR. Asat is rarely measured in field-based GR studies, and this is the first report of branch-scale leaf:stem allocation (analogous to a benefit:cost ratio) in relation to plant growth rate. Our results suggest that we may yet find general trait-drivers of field growth rates, but SLA will not be one.
Introduction
 (1)
(1)But do high SLA species achieve faster growth rates also as adults? Intuitively one might think so. After all, high SLA species typically have high leaf N and P concentrations and various other traits indicative of a ‘fast’ lifestyle (Reich 2014). However, it seems increasingly apparent that SLA and field-measured growth rates are most commonly unrelated (Gower et al. 1993; Coomes & Grubb 1998; Poorter et al. 2008; Aiba & Nakashizuka 2009; Easdale & Healey 2009; Martínez-Vilalta et al. 2010; Hérault et al. 2011; Rüger et al. 2012; Paine et al. 2015). In only a minority of cases – mostly for saplings or small trees – has a positive SLA-growth relationship been reported and even then, only weakly (Reich et al. 1992; Prior et al. 2004; Poorter & Bongers 2006; Rossatto et al. 2009; Wright et al. 2010). This raises the question, how is it that, through ontogeny – or with increasing plant size – variation in SLA becomes less strongly correlated with plant growth rate? This is an important question, with species-dimensions running from slow to fast growth rates, and low to high SLA, being widely accepted as pivotal in plant ecological strategies (Grime et al. 1997; Westoby et al. 2002; Reich 2014).
One potential explanation is that low SLA species accumulate more massive canopies over time (because of their longer leaf lifespan), and this counteracts their slower per-gram metabolic rates such that annual productivity can be as high as that of a high SLA species (Chabot & Hicks 1982; Matyssek 1986; Reich et al. 1992). Another potential explanation was outlined by Gibert et al. (2016). In their first-principles plant growth model, SLA always had a positive influence on growth rate but, as plants grow, this effect becomes increasingly masked by leaf turnover costs (which are higher in high SLA species, because of short leaf lifespan) and by increasing sapwood respiration costs – because larger plants have relatively more sapwood (King 1999; Poorter et al. 2012). Other predictions from this model were that, irrespective of plant size, light-saturated photosynthetic rate (Asat) should correlate positively with growth rate, and wood density negatively. Meta-analysis across a range of trait – growth studies showed broad support for these predictions, though low sample size (number of studies) was a recurring problem for the analysis (Gibert et al. 2016).
Considering plant growth as an outcome of the balance between sapwood respiration and leaf photosynthesis is not new. For example, slower growth rates in larger (older) trees are likely a result of whole-plant sapwood volume increasing more rapidly over time than canopy leaf area (Ryan 1989). Of particular interest for this study, one can make a related argument at branch-scale. That is, species (or indeed, individuals) deploying more leaf relative to stem wood and bark on terminal branches (i.e. with higher branch-scale LMF) should – all else equal – achieve faster whole-plant growth rates (Pickup et al. 2005). This intriguing proposition remains untested.
In this study we investigated the size-dependence of relationships between growth rate and several key plant functional traits (including branch-scale leaf:stem allocation), for a range of woody species from a fire-prone savanna in northern Australia. We chose this vegetation type because we expected the predicted relationships to be most clearly expressed in a situation where competition for light is minimal, and potential photosynthetic benefits are more likely to be realized. For each species we sampled traits both on small-DBH individuals and on larger-DBH individuals (henceforth called ‘saplings’ and ‘adults’), and matched the trait data to previously reported long-term, stem-diameter growth rate data, re-calculated separately for small and large individuals. We tested the following predictions: (i) The GR – SLA relationship would be positive in saplings but absent among adult plants; (ii) Asat (expressed per unit leaf area) would explain substantial variation in GR, both in saplings and adults; (iii) Trends in leaf N and P would mirror those in Asat (e.g. because N-rich proteins and P-rich energetic molecules play key roles in plant metabolism); (iv) Sapwood tissue density would be negatively related to GR both in saplings and adults and (v) Branch-scale leaf:stem biomass allocation would correlate positively with GR, both in saplings and adults.
Materials and Methods
Trait dataset: Site and species selection
We sampled species at Howard Springs Nature Reserve, 30 km east from Darwin. The savanna vegetation there is typical of the region, with an overstory dominated by eucalypts and an understory dominated by C4 grasses. Overstory leaf area index ranges between about 0.6 in the dry season to 1 in the wet season (Hutley et al. 2001). At Darwin airport (20 km to the west), long-term annual rainfall is 1736 mm, typically with >95% of rain falling during the wet season (October–April). Mean annual temperature is 27.6°C (data from www.bom.gov.au). Fires occur regularly in the dry season; typical fire return intervals in the region are 1–3 years (Russell-Smith et al. 2003). Soils at the site are sandy and low in nutrients: mean (and standard deviation) nutrient concentrations in eight soil samples (0–20 cm depth) collected in September 2010 were as follows: total C = 2.7% (1.8), total N = 0.093% (0.074), total P = 72.7 mg kg−1 (22.6).
Deciduous, semi-deciduous and evergreen species are all present in this savanna. Hence, we sampled plant traits at two time points: at the end of one dry season (September 2010), when deciduous species are leafless and the canopies of semi-deciduous species are at their thinnest; and right at the end of the subsequent wet season (early May 2011), when most species still tend to have full or nearly-full canopies (Williams et al. 1997). We selected 17 species to study, based on available growth rate data and their availability across two nearby sub-sites (12°27′10″S, 131°6′30″E; 12°27′57″S, 131°6′51″E). This species-set represents a range of functional types (trees and shrubs; nitrogen-fixers and non-fixers; deciduous, semi-deciduous and evergreen species; Table 1). We used diameter at breast height (DBH) to identify ‘adults’ versus ‘saplings’ for each species, but we use these terms informally (i.e. not necessarily reflecting degree of reproductive maturity), and synonymously with ‘small individuals’ and ‘large individuals’ of each species (Prior et al. 2006). For species that are large trees at maturity we used a DBH cut-off of 6 cm to distinguish saplings from adults; for smaller trees and shrub species we used a 3 cm cut-off, with the exception of the small, short-lived and fast growing species Acacia difficilis, for which we used a cut-off of 1.5 cm DBH (Table 1). When choosing plants to sample we prioritized individuals of each species which clearly fell into these size-defined ‘sapling’ and ‘adult’ categories, so as to minimize ambiguity in this regard. For each age/size class of each species we aimed to make trait measurements on each of five individuals.
| Species | Family | Leaf phenology | Habit | N2 fixer | DBH cut-off (cm) | GR sample size (saplings, adults) |
|---|---|---|---|---|---|---|
| Acacia difficilis | Fabaceae | Evergreen | Shrub | Yes | 1.5 | –, 19 |
| Acacia latescens | Fabaceae | Evergreen | Shrub | Yes | 3 | 77, 67 |
| Acacia mimula | Fabaceae | Evergreen | Shrub | Yes | 3 | 15, 31 |
| Buchanania obovata | Anacardiaceae | Semi-deciduous | Tree | No | 6 | 31, 95 |
| Cochlospermum fraseri | Bixaceae | Deciduous | Tree | No | 3 | 8, 21 |
| Corymbia bleeseri | Myrtaceae | Semi-deciduous | Tree | No | 6 | 44, 220 |
| Corymbia porrecta | Myrtaceae | Semi-deciduous | Tree | No | 6 | 207, 752 |
| Erythrophleum chlorostachys | Fabaceae | Semi-deciduous | Tree | Yes | 6 | 273, 741 |
| Eucalyptus miniata | Myrtaceae | Evergreen | Tree | No | 6 | 635, 1559 |
| Eucalyptus tetrodonta | Myrtaceae | Evergreen | Tree | No | 6 | 346, 1810 |
| Grevillea decurrens | Proteaceae | Semi-deciduous | Shrub | No | 3 | –, 9 |
| Grevillea pteridifolia | Proteaceae | Semi-deciduous | Shrub | No | 3 | 12, 94 |
| Lophostemon lactifluus | Myrtaceae | Semi-deciduous | Tree | No | 6 | 34, 159 |
| Persoonia falcata | Proteaceae | Semi-deciduous | Shrub | No | 3 | 4, 36 |
| Petalostigma pubescens | Picrodendraceae | Evergreen | Tree | No | 6 | 24, 48 |
| Planchonia careya | Lecythidaceae | Deciduous | Tree | No | 3 | 4, 147 |
| Xanthostemon paradoxus | Myrtaceae | Semi-deciduous | Tree | No | 6 | 207, 168 |
- Semi-deciduous species are evergreen, but exhibit a noticeable thinning of the canopy during the dry season.
Leaf traits
Five recently-matured, fully-expanded and undamaged leaves (including petioles) were collected from each individual for determination of one-sided projected leaf area (flatbed scanner), oven-dried mass (70°C for at least 48 h) and thus SLA (area per dry mass; cm2 g−1). Total N concentration of leaf and soil samples was measured with a LECO TruSpec CHN analyser; total P by ICP-OES, on nitric acid digests (analyses run at Appleton Lab, University of Queensland). Area-based leaf N and P concentrations were calculated from mass-based concentrations and the mean SLA value for each species/age class.
Light-saturated rates of photosynthesis (Asat) and stomatal conductance to water vapour (gs) were measured during the wet season only, using a Li-Cor 6400XT portable infra-red gas analyser (5–8 replicate plants per species/age class). These measurements were made on leaves held on detached branches, >1 m in length; branch-ends were re-cut and kept in water post-harvest until photosynthesis was measured (within 5 min of harvesting). Cuvette block temperature was kept at 26–27°C, reference CO2 was set to 400 ppm and cuvette photosynthetic photon flux density was maintained at 2000 μmol m−2 s−1. Cuvette vapour pressure deficit was only loosely controlled, averaging 1.22 kPa across all measurements (standard deviation 0.28). Leaf lamina material used in photosynthetic measurements was oven-dried and pooled per species/age class, then analysed for 13C/12C stable isotope composition (hereafter ‘δ13C’) at the Stable Isotopes Laboratory, Australian National University, Canberra. The δ13C provides an integrated measure of the extent of CO2 drawdown during photosynthesis (Farquhar et al. 1982). We also measured δ13C on representative whole-leaf (including petiole) samples collected during September 2010 (dry season).
Branch traits
A single terminal branch, 80 cm in length, was sampled from each of several individuals of each species/age class (average, 4.8 branches per species/age). These were divided into segments cut at 5, 10, 20, 40 and 80 cm from the terminal end and oven-dried at 70°C for at least 5 days. For each 80 cm branch (and including material on any side-branches) we calculated (i) total leaf dry mass, (ii) total stem dry mass, (iii) the ratio of leaf:stem dry mass for this 80 cm segment (hereafter LM:SM), (iv) the ratio of leaf area: stem dry mass (by multiplying leaf mass by the appropriate SLA value; hereafter LA:SM) and (v) the allometric slope describing leaf mass accumulation versus stem mass accumulation (hereafter a_LMSM). This slope was estimated for accumulations from the tip going back down the stem, expressed at the 5, 10, 20, 40 and 80 cm sampling points. These allometries were calculated as standardized major axis slopes (Warton et al. 2006) fitted to log-transformed data. The ‘static ratio’ (LM:SM, LA:SM) and allometric (a_LMSM) descriptors were of course correlated, but sufficiently weakly (mean r2 across age/season datasets = 0.37) that they contained substantial independent information about branch-scale leaf:stem allocation.
Stem tissue density (dry mass per fresh volume) was measured on 2 cm long branch segments of approximately 1 cm over-bark diameter. For dry season samples, density was measured on whole stems, including bark. For wet season samples, the bark was first removed, allowing us to measure relative dry mass allocation to bark versus sapwood. For these samples, stem density refers to that of the sapwood only (plus any pith, if present). Hereafter we refer to these quantities as ‘WD’ (wood density). At each date, five samples were taken per species/age class. Sample volumes were measured using standard procedure (via displacement), and dry masses after oven-drying at 70°C for 7 days.
Growth rates
The stem increment (growth rate) data were not measured as part of this study. Data for northern Australian savanna species came from two sources: (i) The ‘Kapalga’ dataset and (ii) the ‘Three Parks’ dataset (Murphy et al. 2010). Kapalga (12°50′S, 132°50′E) is located 200 km east of Darwin in Kakadu National Park. It was run as a CSIRO research station from the mid-1970s to the mid-1990s. Various combinations of fire frequency and severity were generated between 1990 and 1995 (Cook & Corbett 2003; Williams et al. 2003). Stem diameters at 1.3 m height (DBH) were measured every 12 months. The ‘Three Parks’ dataset contains repeat-measured DBH data for savanna vegetation in Kakadu, Litchfield and Nitmiluk National Parks (Northern Territory, Australia). At each of 163 locations, all individuals with DBH ≥5 cm were initially measured between 1994 and 1997, then re-measured twice, each time approximately 5 years apart. DBH measurements were made during the wet season only (to avoid the stem shrinkage that may occur during dry conditions). Fire severity and frequency was determined for each location/census period post hoc, using survey data and aerial photographs (Murphy et al. 2010). Annual rainfall ranges from 900 mm at Nitmiluk to 1470 mm at Kakadu (including Kapalga), with sites showing similar seasonality (Murphy et al. 2010). Murphy et al. (2010) – one of our two sources of growth rate data – showed that DBH growth rate was unrelated to rainfall across this region, suggesting that the GR data should be broadly representative of our study species, despite Howard Springs receiving higher rainfall.
In savanna, fire damage to stems may result in very low or even negative stem diameter increments between censuses. We took three steps to counter this issue. First, we discarded all DBH data from sites designated as having experienced ‘severe’ (Kapalga) or ‘frequent, severe’ (Three Parks) fire. Second, all negative increment data were discarded. This resulted in a dataset with 7897 rows, each row describing a stem diameter increment for some individual plant, for some census period. (Data from Kapalga contributed 5155 rows; from Three Parks, 1340 rows from Kakadu NP, 765 from Litchfield NP, 637 from Nitmiluk NP). Finally, we summarized the set of stem increment data for each species/age class using 80th percentiles, rather than a measure of central tendency (Clark & Clark 1999; Rozendaal et al. 2010; Wright et al. 2010). Doing so should minimize the influence of fire-damaged plants and better facilitate quantifying trait-growth relationships of ‘successful’ individuals of each species and age class (by analogy, we measured traits such as photosynthetic rates on recently-matured leaves which are near their peak physiological condition). There were too few data to confidently estimate GR for saplings of A. difficilis and Grevillea decurrens, meaning that we had GR data for 17 species as adults, and 15 species as saplings. Trait data were averaged to give a single value for saplings and for adults, for each species, for each sampling period (Appendices S1–S3). Almost all individuals of the two deciduous species were leafless during dry season sampling, limiting analyses of GR-trait relationships for that period to 16 species as adults and 13 species as saplings (Table 2).
| Trait | Saplings (dry season) | Saplings (wet season) | Adults (dry season) | Adults (wet season) |
|---|---|---|---|---|
| r2, P, n, sign | r2, P, n, sign | r2, P, n, sign | r2, P, n, sign | |
| log SLA (cm2 g−1) | 0.02, 0.664, 13 | 0.002, 0.870, 15 | 0.02, 0.633, 16 | 0.03, 0.492, 17 |
| log Nmass (%) | 0.06, 0.425, 13 | 0.03, 0.536, 15 | 0.04, 0.499, 15 | 0.13, 0.149, 17 |
| log Narea (g m−2) | 0.05, 0.468, 13 | 0.05, 0.409, 15 | 0.08, 0.315, 15 | 0.07, 0.302, 17 |
| log Pmass (%) | 0.15, 0.193, 13 | 0.11, 0.226, 15 | 0.02, 0.606, 15 | 0.05, 0.397, 17 |
| log Parea (g m−2) | 0.04, 0.526, 13 | 0.11, 0.223, 15 | 0.04, 0.487, 15 | <0.001, 0.997, 17 |
| log Asat (μmol m−2 s−1) | 0.23, 0.071, 15, + | 0.32, 0.017, 17, + | ||
| log gs (mmol m−2 s−1) | 0.20, 0.095, 15, + | 0.17, 0.095, 17, + | ||
| Leaf d13C (‰) | 0.03, 0.59, 12 | 0.25, 0.056, 15, − | 0.01, 0.736, 16 | 0.13, 0.157, 17 |
| log LM (g) | 0.22, 0.101, 13 | 0.03, 0.520, 15 | 0.02, 0.613, 16 | 0.09, 0.252, 17 |
| log SM (g) | 0.13, 0.225, 13 | 0.09, 0.290, 15 | 0.27, 0.039, 16, − | 0.32, 0.019, 17, − |
| log LM:SM (g g−1) | 0.65, 0.001, 13, + | 0.16, 0.134, 15 | 0.18, 0.097, 16, + | 0.44, 0.004, 17, + |
| a_LM/SM | 0.51, 0.006, 13, + | 0.32, 0.027, 15, + | 0.41, 0.008, 16, + | 0.32, 0.017, 17, + |
| log LA:SM (cm2 g−1) | 0.66, 0.001, 13, + | 0.08, 0.313, 15 | 0.15, 0.132, 16, + | 0.35, 0.013, 17, + |
| Bark % mass | 0.05, 0.443, 15 | 0.30, 0.024, 17, − | ||
| Wood density (g cm−3) | 0.002, 0.896, 13 | <0.001, 0.947, 15 | 0.001, 0.923, 15 | 0.03, 0.473, 17 |
- Correlations at least marginally significant (P < 0.1) are shown in bold, and the sign of these relationships is also indicated. Note, ‘wood density’ refers to whole-stem tissue density for dry season sampling, and density of sapwood only for the wet season. a_LM/SM, allometric slope describing leaf mass allocation relative to stem mass allocation; Asat, light-saturated photosynthetic rate; gs, stomatal diffusional conductance to water; LA, leaf area; LM, leaf mass; Nmass, Narea, leaf N per mass and area; Pmass, Parea, leaf P per mass and area; SLA, specific leaf area; SM, stem mass.
In this study we were working across species with very different sizes at maturity. Consequently we chose to use absolute rather than relative growth rate as our preferred growth index, relative growth rates being strongly size-dependent (Rees et al. 2010; Iida et al. 2014), systematically decreasing with increasing plant size. By contrast, absolute growth rates are generally relatively stable across broad ranges in plant size (Prior et al. 2004, 2006).
Analyses
Ordinary least squares regression (including multiple regressions, with interaction terms) was used to quantify relationships between GR and the various plant traits. For key bivariate relationships we tested for heterogeneity among regression slopes fitted to each age-season group. Where deemed non-heterogeneous (slope test, P > 0.05) a common slope can be fitted, and whole-model explanatory power (r2) and statistical significance can be reported. All analyses were run in IBM SPSS Statistics v. 22, with the General Linear Model module used for testing slope heterogeneity and calculating descriptors of common slopes.
An additional analysis is reported in Supplementary Appendix S4. There we report results from an analysis of phylogenetically independent contrasts (PICs) calculated for GR in relation to key traits, for the wet season – adult data subset only (this subset including all 17 species, and all traits including photosynthetic rates).
Results
Sapling GR varied ca. 3-fold, from 0.37 cm year−1 (Corymbia bleeseri) to 1.0 cm year−1 (Grevillea pteridifolia), median = 0.50 cm year−1 (Appendix S3). Adult GR varied ca. 6-fold, from 0.25 cm year−1 (Persoonia falcata) to 1.56 cm year−1 (A. difficilis, for which we lacked data for saplings), median 0.42 cm year−1. Leaf-level traits (Appendix S3) varied 9-fold or less among species. By contrast, leaf mass on terminal branches varied 16-fold among species, wood mass 34-fold, and their ratio, 17-fold.
Growth rate – leaf trait relationships
Specific leaf area was unrelated to GR in any of the four comparisons (two age classes, two sampling periods; all r2 ≤ 0.03, P > 0.4; Fig. 1a, Table 2). Leaf N and P, expressed either per mass or per area, were also unrelated to GR in every case (all r2 ≤ 0.15, with most r2 ≤ 0.07, and all P > 0.14; Table 2). By contrast, Asat explained a substantial proportion of growth rate variation in adults (r2 = 0.32; P = 0.017) as well as saplings (r2 = 0.23; P = 0.071; Fig. 1b). The common fitted slope of log10GR on log10Asat was 1.0 (whole-model r2 = 0.31), indicating direct proportionality: on average, a two-fold increase in Asat corresponded to a two-fold increase in stem diameter growth rate.

Variation in Asat can be underpinned by variation in stomatal conductance to water (gs) and by the extent of CO2 drawdown during photosynthesis, indexed here via leaf δ13C. The observed GR – Asat relationships were seemingly underpinned more by variation in gs than by CO2 drawdown, gs being more consistently related to GR than was δ13C (Table 2) and relationships between Asat and gs being tighter than those between Asat and δ13C (r2 = 0.63–0.70 vs. 0.25–0.35, respectively).
Growth rate – stem trait relationships
Growth rate was unrelated to either sapwood or whole-stem tissue density (Fig. 2a; Table 2). Fractional bark allocation varied from ca. 20% to 60% by mass and was unrelated to GR in saplings, and negatively correlated with GR among adults (r2 = 0.30, P = 0.024; Fig 2b). That said, the sapling and adult slopes were deemed not significantly different from one another (slope test, P = 0.223), with the common fitted slope significantly negative (P = 0.016; model r2 = 0.21). This suggests some tendency for species with higher relative investment in bark to have slower stem diameter growth rates.

Relationships between GR and branch-scale biomass allocation
Total leaf mass was unrelated to GR in each of the four comparisons (Fig 3a; all P > 0.1). For adult plants, stem mass was negatively related to growth rate (r2 = 0.27–0.32; Fig. 3b); for saplings, no relationship was observed (Table 2). Nonetheless, the four stem mass – GR slopes did not differ significantly from one another (P = 0.731), with the common slope explaining 25% of GR variation (significantly negative, P < 0.001).

Leaf and stem mass tended to explain more variation in growth rate when considered together, rather than one at a time. LM:SM explained between 16% and 65% variation in GR, depending on plant age and season (Fig. 3c). The four GR – LM:SM regression slopes were deemed non-heterogeneous (P = 0.414), with the common fitted slope explaining 33% variation in GR (significantly positive slope, P < 0.001). The allometric descriptor a_LMSM explained between 32% and 51% variation in GR (Fig. 3d; Table 2). The four GR – a_LMSM regressions were deemed non-heterogeneous (P = 0.300), with a common fitted slope explaining 36% variation (significantly positive slope, P < 0.001).
Combined explanatory power of leaf:stem allocation and photosynthesis
To be consistent with treating photosynthetic rate (Asat) on a per area basis, for this analysis we used the ratio of leaf area to stem mass (LA:SM), rather than LM:SM. Regression models including an interaction term between Asat and LA:SM were run first. With these interactions deemed non-significant for both saplings and adults (both P > 0.2), we next ran models including main effects only. For adults, Asat and LA:SM together explained 64% of GR variation, with each variable contributing similar explanatory power (as judged by their respective F-statistics; Table 3). For saplings, the two traits explained 28% of GR variation, just a modest improvement over Asat on its own (r2 = 0.23; Table 2), and in this case the coefficient for LA:SM was non-significant and that for Asat just marginally so (Table 3).
| Variable | F | Coefficients | P |
|---|---|---|---|
| GR ~ Asat, LA:SM (interaction was never significant) | |||
| Adults (r2 = 0.64, P < 0.001, d.f. = 16) | |||
| Intercept | 29.83 | −2.53 (−3.52, −1.54) | <0.001 |
| log Asat | 11.29 | 1.12 (0.41, 1.84) | 0.005 |
| log LA:SM | 12.25 | 0.41 (0.16, 0.66) | 0.004 |
| Saplings (r2 = 0.28, P = 0.022, d.f. = 14) | |||
| Intercept | 6.945 | −1.43 (−2.61, −0.25) | 0.022 |
| log Asat | 3.261 | 0.75 (−0.16, 1.66) | 0.096 |
| log LA:SM | 0.766 | 0.10 (−0.15, 0.35) | 0.399 |
| GR ~ Asat, a_LMSM, Asat × a_LMSM (where significant) | |||
| Adults (model r2 = 0.80, P < 0.001, d.f. = 16) | |||
| Intercept | 13.36 | 6.27 (2.56, 9.98) | 0.003 |
| log Asat | 16.45 | −5.76 (−8.84, −2.69) | 0.001 |
| a_LMSM | 20.22 | −9.64 (−14.27, −5.01) | 0.001 |
| log Asat × a_LMSM | 22.44 | 8.34 (4.54, 12.14) | <0.001 |
| Saplings (model r2 = 0.41, P = 0.042, d.f. = 14) | |||
| Intercept | 5.86 | −1.15 (−2.18, −0.12) | 0.032 |
| log Asat | 1.78 | 0.53 (−0.34, 1.4) | 0.207 |
| a_LM:SM | 3.69 | 0.26 (−0.03, 0.55) | 0.079 |
For the allometric descriptor we continued to use a_LMSM (the mass-basis allometry). For adults, Asat and a_LMSM explained 80% of GR variation, in a regression model that included a highly significant, positive interaction between the traits (Table 3). This interaction term indicated that the effect of higher Asat on GR was stronger in species with higher a_LMSM, and vice versa. For saplings, the two traits explained 41% of GR variation (Table 3), just a modest improvement of a_LMSM on its own (r2 = 0.32; Table 2), and in this case the coefficient for Asat was non-significant (Table 3).
For the adult dataset these relationships were strongly influenced by A. difficilis. Re-running the analyses with this species removed, Asat and a_LMSM together still explained 57% of GR variation (multiple regression with interaction term; not shown), and Asat and LA:SM explained 34% (main effects only; not shown).
A supplementary analysis, incorporating phylogenetic information as Phylogenetically Independent Contrasts (Appendix S4), gave additional strength to our results. In those analyses also, variation in growth rate was clearly (significantly) connected to variation in leaf:stem allometry, Asat and fractional bark allocation, but not to variation in either SLA or wood density.
Discussion
Photosynthetic rate as a driver of GR variation
Light-saturated photosynthetic rate, Asat, explained roughly 30% of interspecific variation in stem diameter growth rates. This mirrors the generally positive Asat – growth rate relationship known from controlled-environment seedling studies (Kruger & Volin 2006) and older seedlings grown for 2 years in a shade house (Li et al. 2016). By contrast, there have been rather few field-based tests of GR – Asat relationships, especially for sapling or adult plants. A positive relationship has been reported across several vegetation types in northern Australia (Prior et al. 2004), from open forest in Hawaii (Stratton & Goldstein 2001), and from saplings of 53 species growing in high-light gaps within a Bolivian rainforest (Poorter & Bongers 2006). No relationship was observed among 24 savanna and forest species in Brazil (Rossatto et al. 2009).
A generally positive GR – Asat relationship makes intuitive sense, especially in high-light situations. That said, species with higher Asat could in principle deploy less total leaf area, or have higher leaf replacement costs (shorter leaf lifespan), or have higher belowground or sapwood respiration costs, and these costs could potentially cancel out the growth benefit of higher Asat. However, for both adults and saplings of the 17 species examined here this was seemingly not the case, in support of the prediction that the GR – Asat relationship does not vary with plant stature (Gibert et al. 2016).
Leaf:stem allocation as a driver of GR variation
This study represents the first test of the proposition that higher relative allocation to leaf versus stems, considered at branch level, should drive faster growth at the whole-plant level (Pickup et al. 2005). Those authors argued that higher allocation to leaf represented greater potential for photosynthetic benefits, while higher allocation to stem would incur higher costs for maintenance respiration. All else equal, a more positive carbon balance at branch-level should lead to more carbon exported to other parts of the plant, and thus faster growth (Pickup et al. 2005). Our results are consistent with this interpretation. However, as it turned out, the positive influence of leaf:stem allocation on growth rate was more strongly driven by stem allocation (which was negatively correlated with GR) than by leaf mass (which was unrelated to GR).
Higher investment in stem tissues must also have benefits, for example it may represent more biomechanical support and hydraulic supply to leaves, greater potential for water storage in sapwood and the living inner bark layers (Rosell 2016), and greater protection against fire, especially from the outer bark layers (Pausas 2014). Presumably, all of these features can be important in seasonally dry, frequently burnt savannas, such as that studied here.
No general relationship between GR and SLA for field-grown plants
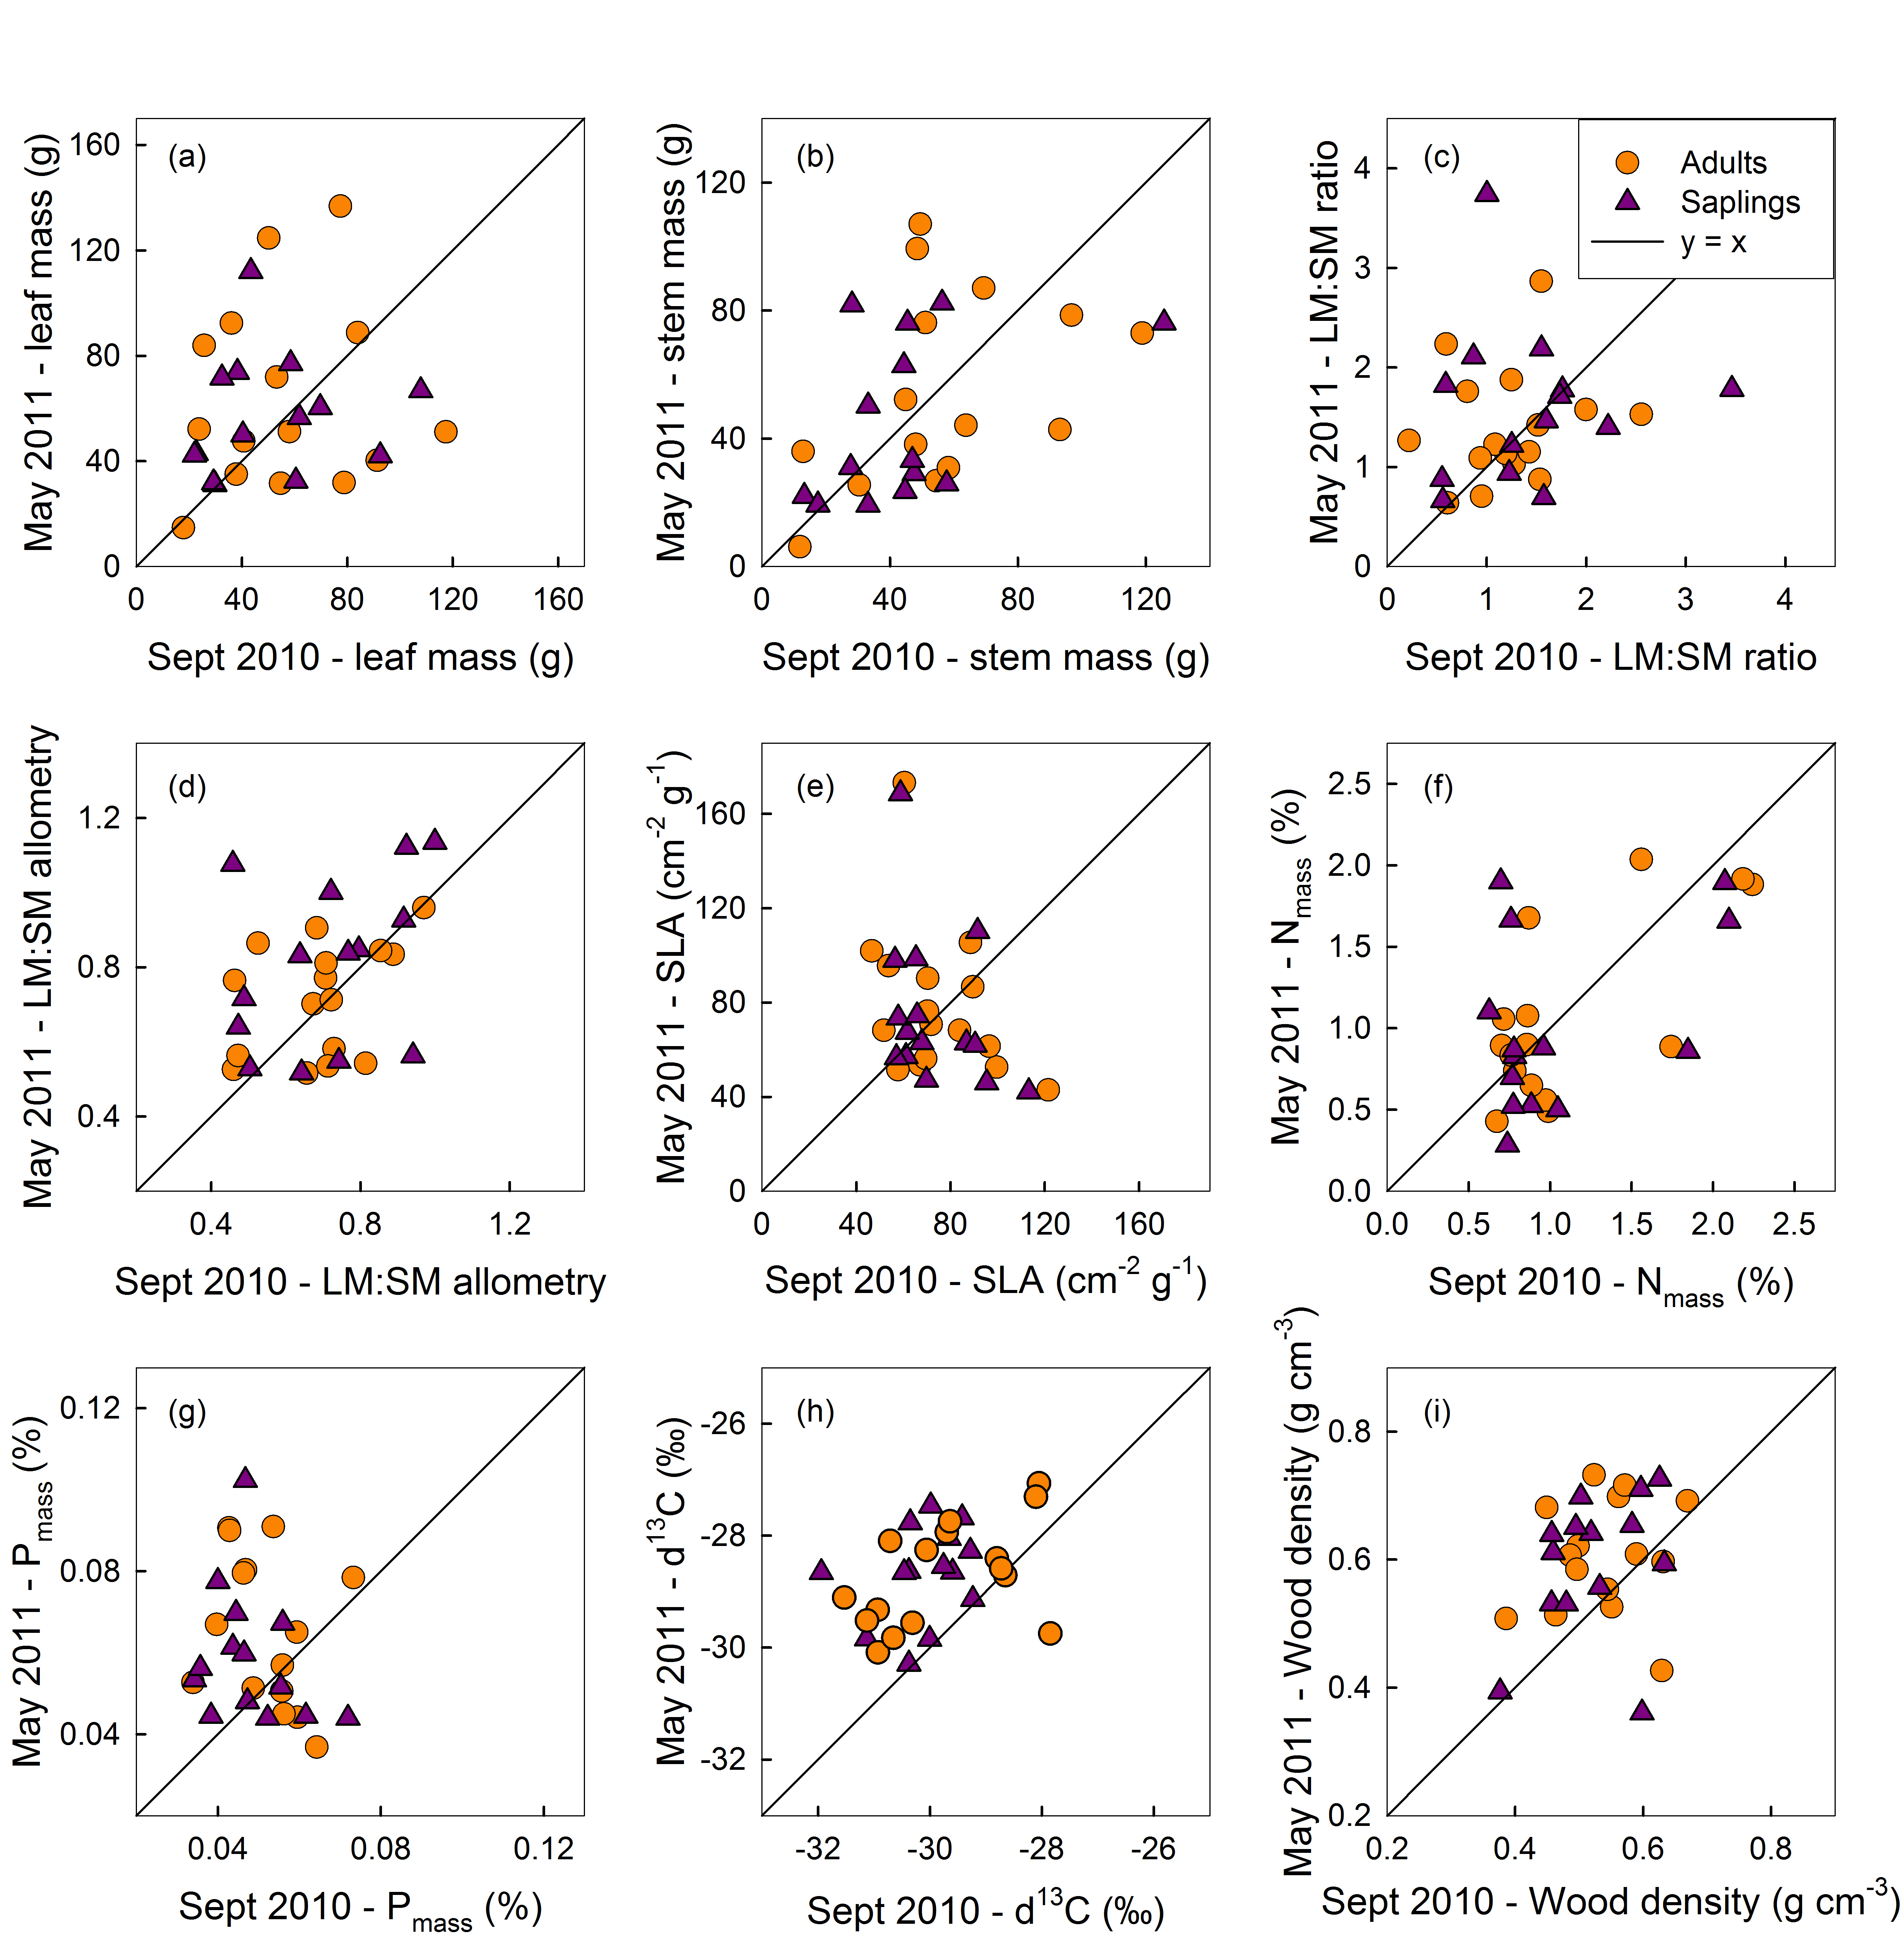
The other key finding from this study is the null result that SLA failed to explain variation in GR for either saplings or adult plants. The size-dependence of GR – SLA relationships has been investigated in several recent studies, but conclusions have varied. SLA and stem diameter growth rate were: positively correlated among Puerto Rico rainforest species, with no size-related trend in relationship strength (Lasky et al. 2015); unrelated across all size classes in a very detailed study of Panamanian rainforest species (Visser et al. 2016); unrelated across all size classes except mid-size trees (DBH = 16–18 cm) in a seasonally dry forest, Brazil (Prado-Junior et al. 2016); and positively correlated among adult rainforest trees in Taiwan, but negatively correlated among juveniles (Iida et al. 2014). Mostly these studies have focused on forests with a marked vertical light gradient and (at least partially as a result) marked shifts in leaf traits between young and old plants. Our study represents an important contrast, coming from open vegetation with little vertical light gradient, and where leaf and wood traits of saplings were indistinguishable from adults (Appendix S1).
GR unrelated to stem tissue density and leaf nutrient concentrations
Other hypotheses detailed in the Introduction receiving no support were the predictions that GR would be negatively related to WD, and positively related to leaf N and P concentrations. A negative relationship between stem diameter growth rates and trunk wood density has been reported many times (King et al. 2006; Poorter et al. 2008; Martínez-Vilalta et al. 2010; Wright et al. 2010; Iida et al. 2014; Lasky et al. 2015), although null relationships have also been reported (Russo et al. 2010). Even when statistically significant the explanatory power is generally rather low in these studies, typically <10% (but see Martínez-Vilalta et al. 2010), and sample size (number of species) is usually far higher than used here. Perhaps we lacked sufficient power to detect a relationship between growth rate and wood density, if indeed there is a general tendency for this to be true among Australian savanna species. Here we measured tissue density on terminal branches rather than main trunks; however, these properties would likely be related (Swenson & Enquist 2008), and their relationships to GR therefore similar.
Growth rates were also unrelated to leaf N and P concentrations (considered per unit leaf area or mass). Perhaps this should not be surprising since Asat was at best marginally correlated with Narea (in saplings, r = 0.46, P = 0.062) and unrelated to Parea in both age groups (P > 0.140; not shown), and the causal pathway between leaf N (and P) and GR arguably flows via their respective links to photosynthesis. Considered on a leaf mass basis, leaf N, leaf P and photosynthetic rate were all correlated with SLA (not shown). Covariation in this suite of traits can be thought of representing variation along a ‘leaf economic spectrum’ (Wright et al. 2004). Hence, the finding that all of SLA, Nmass and Pmass were unrelated to GR (Table 2) can also be taken to illustrate how strategy variation along the leaf economic spectrum does not necessarily map on to variation in growth rate of field-grown plants.
Successful growth – trait strategies
Our results help us understand the biology underpinning differences among species in their growth rates. For example, the short-lived, fire-sensitive species A. difficilis was the fastest growing species, with this high GR seemingly driven by the combination of high leaf:stem mass ratio (1.6–2.9 g g−1 depending on season; Appendix S3), low fractional allocation to bark (23%) and fast Asat (26 μmol m−2 s−1), itself associated with profligate photosynthetic water use (gs; 1087 mmol m−2 s−1). Grevillea pteridifolia seemingly achieves its fast GR by teaming high LM:SM (ca. 3.6 g g−1 in saplings, 2.4 g g−1 in adults) with medium-high Asat (18.2–19.7 μmol m−2 s−1), while Eucalyptus miniata does so by teaming very rapid Asat (ca. 25 μmol m−2 s−1) with mid-range LM:SM (1.2–1.7 g g−1). Conversely, the slow GR of adult Petalostigma pubescens was associated with the lowest mean Asat value (12.4 μmol m−2 s−1), slow gs (392 mmol m−2 s−1) and low LM:SM (ca. 1.0 g g−1). The slow GR of sapling Buchanania obovata was associated with the lowest Asat values (11.6 μmol m−2 s−1) seen for saplings, the lowest gs (301 mmol m−2 s−1), low LM:SM (0.6–0.9 g g−1, depending on season) and the highest fractional allocation to bark (60%).
That these species vary widely in stem diameter growth rate yet still co-occur indicates that there are many equally successful growth and survival strategies in this system. Of particular importance, not addressed in this study, is the need for sufficient individuals of each species to overcome the demographic bottleneck that frequent, intense fires create – the so-called sapling ‘fire trap’ (Bond 2008; Prior et al. 2010). For investigating that aspect of the growth strategy, additional data for height growth rate would be especially valuable.
Synthesis
Our results suggest that branch-level biomass allocation is a property deserving serious attention in future studies of plant growth. Here we presented two types of indices: static ratios (LM:SM, LA:SM) and an allometric descriptor (a_LMSM). Not surprisingly a_LMSM and LM:SM were correlated, but weakly enough that each variable contains considerable independent information. Besides explaining considerable variation in GR, branch-level biomass allocation also has the virtue of being easy to measure.
Together, Asat and leaf:stem deployment explained up to 41% GR variation in saplings and up to 80% in adults (57% with A. difficilis excluded). These results are remarkable given that we did not consider interspecific variation in, for example, canopy architecture, below-ground allocation, or tissue turnover rates. Of course, the extent to which these results generalize to other savannas or other vegetation types will require further study. On the face of it, one might predict lower explanatory power for these traits in vegetation types where many individuals are shaded, or where many individuals are very large (i.e. situations where the benefits of higher Asat are likely muted, and where sapwood respiration costs begin to dominate GR variation). Testing this hypothesis would be a useful next step.
Currently we lack clear demonstration (i.e. within a single empirical study) that SLA – growth rate relationships flip as predicted, from positive in small plants to null in large plants. Nonetheless we suggest that this is likely the case, given the wealth of seedling studies showing strong positive relationships and the increasing number of sapling-adult studies showing little if any relationship. Even so, it is as yet unclear at what plant size these shifts occur and whether they occur systematically earlier or later in particular light environments or vegetation types, or in plants with particular architectures or growth strategies.
That SLA is often unrelated to growth rates of field-grown plants has been disappointing for authors expecting plant functional traits to neatly explain demographic variation (Wright et al. 2010; Paine et al. 2015). Nonetheless, SLA remains a key trait for understanding leaf economic variation (Westoby et al. 2002); a key descriptor of how canopy mass interconverts with canopy light-capturing area (and thus an important property in plant growth models); and it is related to important ecological variation at other scales – for example, herbivory rates, flammability and litter decomposition rate (Poorter et al. 2009). But, it seems increasingly clear that SLA and plant growth rate are generally correlated only in very small plants, and this fact should be more widely appreciated.
Acknowledgements
We thank Mick Brand, Martina Ripcke and Ian Davidson for their enthusiasm and hard work in the field and lab; Matthew Norwood, CDU, for helping prepare equipment; Graeme Patch for organizing use of drying ovens at DPI Berrimah; Dick Williams (CSIRO Darwin) for access to the Kapalga growth rate data; Jeremy Russell-Smith (Bushfire NT) for access to the ‘Three Parks’ dataset. Saskia Grootemaat helped prepare several figures and Amy Zanne generated the phylogenetic tree. This work was made possible by funding from Macquarie University and from the Australian Research Council (DP120103284).
Author Contributions
IJW and CEL designed the study. All authors contributed to fieldwork and discussion of results. IJW analysed the data and drafted the manuscript. All authors contributed to subsequent versions.
