The HPA axis and ethanol: a synthesis of mathematical modelling and experimental observations
Abstract
Stress and alcohol use are interrelated—stress contributes to the initiation and upholding of alcohol use and alcohol use alters the way we perceive and respond to stress. Intricate mechanisms through which ethanol alters the organism's response to stress remain elusive. We have developed a stoichiometric network model to succinctly describe neurochemical transformations underlying the stress response axis and use numerical simulations to model ethanol effects on complex daily changes of blood levels of cholesterol, 6 peptide and 8 steroid hormones. Modelling suggests that ethanol alters the dynamical regulation of hypothalamic–pituitary–adrenal (HPA) axis activity by affecting the amplitude of ultradian oscillations of HPA axis hormones, which defines the threshold with respect to which the response to stress is being set. These effects are complex—low/moderate acute ethanol challenge (<8 mM) may reduce, leave unaltered or increase the amplitude of ultradian cortisol (CORT) oscillations, giving rise to an intricate response at the organism level, offering also a potential explanation as to why apparently discordant results were observed in experimental studies. In contrast, high-dose acute ethanol challenge (>8 mM) increases instantaneous CORT levels and the amplitude of ultradian CORT oscillations in a dose-dependent manner, affecting the HPA axis activity also during the following day(s). Chronic exposure to ethanol qualitatively changes the HPA axis dynamics, whereas ethanol at intoxicating levels shuts down this dynamic regulation mechanism. Mathematical modelling gives a quantitative biology-based framework that can be used for predicting how the integral HPA axis response is perturbed by alcohol.
Introduction
The hypothalamic–pituitary–adrenal (HPA) axis is a complex dynamical system that integrates the functions of the nervous and the endocrine systems by bringing together the performances of the hypothalamus, pituitary and adrenal glands through the action of steroid and peptide hormones on their corresponding receptors (Miller & Chrousos 2001; Lightman et al. 2002; Smith & Vale 2006; Russell, Kalafatakis, & Lightman 2015). The chief effector steroid hormone in humans is the glucocorticoid cortisol (CORT), but the mineralocorticoid aldosterone also plays a significant regulatory role. The most relevant peptide hormones are the corticotropin-releasing hormone (CRH) and the adrenocorticotropic hormone (ACTH). CORT exhibits both positive and negative feedback effects on the HPA axis dynamics via its action on glucocorticoid (GR) and mineralocorticoid receptors (Schulkin, Gold, & McEwen 1998; Kellendonk et al. 2002; Makino, Hashimoto, & Gold 2002). Because of the intricate interplay between these feedback mechanisms and coupling with the circadian clock system, the temporal evolution of plasma CORT concentration is complex, exhibiting ultradian (20–120 minutes) and circadian (~24 hours) oscillations (Hartmann et al. 1997; Tsigos & Chrousos 2002; Gavrila et al. 2003). Adequate oscillatory dynamics of HPA axis hormones is necessary for effective maintenance of homeostasis under normal conditions and stress (Lightman & Conway-Campbell 2010). Derangements in hormone concentrations may significantly alter the oscillatory dynamics of the HPA axis, decreasing the organism's capacity to maintain homeostasis and cope with stress (Pedersen, Wan, & Mattson 2001; Vanitallie 2002; Pfennig et al. 2005; Swaab, Bao, & Lucassen 2005; Tanriverdi et al. 2007; Heim et al. 2008; Nieuwenhuizen & Rutters 2008; Sinha 2008; Bose, Olivan, & Laferrere 2009; Chrousos, Kino, & Charmandari 2009; Bauer et al. 2010; Zhou et al. 2010; Papadopoulos & Cleare 2012; Cuevas-Ramos & Fleseriu 2014). Targeted experimental studies have for many years been unsuccessful in identifying the anatomical origin of ultradian rhythms (Walker et al. 2010). However, recent work by the Lightman group suggests that an additional level of GR autoregulation may exist within the adrenal glands (Walker et al. 2015), further strengthening the view that birhythmic oscillatory changes in blood GR levels reflect the integrated activity of pulsatile hypothalamic forcing on an endogenously rhythmic pituitary–adrenal system.
Basic features of ethanol interactions with the HPA axis have been revealed in comprehensive investigations recapitulated in recent reviews (Haddad 2004; Li et al. 2005; Heilig & Koob 2007; Allen et al. 2011; Stephens & Wand 2012). These studies have established that the primary effect of ethanol on the HPA axis is exerted through the release of CRH in the hypothalamo-pituitary portal vessels, which in turn affects the levels of other peptide hormones, including ACTH and β-endorphin (Rivier, Bruhn, & Vale 1984; de Waele & Gianoulakis 1993; Rivier 1996; Frias et al. 2002). However, consequences of these interactions on HPA axis activity are not sufficiently well understood, as contradictory results showing reduced, unaltered and increased HPA axis response are being reported (Sayette 1999; Anthenelli 2012; Becker 2012). Thus, even though ethanol is likely to be the longest known substance with psychoactive potential, purposefully produced for several thousands of years, the detailed molecular mechanisms of its action on the neuroendocrine system remain only partially understood.
Mathematical modelling is a powerful tool to investigate how biochemical processes that constitute the HPA axis are intertwined to give an integral HPA axis response at the organism level. At present, there are two distinct approaches that are used to describe the dynamical integration of biochemical pathways in the HPA axis, most recently reviewed by Hosseinichimeh et al. (Hosseinichimeh, Rahmandad, & Wittenborn 2015): the so-called delay differential equation model, where a direct time delay step between the feedforward and feedback circuitry is introduced to describe the oscillatory behaviour (Andersen, Vinther, & Ottesen 2013; Russell, Kalafatakis, & Lightman 2015, and references therein) and the stoichiometric network model, where interactions between constituents are succinctly described by stoichiometric relations and rates at which these interactions occur by the law of mass action (Jelić, Čupić, & Kolar-Anić 2005; Jelić et al. 2009; Marković et al. 2016; Marković et al. 2011b, and references therein). The principal difference between these two approaches, as we discuss in Supporting Information Section S1, lies in the fact that in a stoichiometric model the feedback loops occur naturally, as a consequence of the integration of biochemical transformations via reaction rates and the related rate constants, which describe biomolecule actions occurring on different timescales. Hence, the network's dynamics can be described by a system of ordinary differential equations (ODEs) created following a general biochemical rule and the time course of changes emulated by its numerical integration.
In the context of this study, our first aim is to concisely represent ethanol effects on the HPA axis dynamics in the form of a stoichiometric model that veritably mimics the HPA axis activity and quantitatively agrees with experimental measurements reported in the literature. We then use numerical simulations and approaches from dynamical systems theory to investigate how acute and chronic ethanol affects the integral HPA axis response. Finally, we compare model predictions with published results of clinical and experimental studies and discuss the empirical observations using insights from mathematical modelling.
Methods and Materials
Stoichiometric model of HPA axis
To describe ethanol effects on the HPA axis, we use experimental results reported in the literature (1–37) to build a stoichiometric network. Details on stoichiometric network development can be found in the Supporting Information Section S1 and in our published work (Jelić et al. 2005, 2009; Jelić, Čupić, & Kolar-Anić 2008; Marković et al. 2011b,2011a, 2016).
As a starting point for the model development here, we use the systematically optimized five-dimensional core model of the HPA axis that was previously developed by us (Marković et al. 2016). Rate constants for this model were derived by Stoichiometric Network Analysis (SNA), a general flux balance analysis method for systematic optimization of stoichiometric networks (Clarke 1988; Kolar-Anić & Schmitz 1992; Kolar-Anić et al. 1993, 2010). Stoichiometric Network Analysis was used to derive the instability conditions (Marković et al. 2016), which were then used together with experimentally measured amplitude and frequency of ultradian oscillations to identify the narrow range of kinetic parameters, i.e. rate constants where oscillations in hormone concentrations occur in physiologically relevant levels (Clarke 1988; Kolar-Anić & Schmitz 1992; Kolar-Anić et al. 1993, 2010; Čupić & Kolar-Anić 1999a, 1999b; Čupić et al. 2011; Marković et al. 2016). 1
In order to describe diurnal regulation, an external forcing function (D) was introduced to emulate the coupling between circadian and ultradian rhythms (as described in Supporting Information Section S1). Details on how this function was derived to describe the asymmetry of the 24-hour rhythm in humans can be found elsewhere (Marković et al. 2011b,2011a).
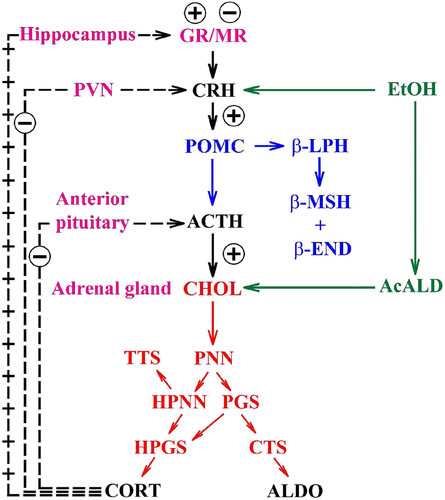
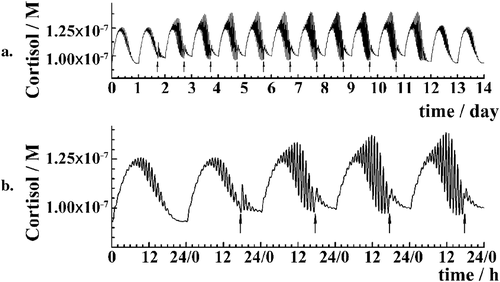
Thereafter, the core model (Fig. 1, magenta/black) is extended to include key steps in proopiomelanocortin processing (Fig. 1, blue), adrenal steroidogenesis (Fig. 1, red) and reactions that epitomize ethanol effects on the HPA axis (Fig. 1, green). Key HPA axis constituents considered in the model and feedback loops between them are schematically depicted in Fig. 1. Interactions between the considered components (Fig. 1) are represented in the form of stoichiometric relations (Table 1). Of note, relations (R1)–(R33) are not elementary reactions but rather summarized outcomes of complex biological pathways concisely written in the form of stoichiometric relations. This allows us to describe the rates of underlying interactions by a system of ODEs based on the law of mass action (Supporting Information Table S1). Rate constants derived for the five-dimensional core model of HPA axis dynamics by systematic optimization (Marković et al. 2016) were used here as initial values. Subsequently, all parameters were individually adjusted to obtain by numerical integration hormone levels that are in the physiological range (Supporting Information Table S2). The thus derived model mimics the complex daily variation in CORT levels in humans (Fig. 2a), correctly predicts the phase shift between ACTH and CORT (Supporting Information Fig. S1) (Lightman & Conway-Campbell 2010) and the ‘inverted U response’ of HPA axis activity to GRs (Supporting Information Fig. S2) (Kellendonk et al. 2002; Lightman & Conway-Campbell 2010).
 |
k1 = 3.31 × 10⁻⁴ M/minute | (R1)* |
 |
k2 = 8.78 × 10⁻⁸ M/minute | (R2)* |
 |
k3 = 1.46 × 10⁻¹⁰ M/minute | (R3) |
 |
k4 = 2.20 × 10⁴/minute | (R4) |
 |
k5 = 2.40 × 10²/minute | (R5) |
 |
k6 = 2.40 × 10²/minute | (R6) |
 |
k7 = 7.61 × 10¹⁸ M−1/minute | (R7)* |
 |
k8 = 1.90 × 10¹⁰ M−1/minute | (R8) |
 |
k9 = 15.47/minute | (R9)* |
 |
k10 = 7.70/minute | (R10) |
 |
k11 = 3.70 × 10⁻²/minute | (R11) |
 |
k12 = 2.30 × 10⁻²/minute | (R12) |
 |
k13 = 2.50 × 10⁻¹/minute | (R13) |
 |
k14 = 2.50 × 10⁻¹/minute | (R14) |
 |
k15 = 2.40 × 10⁻¹/minute | (R15) |
 |
k16 = 1.00 × 10⁻⁴/minute | (R16) |
 |
k17 = 3.02 × 10¹² M−2/minute | (R17) |
 |
k18 = 1.69 × 10¹³ M−2/minute | (R18)* |
 |
k19 = 7.20 × 10¹⁰ M−1/minute | (R19) |
 |
k20 = 6.00 × 10⁸ M−1/minute | (R20) |
 |
k21 = 1.28 × 10³/minute | (R21)* |
 |
k22 = 8.10 × 10⁻¹/minute | (R22) |
 |
k23 = 2.40 × 10³/minute | (R23) |
 |
k24 = 2.40 × 10⁴/minute | (R24) |
 |
k25 = 1.10 × 10⁻¹/minute | (R25) |
 |
k26 = 9.80 × 10⁻²/minute | (R26) |
 |
k27 = 1.30 × 10⁻³/minute | (R27) |
 |
k28 = 2.60 × 10⁻²/minute | (R28) |
 |
k29 = 1.20 × 101/minute | (R29) |
 |
k30 = 1.00 × 10⁻³/minute | (R30) |
 |
k31 = 2.50 × 10⁻⁷/minute | (R31) |
 |
k32 = 5.00 × 10⁻³ M−1/minute | (R32) |
 |
k33 = 1.00 × 10⁻¹/minute | (R33) |
- Reaction steps (R1)–(R29) epitomize complex biochemical pathways that comprise the HPA axis. Reaction steps (R30)–(R33) give a concise representation of ethanol effects on the HPA axis. Asterisk indicates reaction steps for which high precision rate constants are needed.
Modelling ethanol effects on the HPA axis
To model ethanol (EtOH) effects on the HPA axis dynamics, the set of relations describing the HPA axis dynamics [Table 1, (R1)–(R29)] is augmented by relations that succinctly describe the effects of ethanol and the primary ethanol metabolite acetaldehyde (AcALD) on the HPA axis [Table 1, (R30)–(R33)]. Relation (R30) describes the well-established ethanol-induced release of CRH (Rivier et al. 1984; de Waele & Gianoulakis 1993; Rivier 1996; Frias et al. 2002), and (R31) describes ethanol metabolism in the liver to AcALD (Salaspuro & Lieber 1978; Rangno, Kreeft, & Sitar 1981; Lands 1998). Relation (R32), which describes the direct effect of AcALD on the adrenals causing a reduction of adrenal cholesterol content and corticosterone secretion (Cobb & Van Thiel 1982), is represented here as an acceleration of the first step of steroidogenesis. Relation (R33) represents AcALD elimination. Ethanol eliminated through excretion, which is the main route for fast elimination, was not considered because ethanol elimination via urine is delayed, typically occurring 20–40 minutes after consumption, whereas metabolic degradation commences instantaneously after ethanol intake.
Numerical simulations
Numerical simulations were performed using the MATLAB ode15s solver that is based on the Gear algorithm for integration of stiff differential equations (Gear 1971). Absolute and relative error tolerance values were 1 × 10⁻²⁰ and 1 × 10⁻¹⁴, respectively. The model was integrated with stricter tolerances in order to minimize numerical artefacts, but the same dynamical behaviour was observed using values of 1 × 10⁻⁹ and 3 × 10⁻⁶.
Concentrations of all reaction species are expressed in moles per cubic decimetre (mol/dm3 = M). Initial conditions for the integration of ODEs in all numerical simulations are given in Supporting Information Table S3. Parameters in the circadian rhythm function D were d1 = 0.3025 and d2 = 1.0. Some rate constants critically affect the HPA axis dynamics, requiring a larger number of significant figures, whereas others do not. For uniformity, the same number of digits is used for all rate constants, but the trailing zeroes do not imply a high sensitivity to variations in the parameter.
When HPA axis dynamics was modelled under normal physiological conditions, the concentrations of ethanol and AcALD were set to zero, signifying that ethanol and its metabolite were not present (Fig. 2a). Consequently, the rates of steps (R30)–(R33) were equal to zero under normal physiological conditions, and there are 17 dynamical variables in the model. When an ethanol challenge is included, their number is 19.
To simulate the effect of acute perturbations with ethanol, numerical integration of the system of ODEs (Supporting Information Table S1) was stopped at a specified time point and new initial conditions for subsequent integration were defined. For the new initial conditions, ethanol concentration was specified while concentrations of all other species retained their previously attained values. Ethanol concentrations used in numerical simulations range from 0 to 250 mM, which is a pharmacologically relevant range. The concentration of 21.7 mM ethanol is equal to blood alcohol content (BAC) of 0.1 percent by volume or 0.094 percent by weight. To facilitate better orientation, a ‘standard drink’, i.e. 30 ml of strong liquor (40 percent) would yield immediately after consumption a BAC of 0.022 percent = 5.2 mM in a women of 60 kg and a BAC of 0.016 percent = 3.5 mM in a man of 85 kg. The time that is required for metabolizing these amounts of ethanol is about 2.2 and 1.6 hours, respectively. All values were calculated using the BAC calculator http://celtickane.com/projects/blood-alcohol-content-bac-calculator/ (last time accessed on 4 February 2016).
Chronic alcohol use was modelled by keeping the concentration of ethanol constant at an indicated level, mimicking habitual levels of ethanol in the blood circulation maintained by persistent drinking.
Results
Ethanol induces opioid surfeit
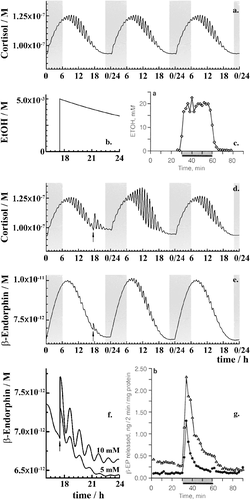
Complex daily variation in plasma CORT levels obtained by numerical integration for normal physiology, i.e. without any ethanol, is shown in Fig. 2a. Acute ethanol challenge (Fig. 2b, vertical line) is immediately followed by metabolic degradation, through which ethanol concentration gradually decreases (Fig. 2b, decay curve). An experimental ethanol pulse, where ethanol concentration in the perfusion chamber was measured (de Waele & Gianoulakis 1993), is shown in Fig. 2c. Following the instantaneous change in ethanol concentration, levels of all species in the model adjust accordingly, exemplified here by CORT (Fig. 2d) and β-END (Fig. 2e) time series. The β-endorphin surfeit predicted by mathematical modelling is proportional to the intensity of ethanol challenge (Fig. 2f). The time needed for HPA axis to restore its dynamics is in agreement with the experimental measurements (Fig. 2g) (de Waele & Gianoulakis 1993). In summary, we show in Fig. 2 that the model veritably mimics several important experimental observations by de Waele and Gianoulakis (de Waele & Gianoulakis 1993), most notably that the sharp increase in ethanol levels (Fig. 2b and c) induces a sharp increase in β-endorphin (Fig. 2f and g); that increase in β-endorphin levels is proportional to the intensity of ethanol challenge (Fig. 2f), which was also observed experimentally (de Waele & Gianoulakis 1993), and that the time needed for the HPA axis to return to its original P experimental studies, at the 0.5–1.5 hours timescale.
Ethanol effects on the HPA axis dynamics are inherently complex
HPA axis response to acute perturbations with ethanol is complex, critically depending on the state of the HPA axis, i.e. the phase of circadian and ultradian oscillations, and the intensity of ethanol challenge (Fig. 3). Amplitudes of ultradian CORT oscillations during the active phase (daytime for humans) and the rest phase (night) are different (Fig. 2a), and an ethanol challenge of the same intensity will give rise to dissimilar HPA axis responses depending on whether it was applied during daytime (Fig. 3a–c) or at night (Fig. 3e–h).
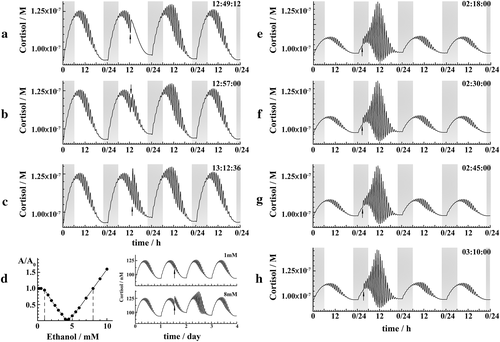
For perturbations with ethanol applied during daytime, the HPA axis response depends critically on the phase of the ultradian oscillation (Fig. 3a–c) and the amount of ethanol used (Fig. 3d). When the same amount of ethanol is used at slightly different time points during the day, the amplitude of ultradian HPA axis oscillations may be dampened (Fig. 3a), remain the same (Fig. 3b) or increase (Fig. 3c).
When ethanol is used at night, the amplitude of ultradian oscillations during the following day will increase irrespective of the ultradian phase at which they were applied (Fig. 3e–h). This behaviour arises because the amplitude of ultradian oscillations is small during the night (Fig. 3, shaded area). Hence, the dose that barely affects ultradian oscillations during the day is simply too high when applied at night. If a small dose of ethanol would be used, adjusted to the amplitude of ultradian oscillations during the night, the same complex behaviour would be observed at night as during daytime (Fig. 3a–c).
The effect of high-intensity ethanol challenge is long lasting
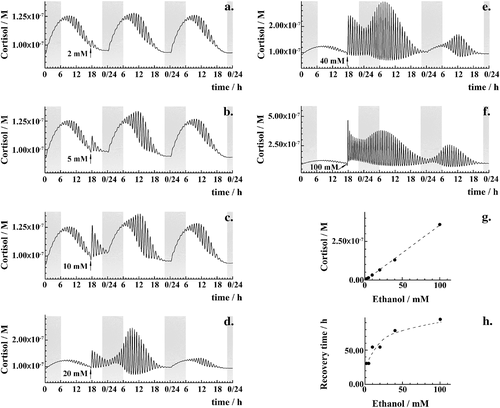
Acute ethanol challenge of different intensities (2–100 mM) used always at the same time, 5:30 PM (the usual ‘happy hour’ time in many Western countries), shows that the HPA axis response is linearly proportional to the ethanol dose (Fig. 4a–g). The time needed for the HPA axis to return to its original rhythmic pattern also correlates with the ethanol dose. However, this relationship is not linear but rather levels off, taking about 4 days after an intense ethanol challenge (Fig. 4h).
Recurrent ethanol use gives rise to cumulative effects and a blunted HPA axis response
Recurrent ethanol challenge, modelled as a series of single doses used once a day during 10 days, shows that ethanol effects are cumulative when the time between two successive challenges is shorter than the time required for the HPA axis to restore its basal rhythmicity (Fig. 5a). Furthermore, the immediate response of the HPA axis to the second ethanol challenge is smaller than the effect that was induced by the first one, as evident from the smaller shift in CORT levels that is observed after the second challenge as compared with the effect that was caused by the first one (Fig. 5b).
Chronic ethanol use qualitatively alters the HPA axis dynamics
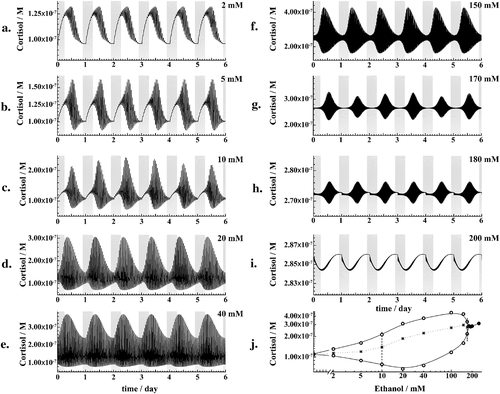
Chronic exposure to ethanol gives rise to complex transformations in the HPA axis dynamics (Fig. 6). Small amounts, [EtOH] ≤ 2 mM, increase somewhat the amplitude of ultradian oscillations but do not affect the general HPA axis rhythmicity (Fig. 6a). As ethanol levels increase, the amplitude of ultradian oscillations continues to increase (Fig. 6b) giving rise to non-periodic large-amplitude oscillations (Fig. 6c). Further increase in chronic ethanol levels gives rise to large-amplitude ultradian oscillations also during the night (Fig. 6d and e). As chronic ethanol levels increase even further, the amplitude of ultradian oscillations starts to decrease, but the mean daily level of CORT and the frequency of ultradian CORT oscillations continue to increase (Fig. 6f–h). Eventually, at [EtOH] = 200 mM, the dynamic ultradian regulation is being lost and the circadian regulation is ‘overpowered’. Consequently, CORT levels reach maximum values around midnight, at the beginning of the rest phase (Fig. 6i) instead of in the morning, as in normal physiology (Fig. 2a).
Discussion
The effect of low-intensity acute ethanol challenge is dose- and phase-dependent
Mathematical modelling reveals an intricate effect of ethanol on the stress axis. It shows that acute ethanol differently affects the HPA axis dynamics, depending on the amount of ethanol used and on the time of use (Fig. 3). The HPA axis response is complex, and different responses can be observed for low, moderate and high ethanol concentrations. The classification into low (<1 mM), moderate (1 – 8 mM) and high (>8 mM) ethanol concentrations is not arbitrary, but rather related to the amplitude of ultradian oscillation at the moment of ethanol use. 1
In order to scrutinize this dynamical regulatory mechanism experimentally, the HPA axis dynamics needs to be monitored with sufficiently high temporal resolution. Experimental and clinical studies usually measure CORT levels at one or at a few time points during the day. Ultradian pulsatility of CORT levels is not routinely monitored because high sampling frequency is required, which is rather stressful for the patient/experimental animal. Hence, there are a handful of studies where ultradian oscillations in the concentration of HPA axis hormones were systematically measured at high temporal resolution (Carnes et al. 1988; Gronfier & Brandenberger 1998; Charloux et al. 1999; Schulz, Curtin, & Steimer 2007; Beaven et al. 2010; Lightman & Conway-Campbell 2010; Conway-Campbell et al. 2012; Bhake et al. 2013). Recent progress in the development of instrumentation for rapid sampling (Bhake et al. 2013) and rapid quantitative analysis (Tahara et al. 2014) of HPA axis hormones will allow such detailed characterization of HPA axis behaviour in the future. At present, we can only rely on empirical studies where apparently contradictory HPA axis response to ethanol was observed – rises in CORT levels in non-alcoholic subjects with low blood alcohol levels were reported in Jenkins & Connolly (1968), whereas no activation of the HPA axis was reported in Inder et al. (1995). These results may only appear to be discordant. Instead, they may actually reflect the complex HPA axis response to ethanol.
Brief cessation of ultradian oscillations (Fig. 3a) reflects an instantaneous, but short-lasting loss of ultradian regulation. In the model, this is consistent with a temporary exacerbated response to stress—as the amplitude of ultradian oscillations becomes vanishingly small, the stress response threshold is shifted towards lower values and the stimuli that would otherwise induce a negligible change in the HPA axis dynamics will now cause a more pronounced effect. Conversely, an increase in ultradian amplitudes (Fig. 3c) is consistent with lower sensitivity to external stimuli.
It is not easy to relate the outcome of mathematical modelling with behavioural observations, but there are numerous behavioural studies where the complex relationship between alcohol and stress was investigated. These studies, recently reviewed in Kudielka, Hellhammer, & Wust (2009). Stephens & Wand (2012), Spanagel, Noori, & Heilig (2014) and Zhou & Kreek (2014), show apparently inconsistent results: reporting that alcohol consumption diminishes, does not affect or increases the response to stress. In the light of numerical results presented in Fig. 3, it is perhaps not so surprising that apparently disparate behaviour was observed.
When ethanol is consumed during the rest phase, including early morning hours (before 6 AM), even very low amounts of ethanol will increase the amplitude of ultradian CORT oscillations during the forthcoming active phase of the day (Fig. 3e–h). In the model, as we have discussed earlier, an increase in ultradian amplitudes is consistent with lower sensitivity to external stimuli. This, in turn, may explain why a small drink in the morning is positively perceived by many, as the somewhat increased amplitude of ultradian oscillations during the upcoming active phase of the day may improve the individual's ability to cope with stress. Again, we underline that it is not straightforward to relate model predictions with behavioural state modulation, but we would like to highlight the connection between the HPA axis dynamics and possible behavioural traits that can be observed at the organism level.
In summary, mathematical modelling suggests that the complex HPA axis response to ethanol arises because of the innate non-linearity of biochemical interactions. At a first glance, this complex behaviour, which defies our intuition, may appear to be random. However, in the model it is defined by deterministic mechanisms and reflects special properties of non-linear dynamical systems when they are found in the vicinity of a critical point that is called supercritical Hopf bifurcation 2 (Jelić et al. 2009; Marković et al. 2011b). The proximity to a supercritical Hopf bifurcation has important physiological consequences—in the vicinity of a supercritical Hopf bifurcation dynamical transitions are ‘soft’ and reversible, giving the HPA axis its capacity to adjust its dynamics in response to external stimuli and return to the original state afterwards, which is the essence of homeostasis. For comparison, special properties of dynamical systems in the vicinity of another type of bifurcation point are briefly discussed in Supporting Information Section S2 and in Čupič et al. 2016. To our best knowledge, phase-dependent behaviour was not experimentally observed for ethanol. However, ultradian phase-dependent stress responsiveness was noticed by Conway-Campbell and Lightman, who observed that ‘rats that were stressed during the rising phase of an endogenous corticosterone pulse showed much greater corticosterone responses than animals that were stressed during a falling phase’. (Lightman & Conway-Campbell 2010) (Fig. 2).
The effect of high-intensity acute ethanol challenge is dose-dependent but not phase-dependent
Mathematical modelling clearly shows that HPA axis response to low-intensity acute ethanol challenge is different from its response to high-intensity acute ethanol challenge (Figs. 3 and 4). While the effect of low-intensity acute ethanol challenge is phase-dependent (Fig. 3), the effect of acute high-intensity ethanol challenge is not (data not shown). Differences in HPA axis responsiveness to low- and high-intensity acute ethanol challenge arise as a consequence of the underlying kinetics and special properties of the proximity to a supercritical Hopf bifurcation. When ethanol challenge is of low intensity, it induces a small production of CRH, which eventually leads to the production of a small additional amount of CORT. If the amount of produced CORT is smaller than the amplitude of ultradian CORT oscillations and the HPA axis is in a phase when CORT -producing pathways prevail, the amplitude of CORT oscillations will increase more in the presence of ethanol than if the system would not have been perturbed. Hence, an increase in the CORT oscillation peak, i.e. increased amplitude would be observed. If, on the other hand, a small additional amount of CORT is produced during a phase when CORT-degrading pathways prevail, an additional amount of CORT would need to be degraded and the CORT oscillation would not reach the same trough as when unperturbed. Hence, a decrease in the ultradian oscillation of CORT amplitude would be observed. In contrast, when a large amount of CORT is produced as a consequence of high-intensity acute ethanol challenge, i.e. heavy acute ethanol consumption, CORT levels will become significantly higher, and the difference because of the phase angle becomes negligible. This large excess of CORT needs to be consumed before the dynamical control mechanism around a supercritical Hopf bifurcation can be reinstated. Hence, the time that is needed to consume the excess CORT is proportional to the amount of ethanol used, i.e. to the amount of CORT produced, and the phase dependence of HPA axis response to high-intensity acute ethanol challenge is not observed.
Thus, acute high-intensity ethanol challenge perturbs the HPA axis dynamics in a dose-dependent manner and the time that is required for the HPA axis to regain its normal dynamics is proportional to the amount of ethanol used (Fig. 4). The model predicts that HPA axis recovery to physiological rhythms may take several days after heavy ethanol use (Fig. 4h), which is in agreement with clinical studies showing that CORT levels after heavy drinking return to normal values approximately within one week of abstinence (Adinoff et al. 1991).
Blunted HPA axis response
Mathematical modelling shows that CORT increase immediately after the second ethanol dose is comparably smaller than the CORT increase after the first one (Fig. 5), consistent with experimental observations showing that exposure to ethanol decreases the ability of HPA axis to respond to the second ethanol challenge (Lee & Rivier 1997; King et al. 2006; Richardson et al. 2008). This phenomenon, known as the blunted HPA axis response, is regarded to be characteristic of neuroendocrine tolerance (Ogilvie, Lee, & Rivier 1997). Mathematical modelling suggests that it arises in the following way—as the first ethanol dose increases the amplitude of ultradian oscillations (Fig. 5a), the sensitivity of the HPA axis to subsequent challenges decreases (Supporting Information Section S2). Hence, the same challenge can no longer activate the HPA axis to the same extent and a blunted response is observed (Fig. 5b).
Allostatic states in chronic ethanol exposure
Mathematical modelling shows that the global HPA axis dynamics is different in chronic alcoholic states of different degrees of severity (Fig. 6). Under normal, alcohol-free physiology, the amplitude of ultradian CORT oscillations is typically smaller than the amplitude of circadian variation in CORT levels (Fig. 2a), although individual exceptions exist (Bhake et al. 2013). In chronic alcoholic states, where ethanol levels in the blood circulation are low (2 mM), the amplitude of ultradian oscillations is somewhat larger than in the alcohol-free state, but it is still smaller than the amplitude of the circadian fluctuation (Fig. 6a versus Fig. 2a). Because an individual is more resilient to stress when the amplitude of ultradian oscillations is not too small, and ethanol increases the ultradian amplitude, this may be the reason why ‘functional alcoholics’, individuals who are alcohol-dependent and regularly drink but perform well and rarely miss obligations because of their drinking, feel more stress-free and function better under the continuous influence of low doses of alcohol.
As chronic ethanol levels increase (5 mM), the amplitude of ultradian CORT oscillations becomes very large, larger even than the amplitude of circadian CORT variation (Fig. 6b). However, this is no longer protective because the stress-response threshold is now too high and the stress-response mechanism will not be activated by stimuli which should normally activate it. Dynamical states, where the threshold for HPA axis activation becomes too large, may be related with reckless behaviour and impaired perception of danger, behavioural traits that are typically observed in inebriate states.
Further increase in chronic alcohol levels (10 mM) gives rise to a chaotic dynamical state, characterized by complex changes in the amplitude of ultradian CORT oscillations and, consequently, in apparently random changes in the stress-response threshold from one moment to the other (Fig. 6c and g). It is tempting to speculate, although there are no experimental evidence for this, that chaotic dynamical states, where the amplitude of ultradian oscillations changes randomly, may be associated with behaviours that are perceived by others as unpredictable and usually described as moodiness, frivolousness or whimsicalness.
As chronic ethanol levels further increase, 10 mM < [EtOH] ≤ 40 mM, the amplitude of ultradian oscillations increases and ultradian CORT oscillations are observed around the clock, even during the rest phase (Fig. 6d and e). Further increase in chronic ethanol levels, 40 mM < [EtOH] ≤ 180 mM, reverses the change in the amplitude of ultradian and circadian CORT oscillations, which now decreases and the circadian regulation becomes overpowered (Fig. 6f–h). Such HPA axis dynamics is consistent with symptoms such as irritability and sleep pattern disturbance, which are typical in heavy alcoholics (Escobar-Cordoba, Avila-Cadavid, & Cote-Menendez 2009; Seggio et al. 2009; Wallen et al. 2014).
Eventually, dynamical regulation via ultradian and circadian mechanisms is being lost (Fig. 6i). Ultradian oscillations no longer appear, and CORT levels peak around midnight, whereas a nadir is observed early in the morning, which is exactly opposite from normal physiologic behaviour (Fig. 6i versus Fig. 2a). The capacity of the HPA axis to quickly and precisely adjust the levels of hormones in response to stimuli from the surroundings ceases to exist. This qualitative change in the HPA axis dynamics was observed in the model at concentrations that correspond to lethally toxic levels of ethanol.
The orbit diagram (Fig. 6j) gives a condensed representation of how CORT levels change in chronic ethanol exposure, in agreement with experimental observations (Gianoulakis, Dai, & Brown 2003). It shows that high chronic alcohol levels move the system away from the supercritical Hopf bifurcation point and reveals different dynamical states that the HPA axis acquires as the concentration of ethanol chronically increases. These dynamical states represent allostatic states, defined by Koob and Le Moal as ‘states of chronic deviation of the regulatory system from its normal (homeostatic) operating level’ (Koob & Le Moal 2001; Zorrilla, Logrip, & Koob 2014).
Conclusions and Future Perspectives
Mathematical models are useful tools to understand and predict the behaviour of complex biological systems. In this study, we have used a stoichiometric network approach to succinctly describe the integration of complex biochemical processes underlying the HPA axis and predict the integral HPA axis response to ethanol. Model predictions were compared with empirical results reported in the literature in order to ascertain that the model veritably replicates properties of the real system. In particular, the model predicts complex daily variations in the blood levels of cholesterol, 6 peptide and 8 steroid hormones; accounts correctly for the well-established phase shift between ACTH and CORT; mimics the dual actions of CORT, which based on the concentration may act stimulatory or inhibitory; and correctly predicts the HPA axis immediate response to ethanol challenge and the recovery time after drinking.
Even though quantitative agreement with real experiments is achieved, one should always bear in mind that analysis of mathematical model predictions reflects properties of the model, and not necessarily properties of the real system. Despite this limitation, which is innate to all mathematical models, our approach to model ethanol effects on the stress response system represents a significant step forward to develop a quantitative biology-based framework for understanding how the integral function of the stress response axis is affected by ethanol. Given the high degree of agreement between model predictions and real experiments that is achieved, the model can be used as a tool for designing experimental protocols, for verifying the interpretation of experimental results and to explore reverse transitions in order to understand how the HPA axis dynamics is affected in abstinence from alcohol use. The stoichiometric model of HPA axis developed here is also of more general bearing, as it can be used to study in silico the dynamical integration of biochemical pathways and its disruption in neuroendocrine diseases and common neuropsychiatric disorders where the HPA axis function is impaired, such as anorexia, PTSD, depression and bipolar disorders, and in substance abuse most generally.
Acknowledgements
Support from the Karolinska Institute Research Funds, the Swedish Research Council, the Knut and Alice Wallenberg Foundation, the Rajko and Maj Đermanović Fund, CMST COST Action CM 1304 ‘Emergence and Evolution of Complex Chemical Systems’ and the Ministry of Education, Science and Technological Development of the Republic of Serbia, grants 172015 and 45001, is gratefully acknowledged.
Conflict of Interests
None
Authors Contribution
VV, LT, LjK-A and ŽC, have conceived the work; mathematical model development (ŽC, VV); numerical simulations (ŽC, AS, VMM). All authors have contributed to the interpretation of the results, drafting the article and revising it critically for important intellectual content.
References
- 1 Depending on the size of the mathematical model and its intrinsic properties, the instability conditions derived by Stoichiometric Network Analysis may or may not yield a unique set of solutions for all rate constants. In the latter case, other experimentally measured quantities, such as the amplitude and frequency of oscillations (in this case ultradian oscillations) and the half-life of reactive species (in this case HPA axis hormones), are also considered in the model optimization.
- 1 The amplitude of ultradian oscillations defines in the concentration phase space the maximum distance from the non-stable stationary state from which it has originated. This distance is an internal reference point for the stress-response system (see Supporting Information S2 and (41–43) for details).
- 2 Supercritical Hopf bifurcation is the simplest type of transition from a stationary to an oscillatory state (See Supporting Information Section S2 for more details).


