Dedicated MRI simulation for cervical cancer radiation treatment planning: Assessing the impact on clinical target volume delineation
Abstract
Introduction
Magnetic Resonance Imaging (MRI) provides excellent soft tissue definition of pelvic tumours and organs. The aim of this study was to quantify differences in delineated clinical target volumes (CTVs) between computed tomography (CT) and MRI.
Methods
Twenty patients with locally advanced gynaecological malignancies were recruited. Patients underwent dedicated MRI simulation following CT simulation. Four clinicians independently contoured each CT and MRI. CTV structures were contoured using the Radiation Therapy Oncology Group (RTOG) guidelines and lymph node CTV (LN-CTV) according to published guidelines. Interobserver variability was analysed using the dice similarity coefficient (DSC) and mean absolute surface distance (MASD).
Results
Gross tumour volume delineation was more consistent on MRI compared to CT, the DSC improved from 0.77 on CT to 0.81 on MRI, P < 0.01. GTV volumes were significantly smaller on MRI compared to CT (MRI 92 cc vs. CT 117 cc, P < 0.01). The LN-CTV and combined CTV volumes were both significantly smaller on MRI compared to CT (LN-CTV: MRI 324 cc vs CT 354 cc, P < 0.01 and combined CTV: MRI 560 cc vs CT 600 cc, P < 0.01). The LN-CTV DSC was 0.75 for both MRI and CT, and the combined CTV DSC was 0.81 for MRI and 0.80 for CT, P = 0.27. Vagina and parametria volumes exhibited more variability compared to other structures.
Conclusions
Magnetic Resonance Imaging contouring resulted in smaller and more consistently delineated volumes when compared to CT for most CTV structures. An MRI contouring atlas is provided to complement the existing RTOG contouring guidelines.
Introduction
Accurate delineation of treatment volumes for radiotherapy is a crucial step in radiation treatment, but can be associated with considerable uncertainty and variability. If the incorrect volume is delineated this will result in a geographical miss1 and a systematic error that is carried out through the entire treatment.2
Target volume uncertainty of potential centimetres may overshadow the millimetre accuracy associated with planning and delivery of radiation.3 Delivery of radiotherapy is highly accurate, uncertainty associated with modern radiotherapy is usually <3% of the dose prescribed and geometric uncertainty is usually within 3 mm.4 In contrast, variability associated with cervical cancer target volumes are potentially of a larger magnitude compared to other uncertainties; a study of cervical cancer target volumes showed a distance between contours of up to 30–40 mm.5, 6
Magnetic resonance imaging (MRI) for cervical cancer provides excellent soft tissue definition and visualisation of pelvic pathology and organs, which has resulted in MRI having an established role as a staging investigation for cervical cancer.7, 8 MRI has also been shown to improve outcomes when it is used for image guided adaptive brachytherapy.9 However, there is a paucity of information as to its role and whether improved soft tissue definition results in improved and more consistent target delineation compared to CT imaging for external beam radiotherapy. The aim of this study was to assess volume delineation for external beam radiotherapy following MRI simulation compared to the current standard of care, CT delineation.
Methods
Study population
The study prospectively recruited 20 adult patients with Stage IB-IV cervical or endometrial cancer with a macroscopic pelvic tumour, undergoing primary radiation therapy. Patients were recruited from Liverpool Cancer Therapy Centre and Macarthur Cancer Therapy Centres in Sydney, Australia. Patients were excluded if they had any contraindication for MRI. Patients received standard radiotherapy for their malignancy as per their treating radiation oncologist.
Imaging for radiotherapy planning
All patients underwent a planning CT scan in the treatment position (‘CT-SIM’) on a Philips Brilliance Big Bore CT simulator (Phillips Medical Systems, The Netherlands). The CT scan was from at least L5 to perineum with a 2 mm slice thickness. Contrast (IV or oral) and a vaginal marker were used at the discretion of the treating radiation oncologist. To ensure a consistent bladder volume for the scans and treatment, patients underwent a bladder filling protocol prior to the planning CT.
An MRI in the treatment position was obtained for all patients (‘MRI-SIM’). The MRI scans were acquired on a 70 cm bore MAGNETOM Skyra 3T (Siemens Medical Systems, Erlangen, Germany) scanner with a flatbed tabletop, an 18-channel body coil was positioned across the patient's pelvic region. Patients were set up in the same position as they were for their planning CT and underwent the same bladder filling protocol they completed prior to the CT.
The MR sequence obtained for each patient was a 2D axial T2-weighted turbo-spin echo (TSE) with 2 mm slices using a single concatenation; this was optimised for radiotherapy planning with an MRI physicist. The field of view extended from L5 to perineum.
Delineation process
Four radiation oncologists with experience in treating cervical cancer patients contoured both CT and MRI data sets for the study, one clinician contoured ten patients and three clinicians contoured all twenty patients. Positron emission tomography (PET) data sets were fused separately to both the CT and MRI. Prior to contouring for the study, all clinicians underwent an educational session on MRI contouring for cervical cancer conducted by a pelvic radiologist.
For each study patient, clinicians were provided with the clinical history, examination under anaesthesia findings and the diagnostic MRI and PET report. They independently contoured on both the CT and MRI data sets: Gross tumour volume (GTV), uterus, vagina, cervix, parametria and lymph node clinical target volume (LN-CTV). Clinicians were provided with a contouring protocol based on the RTOG consensus guidelines for volume delineation10 and directions on how to contour the LN-CTV based on published guidelines.11 The instructions included which lymph node regions to contour for each patient to limit variability that may be present from determining which clinical nodal region to contour. In addition, if the upper level of the CT data set was higher than the MRI data set, then the CT LN-CTV was analysed only to the upper level of the MRI, to ensure the same LN-CTVs were being compared across imaging modalities.
The CT data set was contoured first and then the MRI was contoured with a break of at least 2 weeks to reduce the impact of recall bias from one imaging modality to another. Clinician contours and the data sets were exported as DICOM-RT files and analysed using in-house software based on the Insight Toolkit.12
Patients with inoperable endometrial cancer undergoing primary radiotherapy were included in this study. These patients have target volumes closely resembling cervical cancer; and encompass the same structures (GTV, uterus, vagina, parametria and the lymph node CTV).
Statistical analysis
To quantify the differences in delineated clinical target volumes between CT and MRI planning data sets the dice similarity coefficient (DSC), which is a measure of overlap between contoured volumes, was calculated for each structure.13 All pairs of contours for each patient and structure were used to calculate the DSC with the mean of the DSC values for each structure providing a measure of the overlap between the clinicians. The mean absolute surface distance (MASD) was also calculated in a similar fashion, this is a measure of on average how much the surface contours differ.13 A paired T-test was used to test statistical significance for contours with an equal sample size and Welch's unequal variances T-test for non-paired contours.
Results
Twenty patients were enrolled in the study and the median age was 59 years (range 26–82 years). Patient demographics and imaging details are displayed in Table 1 below.
| Cervical cancer patients (N = 15) | Number of patients | Endometrial cancer patients (N = 5) | Number of patients |
|---|---|---|---|
| Histopathology | Histopathology | ||
| SCC | 11 | Endometrioid Ca | 2 |
| Adenocarcinoma | 3 | Carcinosarcoma | 2 |
| Neuroendocrine | 1 | Serous cell Ca | 1 |
| Clinical stage | Clinical stage | ||
| Primary tumour | Primary tumour | ||
| T1 | 3 | T1/2 | 0 |
| T2 | 7 | T3 | 3 |
| T3 | 4 | T4 | 0 |
| T4 | 1 | Recurrent tumour (TX) | 2 |
| Nodal stage | Nodal stage | ||
| N0 | 4 | N0 | 3 |
| N1 | 11 | N1 | 0 |
| N2 | 2 | ||
| Distant metastasis | Distant mets | ||
| M0 | 13 | M0 | 3 |
| M1 | 2 | M1 | 2 |
| Imaging | Imaging | ||
| Diagnostic PET fused with data sets | 15 | Diagnostic PET fused with data sets | 0 |
| Planning CT with IV contrast | 10 | Planning CT with IV contrast | 2 |
| Planning CT with PO contrast | 13 | Planning CT with PO contrast | 2 |
| Planning CT with no contrast | 2 | Planning CT with no contrast | 3 |
| Artefact from hip replacement | 2 | Artefact from hip replacement | 0 |
Gross tumour volume
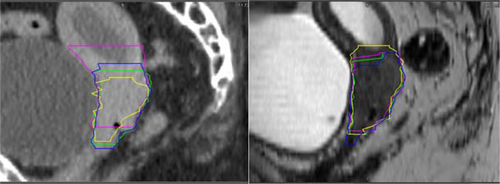
The GTV contours were smaller and more consistent on MRI compared to CT, Tables 2 and 3 display the volume and interobserver variability results. Figure 1 illustrates contouring on a study patient with reduced contouring variability on MRI compared to CT for the GTV.
| Volume analysis (cc) | CT | MRI | P value |
|---|---|---|---|
| GTV | 117.2 | 91.9 | <0.01 |
| Uterus | 59.7 | 55.4 | 0.20 |
| Vagina | 15.4 | 14.8 | 0.82 |
| Parametria | 126.0 | 134.3 | 0.15 |
| LN-CTV | 354.3 | 324.2 | <0.01 |
| Cervix | 30.3 | 7.8 | 0.14 |
| Combined CTV | 599.7 | 560.5 | <0.01 |
| Interobserver variability | CT | MRI | P value |
|---|---|---|---|
| Mean DSC (95% CI) | |||
| GTV | 0.77 (0.73–0.80) | 0.81 (0.79–0.83) | <0.01 |
| Uterus | 0.76 (0.71–0.82) | 0.82 (0.80–0.85) | 0.02 |
| Vagina | 0.54 (0.52–0.57) | 0.52 (0.48–0.55) | 0.24 |
| Parametria | 0.61 (0.59–0.63) | 0.64 (0.62–0.66) | 0.02 |
| LN-CTV | 0.75 (0.74–0.76) | 0.75 (0.74–0.76) | 0.48 |
| Cervix | 0.50 (−0.09–1.08) | 0.48 (0.36–0.61) | 0.97 |
| Combined CTV | 0.80 (0.79–0.81) | 0.81 (0.79–0.82) | 0.27 |
| Mean MASD in mm (95% CI) | |||
| GTV | 3.68 (3.06–4.29) | 3.11 (2.4–3.83) | 0.19 |
| Uterus | 3.37 (2.38–4.37) | 2.23 (1.75–2.71) | 0.01 |
| Vagina | 4.22 (3.61–4.84) | 4.91 (3.74–6.07) | 0.31 |
| Parametria | 5.12 (4.6–5.64) | 5.10 (4.52–5.68) | 0.96 |
| LN-CTV | 3.83 (3.3–4.36) | 3.33 (3.08–3.58) | 0.05 |
| Cervix | 7.69 (-4.6–19.84) | 4.59 (2.88–6.30) | 0.70 |
| Combined CTV | 3.10 (2.67–3.53) | 2.68 (2.49–2.86) | 0.04 |
- CI, confidence interval; DSC, dice similarity co-efficient; MASD, mean absolute surface distance.

Patients were stratified according to the presence of a FDG-PET data set. Five patients did not have a planning PET completed, all these patients had an endometrial primary tumour. These patients had a mean GTV volume on CT 147.5 cc vs MRI 111.2 cc, and both CT and MRI showed a high level of contouring consistency with a mean DSC of 0.85 for both CT and MRI. The 15 patients with a PET tended to have smaller GTV volumes than the patients without a PET; the mean volume on CT was 117.2 cc vs 91.9 cc on MRI. Patients with a PET had more consistent contouring on MRI compared to CT, with a DSC of 0.78 on MRI and 0.71 on CT (P = 0.02).
Six patients had an improvement in the mean DSC >0.08 for MRI compared to CT. The average improvement in mean DSC was 0.17 and the range was 0.08–0.31. These patients had cervical cancer primaries and smaller GTV volumes compared to the rest of the cohort; the average MRI GTV volumes were 29.3 cc vs 115.6 cc (P < 0.01). This group of patients also demonstrated more variability in CT delineation compared to the rest of the CT cohort; the mean DSC was 0.60 (compared to 0.82 in the rest of the CT cohort) and a mean MASD of 6.07 mm (compared to 2.92 mm in the rest of the CT cohort). Figure 2 shows images from a patient in the study that had a large improvement in the mean DSC on MRI compared to CT. There is marked contouring variability on CT (mean DSC = 0.46) and different clinicians appear to incorporate different amounts of the non-PET avid soft tissue in the GTV on CT. On MRI the tumour is well defined and the clinician GTVs are significantly closer in agreement (mean DSC = 0.77).

Uterus
There was no statistically significant difference in the absolute volumes of the uterus contours on CT compared to MRI, however, MRI contours demonstrated improved interobserver agreement compared to CT (Table 3).
Contouring variability appeared to be most marked at the inferior portion of the uterus (the uterine isthmus where the uterine body meets the cervix) and at the fundus in the region of the round and ovarian ligaments. On review visually both these areas had less variability on MRI than CT.
Vagina
The vagina contour volumes overall were not significantly different on MRI compared to CT. The vagina contours on MRI and CT demonstrated more variability than other structures, but there was no difference detected between MRI and CT.
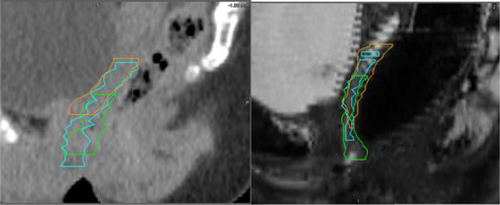
The upper and lower borders of the vagina were associated with more variability compared to the contours on the axial plane, this was evident on both CT and MRI and is demonstrated in Figure 3. On average the difference between the most superior and most inferior contour at the superior border of the vagina was 1.3 cm on CT and 1.6 cm on MRI (P = 0.35). There was a trend to less variation at the inferior border of the vagina on MRI compared to CT, the average difference between the most inferior and superior contours at the lower border of the vagina was 1.5 cm on CT and 1.1 cm on MRI (P = 0.09).

Parametria
There was no statistically significant difference in the absolute volumes of the parametria on MRI compared to CT, however, the contours on MRI demonstrated less variability compared to CT with an improved DSC; visually reviewing the contours variability in the contouring at the posterior extent of the volumes was more consistent on MRI contouring compared to CT
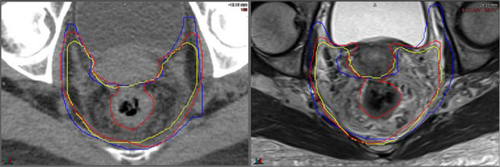
In contrast, the degree of variability at the anterior and superior extent of the volumes did not appear to be significantly different on MRI compared to CT. The variability in the anterior border is exhibited in Figure 4.

Lymph node clinical target volume
The LN-CTV contours were smaller on MRI than CT and demonstrated a good level of contouring consistency on both MRI and CT.
Patients were stratified according to the presence of IV contrast on their CT data set. Eight patients did not have IV contrast for their CT data set; this was given at the discretion of the treating radiation oncologist as per their usual practice for CT simulation. The eight patients with no IV contrast had a mean volume on CT 365.7 cc vs MRI 345.3 cc (P = 0.34) and both CT and MRI showed a good level of contouring consistency with a mean DSC of 0.76 for both CT and MRI. There was no significant difference detected between CT and MRI contouring for the non-contrast or contrast group.
Cervix
The cervix was difficult to visualise on CT with only three patients in the study having a cervix volume contoured on CT. On MRI, 12 patients had cervix contours completed. Volumes were smaller on MRI but no significant difference in interobserver variability was detected.
Combined CTV
The combined CTV volumes were smaller on MRI compared to CT and demonstrated a good level of interobserver agreement on both CT and MRI.
Discussion
Magnetic Resonance Imaging simulation is increasingly being used for radiotherapy treatment planning and there are four MRI-Linac projects underway across the world. There is a need for research examining the impact of MRI simulation on target delineation. Improved soft tissue visualisation does not automatically result in more consistent clinician contouring.14, 15 MRI-guided radiotherapy may allow highly conformal techniques including online adaptive radiotherapy, where volumes are modified in real time to account for day-to-day anatomical changes, these techniques have a necessity for precise and accurate target volumes.16, 17
This study demonstrated that MRI contouring was associated with less variability between clinicians for most structures including the GTV, uterus and parametria which is due to the improved soft tissue definition and visualisation on MRI compared to CT.
For the GTV, the largest benefit of MRI-SIM was seen in patients with early primary tumours that are difficult to visualise on CT. For this group of patients, clinicians appeared to use the fused PET data set to assist with CT contouring, however, there was variability in how the PET information was incorporated into the delineation of contours, some clinicians contoured only the highly avid FDG disease as the GTV whilst others extended the GTV to include non-PET avid soft tissue seen on CT. In contrast, the patients with early stage primaries had well visualised tumours on MRI and clinicians’ MRI contours did not appear to incorporate the PET information into their delineated contours. Information from MRI and PET is complementary; there may be a benefit in combining the data from both; thus, further investigation as to the role of a hybrid PET/MRI for contouring for cervical cancer is an area of future research.
Variability in how far the vagina CTV contours are extended inferiorly was seen on both CT and MRI, this boundary usually determines the lower level of the radiotherapy field. Inaccurate contouring at this site therefore may result in a geographical miss or an increase rate of late vaginal toxicity. Following definitive radiotherapy the rate of isolated vaginal recurrence is very low,18, 19 however, these are associated with significant morbidity and mortality. If the lower boundary is extended too far inferiorly then it may result in increased rates of toxicity such as vaginal fibrosis and stenosis. Studies have shown that up to 26% of women have vaginal symptoms following treatment that cause a significant amount of distress.20 This study found that there was a trend to reduced variability at the inferior vagina boundary on MRI compared to CT.
A previous contouring study of cervical cancer volumes on MRI also showed a higher level of contouring variability for the vagina CTV compared to other structures (average kappa measure of 0.43, compared to GTV kappa measure of 0.68).21 It is not clear whether it is interpretation of the definition (which patients to contour upper half, or two-thirds or the entire vagina10) or the actual measurement of the vagina boundaries that gives rise to the variability seen. The current international prospective trial EMBRACE II includes a protocol for external beam radiotherapy contouring for cervical cancer which specifies that the vaginal CTV extends 2 cm inferior to the gross tumour only,22, 23 this simplified definition would presumably be easier for clinicians to contour and has been adopted by clinicians in the U.K.24
Target volumes for cervical cancer are complex and consist of multiple individual target volumes, this research demonstrated that non-imaging related factors accounted for a significant amount of variation in the contours between clinicians, and this did not differ between contours on CT and MRI. Non-imaging related factors that can impact contours include the interpretation of guidelines and the clinician's education and experience. A recent review of contouring variability has shown that the adoption of protocols and guidelines with specific definitions and detailed contouring atlases to illustrate concepts may improve variability that arises from non-imaging based causes.25 Two areas identified from this study that would benefit from more specific contouring guidelines or clinician education include the parametria and LN-CTV, both these areas demonstrated areas where variability arose between clinicians and did not vary between CT and MRI.
For the parametria the anterior and superior borders had the greatest area of variability not affected by imaging modality. The RTOG definition for the anterior border is the ‘posterior wall of the bladder or posterior border of the external iliac vessels’.10 The true parametria border is the posterior border of the bladder; however, some patients have a small bladder and thus the posterior border of the external iliac vessels can be used for patients with a small bladder that is sitting deep in the pelvis.10 We have proposed a simpler definition where clinicians do not need to assess the subtleties of bladder filling and determine which boundary to use. Inferiorly (below the femoral heads) the posterior wall of the bladder is the anterior boundary, and more superiorly (above the femoral heads) the posterior aspect of the external iliac vessels forms the anterior border. Having a single border in each region is likely to improve consistency between clinicians. The change in using the external iliac vessels as the boundary superiorly may lead to larger volumes in this region for some patients but it is anticipated that this would be a small increase only, and not lead to a significant increase in toxicity given it is away from bowel and rectum.
We have included a proposed MRI contouring atlas as an appendix to complement current guidelines by giving more detailed examples of how to apply the guidelines on multiple axial slices.
The combined CTV demonstrated a high level of contouring consistency on both CT and MRI, with a small improvement of the MASD seen for MRI contouring. The impact on clinical outcomes is being assessed with a planning study to evaluate the dosimetric impact of the contouring differences, and radiobiological modelling will be undertaken to measure the potential clinical impact.
This study is the first examining CT and MRI contouring of all individual target volumes and the overall treatment volumes for external beam radiotherapy for cervical cancer. The impact of MRI on different volumes and different regions was evaluated in detail, examining both treatment volumes and contouring variability using well-recognised measures. All participating clinicians were radiation oncologists subspecialising in gynae-oncology. The patients included were reflective of real world clinical practice including all stages, body habitus and hip replacements.
There are some limitations to this study. All clinicians worked at two centres, one of which was a satellite centre of the primary institution, and therefore may limit the external applicability of the results. Patient heterogeneity may have diluted the results for a particular cancer type. An inherent weakness that occurs with all radiotherapy planning studies is the lack of a definitive RT ‘gold standard’ reference volume. This study has assumed that less variability between clinicians’ contours is a surrogate for more accurate contouring.
In conclusion, MRI contouring for the GTV, Uterus, LN-CTV and Overall-CTV resulted in smaller and more consistent volumes when compared to CT contouring. The largest benefit for contouring the GTV on MRI was seen in patients with early stage primaries. An MRI contouring atlas designed to complement the existing RTOG contouring guidelines is included as an appendix.
Acknowledgements
This work was supported by a Royal Australian and New Zealand College of Radiologists (RANZCR) Research Grant (2013/RANZCR/003).


